
epa-regions-python
EPA regions from Natural Earth data with GeoPandas / regionmask.


Code
python -m epa_regions -r 50m --states-only --save
Installation
With conda (recommended):
conda activate ...
conda install -c conda-forge geopandas regionmask pooch pyogrio
pip install epa-regions
pip install epa-regions does not install any dependencies,
as it is expected that you will have installed them with conda.
geopandas: needed if you want to useepa_regions.get()pooch: for downloading/caching the shapefiles forepa_regions.get()pyogrio: for faster reading of shapefilesregionmask: needed if you want to useepa_regions.to_regionmask()
Note that epa_regions.look_up() requires only pandas,
and you can access the region definitions
(region number, office, and state/territory constituents)
at epa_regions.REGIONS without any 3rd-party dependencies.
python -m epa_regions needs matplotlib.
Usage
import epa_regions

# GeoPandas GeoDataFrame
epa = epa_regions.get(resolution="50m")

# Convert to regionmask Regions for use with gridded data
epa = epa_regions.to_regionmask(epa)
Point data
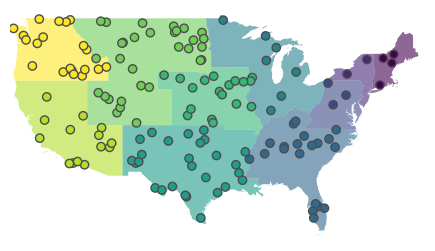
Code
import geopandas as gpd
import matplotlib.pyplot as plt
import numpy as np

import epa_regions

rng = np.random.default_rng(seed=123)

epa = epa_regions.get(resolution="50m")

# CONUS
lonmin, lonmax = -125, -66
latmin, latmax = 24, 50
n = 250
lon = rng.uniform(lonmin, lonmax, n)
lat = rng.uniform(latmin, latmax, n)
points = gpd.GeoDataFrame(
    geometry=gpd.points_from_xy(lon, lat, crs="EPSG:4326")
)

fig, ax = plt.subplots(constrained_layout=True, figsize=(4, 2.5))

epa.plot(column="number", ax=ax, alpha=0.6)
points.sjoin(epa, predicate="within").plot(column="number", ax=ax, ec="0.3", lw=1)

ax.set(xlim=(lonmin, lonmax), ylim=(latmin, latmax))
ax.axis("off")

fig.savefig("points.png", dpi="figure", bbox_inches="tight")
Gridded data
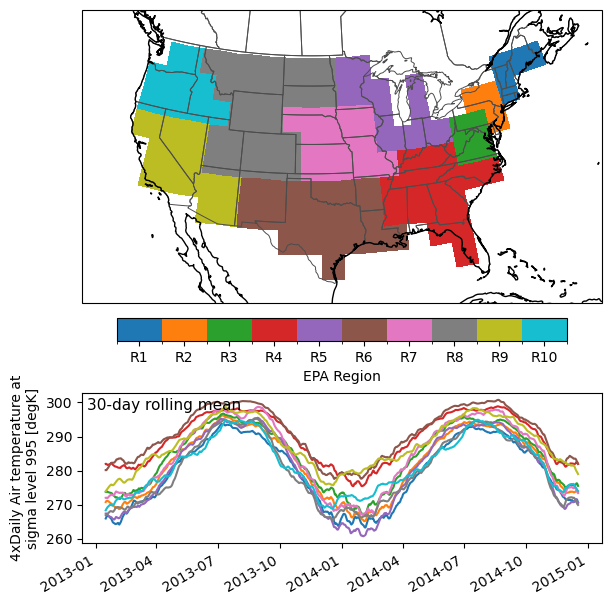
Code
import cartopy.crs as ccrs
import cartopy.feature as cfeature
import matplotlib.pyplot as plt
import numpy as np
import pandas as pd
import xarray as xr

import epa_regions

epa = epa_regions.to_regionmask(epa_regions.get(resolution="50m"))

# CONUS
lonmin, lonmax = -125, -66
latmin, latmax = 24, 50

ds = (
    xr.tutorial.open_dataset("air_temperature")
    .sel(lon=slice(lonmin + 360, lonmax + 360), lat=slice(latmax, latmin))
)
mask = epa.mask(ds.isel(time=0))

proj = ccrs.LambertConformal(central_longitude=-100)
tran = ccrs.PlateCarree()

fig = plt.figure(figsize=(6, 6), constrained_layout=True)

ax = fig.add_subplot(3, 1, (1, 2), projection=proj)

mask.plot.pcolormesh(
    levels=np.arange(mask.min() - 0.5, mask.max() + 1),
    ax=ax,
    transform=ccrs.PlateCarree(),
    cmap="tab10",
    cbar_kwargs=dict(
        orientation="horizontal",
        fraction=0.075,
        pad=0.05,
        ticks=np.arange(mask.min(), mask.max() + 1),
        format="R{x:.0f}",
        label="EPA Region",
    ),
)

ax.add_feature(cfeature.STATES, linewidth=0.7, edgecolor="0.3")
ax.coastlines()
ax.set_extent([lonmin, lonmax - 2, latmin, latmax], crs=tran)
ax.set_title("")

ax = fig.add_subplot(3, 1, 3)

(dt,) = np.unique(ds.time.diff("time"))

window = pd.Timedelta("30D")
(
    ds["air"].groupby(mask)
    .mean()
    .rolling(time=int(window / dt), center=True)
    .mean()
    .plot(
        hue="mask",
        ax=ax,
        add_legend=False,
    )
)

ax.set_xlabel("")
ax.text(
    0.01,
    0.97,
    f"{window.total_seconds() / 86400:g}-day rolling mean",
    ha="left",
    va="top",
    transform=ax.transAxes,
    fontsize=11,
)

fig.savefig("gridded.png", dpi="figure", bbox_inches="tight")
1 maintainer

Metadata
1 maintainer
Release files for epa-regions 0.0.6
For a detailed explanation of source distributions (sdists) and built distributions (wheels), please see the package formats documentation.
Source distribution (sdist)
| File | Size | Uploaded | |
|---|---|---|---|
| epa_regions-0.0.6.tar.gz | 7.8 kB | Details |
Built distribution (wheel)
| File | Interpreter | ABI | Platform | Reset |
|---|---|---|---|---|
| epa_regions-0.0.6-py3-none-any.whl | Python 3 | none | any | Details |
Total release size: 17.0 kB
Release files / epa_regions-0.0.6.tar.gz
| Download URL | epa_regions-0.0.6.tar.gz |
|---|---|
| Size | 7.8 kB |
| Tags | Source |
|
SHA-256 checksum How to use checksums |
83c32f6fbb013eb2261ab937067e5d8335b28aeac7c1c6b2f2487c833dbc9ced
|
|
BLAKE2b-256 checksum How to use checksums |
87c3ac3753735ecf471bf5501454735cc0e31511b43bee4e9b5defa8839ae3b3
|
| Upload date | |
|
Uploaded using Trusted Publishing? What is trusted publishing? |
No |
| Uploaded via |
python-requests/2.34.2
|
Release files / epa_regions-0.0.6-py3-none-any.whl
| Download URL | epa_regions-0.0.6-py3-none-any.whl |
|---|---|
| Size | 9.2 kB |
| Tags | Python 3 |
|
SHA-256 checksum How to use checksums |
1b2f8287861f5299b6e839a4ac9b1865df11223280a810ff637981f60643cf66
|
|
BLAKE2b-256 checksum How to use checksums |
abf368357087ff12b0e689c926467e4603e1db4e4b89c3a411e719473dd095ab
|
| Upload date | |
|
Uploaded using Trusted Publishing? What is trusted publishing? |
No |
| Uploaded via |
python-requests/2.34.2
|














