Photometric polar diagram generator for EULUMDAT (.ldt) files — extension to eulumdat-py

Project description
eulumdat-plot


Photometric polar diagram generator for EULUMDAT (.ldt) files —
designed for product datasheets and publication-ready documents.
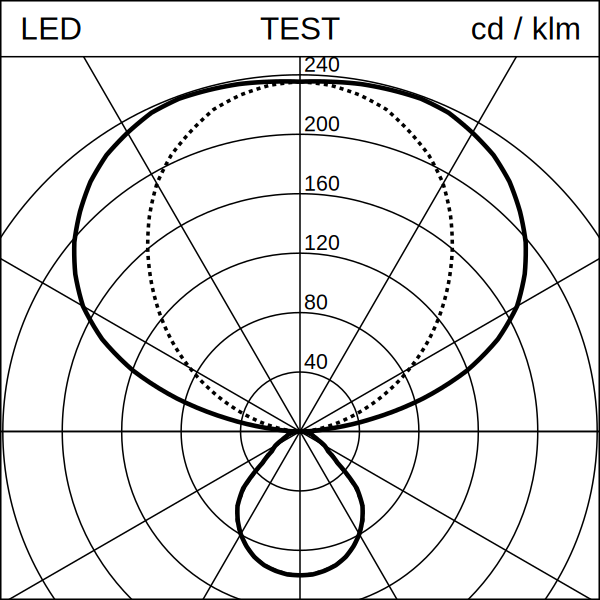
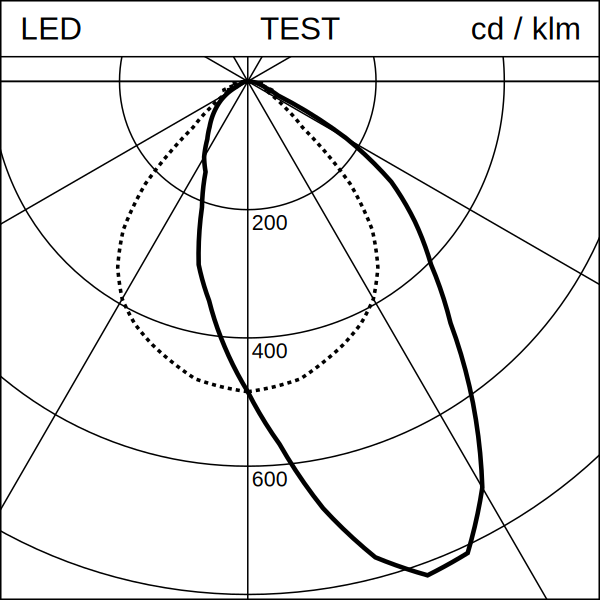
Reads a .ldt file and produces a Lumtopic-style SVG: a square image
with a top banner and a polar candela distribution diagram showing the
C0/C180 (solid) and C90/C270 (dotted) curves, scaled to fill the plot area.
For scientific / interactive plots (matplotlib, axis labels, legends), see the eulumdat-py examples.
Part of the eulumdat-* ecosystem, built
on top of eulumdat-py.
Features
- Reads any EULUMDAT file — all symmetry types (ISYM 0–4) handled by
eulumdat-py - Generates a publication-ready SVG polar diagram (Lumtopic style)
- Dynamic radial scale (3–6 concentric circles, round values)
- Dominant-hemisphere detection for automatic scale label placement
- Proportional scaling via
Layout.for_size(n)— one parameter controls everything - Optional I(γ) interpolation (linear or cubic spline) for smooth curves
- Optional raster export to PNG and JPEG (cross-platform, no native DLL)
- Debug mode for visual validation of C-plane assignment
Installation
Core package (SVG generation only):
pip install eulumdat-plot
With raster export (PNG / JPEG):
pip install "eulumdat-plot[export]"
With cubic spline interpolation:
pip install "eulumdat-plot[cubic]"
Everything:
pip install "eulumdat-plot[full]"
Quick start
from eulumdat_plot import plot_ldt

# Generate an SVG next to the source file
svg = plot_ldt("luminaire.ldt")

# With a distribution code in the banner centre
svg = plot_ldt("luminaire.ldt", code="D53")
Scaling
All visual parameters (stroke widths, font sizes, margins) scale proportionally from the 1181 px reference with a single call:
from eulumdat_plot import plot_ldt, Layout

svg = plot_ldt("luminaire.ldt", layout=Layout.for_size(600))
Raster export
from eulumdat_plot import plot_ldt, Layout
from eulumdat_plot.export import svg_to_png, svg_to_jpg

svg = plot_ldt("luminaire.ldt", layout=Layout.for_size(1181))
png = svg_to_png(svg, size_px=600)
jpg = svg_to_jpg(svg, size_px=600, quality=95)
The export size is independent of the SVG canvas size.
API reference
plot_ldt()
def plot_ldt(
    ldt_path: str | Path,
    svg_path: str | Path | None = None,
    *,
    code: str = "",
    layout: Layout | None = None,
    interpolate: bool = True,
    interp_step_deg: float = 1.0,
    interp_method: str = "linear",
    debug: bool = False,
) -> Path
| Parameter | Default | Description |
|---|---|---|
ldt_path |
— | Source .ldt file |
svg_path |
same name, .svg |
Output SVG path |
code |
"" |
Distribution code shown in the banner centre |
layout |
Layout() |
Visual parameters |
interpolate |
True |
Resample I(γ) before plotting |
interp_step_deg |
1.0 |
Angular step for resampling (degrees) |
interp_method |
"linear" |
"linear" or "cubic" (requires scipy) |
debug |
False |
Colour-code C-planes for visual validation |
Layout.for_size()
Layout.for_size(size_px: int) -> Layout
Creates a Layout with all dimensions scaled proportionally from the
1181 px reference. Layout.for_size(1181) is identical to Layout().
svg_to_png() / svg_to_jpg()
svg_to_png(svg_path, png_path=None, *, size_px=1181, background="#FFFFFF") -> Path
svg_to_jpg(svg_path, jpg_path=None, *, size_px=1181, background="#FFFFFF", quality=95) -> Path
Requires pip install "eulumdat-plot[export]".
Examples
| File | Description |
|---|---|
examples/01_basic_usage.md |
Generate an SVG from a .ldt file |
examples/02_resize_and_export.md |
Scaling, raster export, batch processing |
Project structure
eulumdat-plot/
├── data/
│   ├── input/          # sample .ldt files (ISYM 0–4)
│   └── output/         # generated SVG / PNG / JPEG
├── docs/
│   └── img/
│       └── sample_01.svg
├── examples/
│   ├── 01_basic_usage.md
│   └── 02_resize_and_export.md
├── src/
│   └── eulumdat_plot/
│       ├── __init__.py
│       ├── plot.py     # public API — LDT → SVG pipeline
│       ├── renderer.py # SVG renderer + Layout dataclass
│       └── export.py   # raster export (PNG / JPEG)
├── tests/
│   ├── test_smoke.py   # 46 real LDT files, all ISYM types
│   └── test_scaling.py # Layout.for_size() proportionality
├── pyproject.toml
├── CHANGELOG.md
└── README.md
EULUMDAT ecosystem
| Package | Status | Description |
|---|---|---|
eulumdat-py |
v0.1.4 | Read / write EULUMDAT files |
eulumdat-symmetry |
v1.0.0 | Symmetrise EULUMDAT files |
eulumdat-plot |
v1.0.0 | Photometric polar diagram — this package |
eulumdat-luminance |
planned | Luminance table cd/m² (γ 55°–85°) |
eulumdat-ugr |
planned | UGR calculation (CIE 117, CIE 190) |
Requirements
- Python ≥ 3.9
eulumdat-py≥ 1.0.0numpy≥ 1.21svgwrite≥ 1.4- (optional)
vl-convert-python≥ 1.6 +Pillow≥ 9.0 — raster export - (optional)
scipy≥ 1.7 — cubic spline interpolation
License
MIT — © 2024 123VincentB


Download files
Download the file for your platform. If you're not sure which to choose, learn more about installing packages.
Source Distribution
Built Distribution
Filter files by name, interpreter, ABI, and platform.
If you're not sure about the file name format, learn more about wheel file names.
Copy a direct link to the current filters
File details
Details for the file eulumdat_plot-1.0.1.tar.gz.
File metadata
- Download URL: eulumdat_plot-1.0.1.tar.gz
- Upload date:
- Size: 21.2 kB
- Tags: Source
- Uploaded using Trusted Publishing? No
- Uploaded via: twine/6.2.0 CPython/3.10.11
File hashes
| Algorithm | Hash digest | |
|---|---|---|
| SHA256 |
3e03d3bb312770828b3080150531e19711ac3abf574b17436b36f83b7ad6659c
|
|
| MD5 |
4c4c9bed9216ea54b774c8cace5e35c2
|
|
| BLAKE2b-256 |
48d89cd5d3c4a5a6f03618ef71a766e0b592a1ba0be2775b7c1ba5c9e1f851a4
|
File details
Details for the file eulumdat_plot-1.0.1-py3-none-any.whl.
File metadata
- Download URL: eulumdat_plot-1.0.1-py3-none-any.whl
- Upload date:
- Size: 16.9 kB
- Tags: Python 3
- Uploaded using Trusted Publishing? No
- Uploaded via: twine/6.2.0 CPython/3.10.11
File hashes
| Algorithm | Hash digest | |
|---|---|---|
| SHA256 |
fa7f13fb5a2cabcfeea0e923befa023b29339600696e558f8004c9bc99b29b6a
|
|
| MD5 |
b86a9d40a182a85ba9e44a84ef3e64b7
|
|
| BLAKE2b-256 |
1d20b7009bf2e14e89832bf16dd37e0bffbabcce63514692daffdba58b2bb8c6
|


