
figure-gate


Two scripts that read a built matplotlib figure and report which gates it
fails. audit(fig) returns (ok, rows) — 19 rows, one per gate, each a
(label, status, detail) triple where status is True, False, or
"warn". check(colors) does the same for a palette in 5 rows. Every
threshold is a module-level constant you can read and change.
There is also an Agent Skill wrapper that applies the same checks when Claude Code builds a figure.
git clone https://github.com/narenp12/figure-gate && cd figure-gate
python skill/scripts/check_palette.py "#E69F00,#56B4E9,#009E73" --pairs all
python skill/scripts/check_figure.py     # self-test on a broken figure
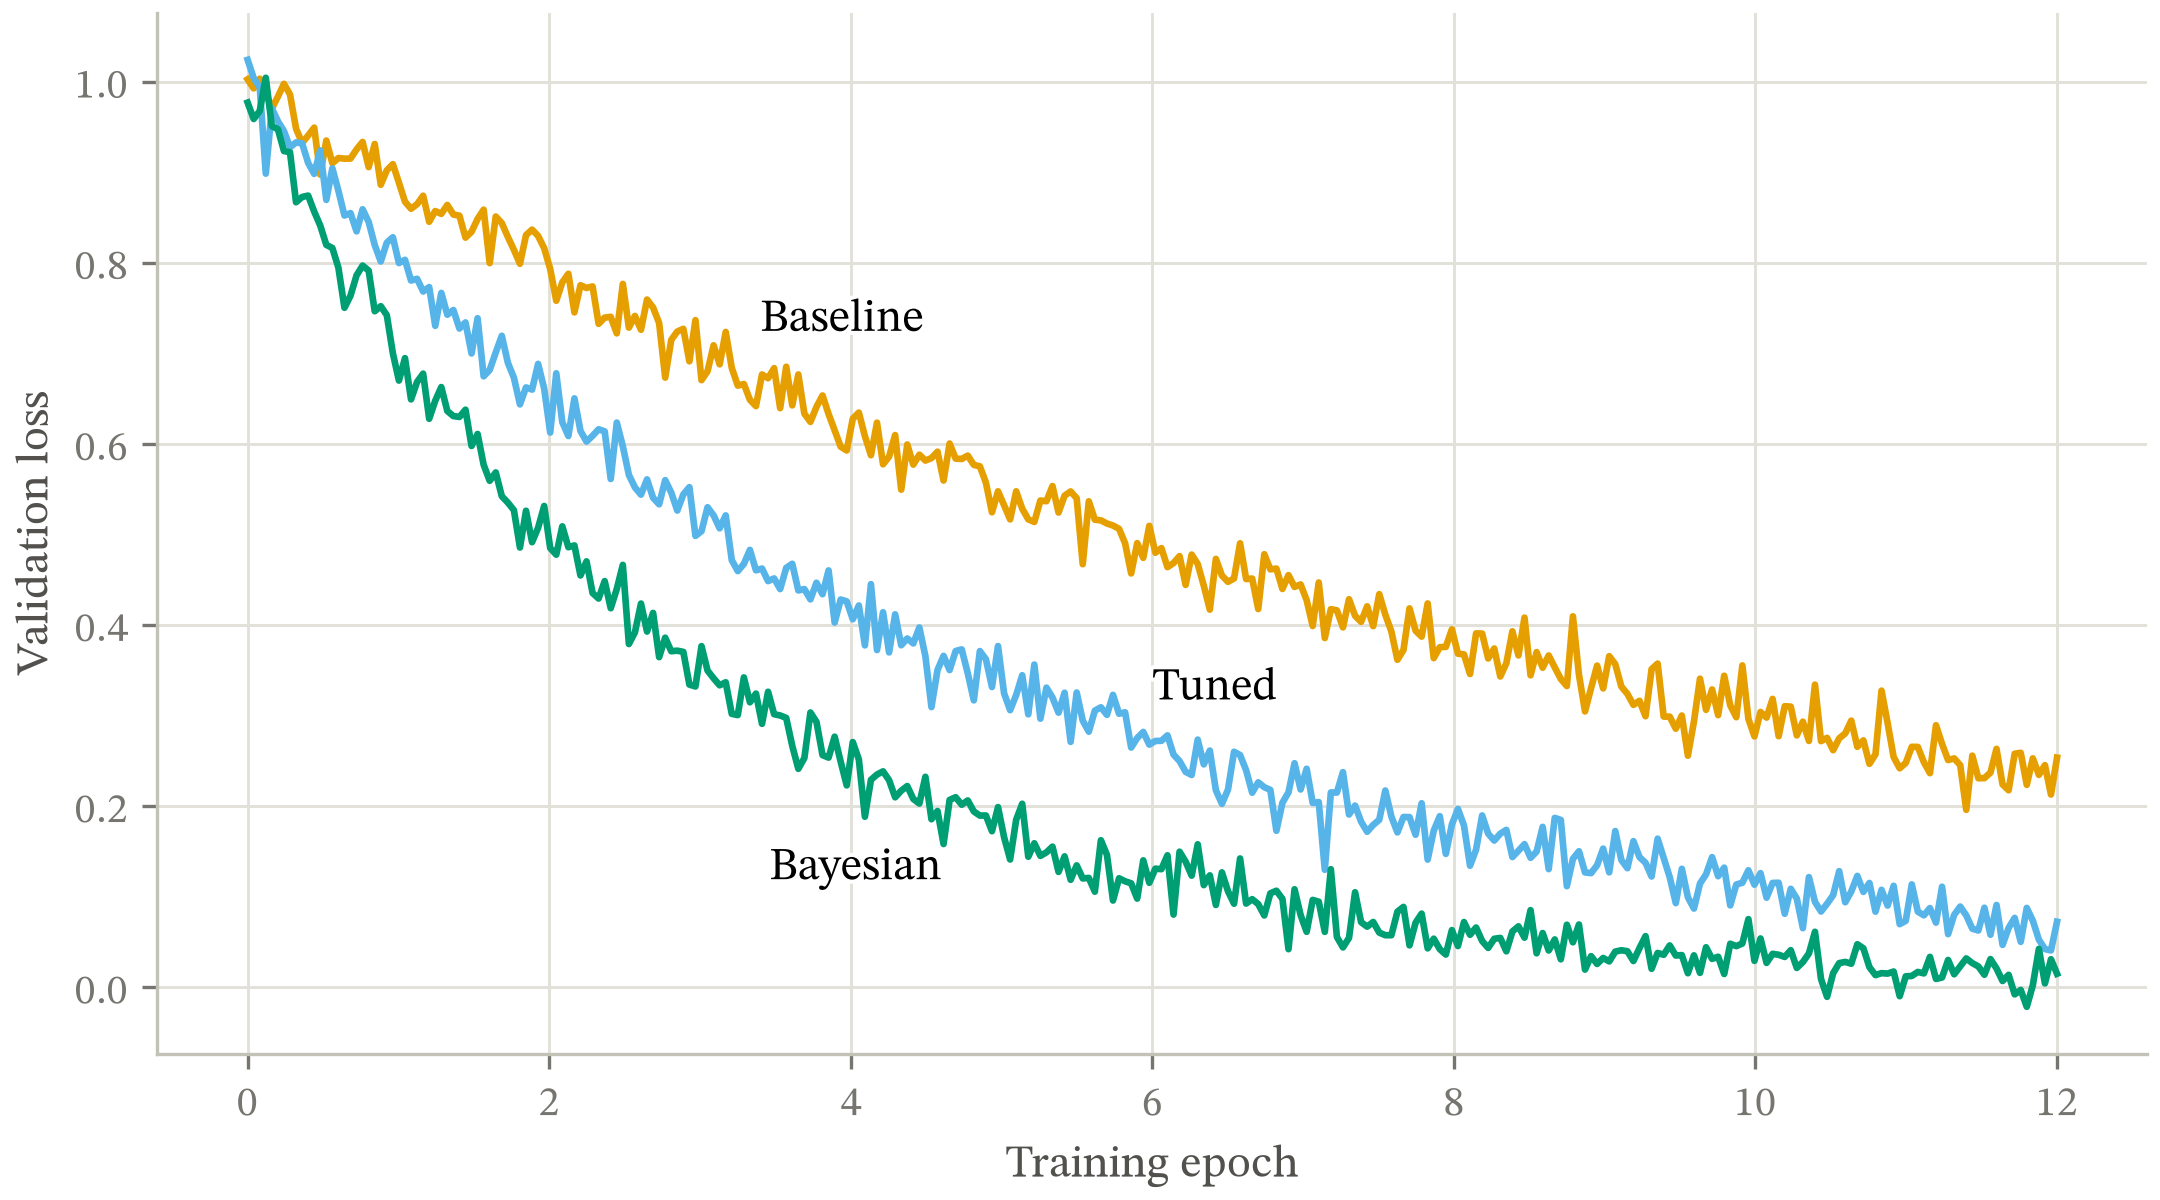
python examples/demo.py builds that figure and audits it, with every
decision commented against the failure it avoids. python examples/gallery.py
covers the harder forms: a shared-axis grid, a filled field with a colorbar, an
axis-free schematic, three statistical forms, a log-log convergence plot with a
slope triangle, and a dense attractor. Writing those six found five defects in
the checks themselves.
Why the two scripts talk to each other
A figure on matplotlib's default tab10 cycle, with a twinx second axis,
returned 19 passing rows from the composition checks. check_palette.py rated
that same cycle's orange and green at dE 1.4 under protanopia — one hue to that
reader, against a floor of 8. The composition checker had no access to the
colors it was drawing.
check_series_color closes that. It reads the hues off the figure's own
artists, decides from the mark types whether the figure needs adjacent
separation (lines, bars) or all-pairs separation (scatter), and runs them
through the palette gates. That is row 11 of the 19.
What each gate measures
check_palette.py — takes hex strings on the command line or via
check(), imports nothing outside the standard library. Distances are OKLab
dE x100.
| Gate | Threshold | Fails when |
|---|---|---|
| Lightness band | L_MIN, L_MAX = 0.43, 0.77 |
OKLab lightness outside the band |
| Chroma floor | CHROMA_MIN = 0.10 |
OKLab chroma below it — the color reads as gray |
| CVD separation | CVD_TARGET = 8.0 |
two hues under 8 dE in protan or deutan simulation |
| Normal-vision floor | NORMAL_FLOOR = 15.0 |
two hues under 15 dE in full color |
| Contrast vs surface | CONTRAST_MIN = 3.0 |
a hue under 3:1 on the page (advisory) |
--ordinal swaps those five rows for four that apply to a ramp: lightness
monotone, adjacent dL gap, light-end contrast, and step uniformity
(largest/smallest dL). Protanopia and deuteranopia are gated, together about 8%
of males. Tritan separation is measured and printed in the detail string but
not gated: prevalence is around 0.01%, and the Vienot matrix used here is
validated only for the red-green forms, so the number is indicative rather than
decisive.
check_figure.py — renders the figure through an Agg canvas and measures
the result. audit() returns these 19 rows in this order.
| Gate | Threshold | Fails when |
|---|---|---|
| Clipping | canvas bounds | a text artist's bbox extends past the canvas |
| Text collision | bbox overlap | two text bboxes overlap, tick labels on a shared axis exempted |
| Text readability | TEXT_CONTRAST_MIN = 4.5 |
text misses WCAG AA against the backdrop it actually got, or data ink crosses its glyphs |
| Contrast stack | ALPHA_LEVELS_MAX = 3 |
nothing in the figure is opaque, or transparency uses more than 3 distinct levels |
| Mark ratio | MARK_RATIO_MAX = 5.0 |
largest data mark exceeds 5x the smallest by area |
| Overplotting | OVERPLOT_THRESHOLD = 0.5 |
over half a scatter's points have a nearest neighbour inside one marker radius |
| Axis redundancy | shared scale | panels on a shared scale repeat tick labels or axis titles |
| Type size | TYPE_FLOOR_PT = 7.5 |
a string renders under 7.5pt on the printed page |
| Line weight | LINE_FLOOR_PT = 1.0 |
a stroke renders under 1pt on the printed page (SIAM's floor) |
| Ink coverage | INK_MIN, INK_MAX = 0.02, 0.55 |
a panel's ink fraction falls outside the band (advisory) |
| Series color | palette gates, MAX_SERIES_HUES = 6 |
the hues actually drawn fail CVD or normal-vision separation, or one panel carries more than 6 |
| Dual axis | — | a twinx second scale carries data of its own |
| Form | — | pie, 3D, or bars on a truncated baseline |
| Identity channel | — | two or more series, no legend and no text in the axes (advisory) |
| Label attribution | LABEL_MARGIN = 2.0 |
a label's nearest other series is closer than 2x its distance to the one it names |
| Style sheet | 40 keys | the rcParams in effect differ from figure.mplstyle (advisory) |
| Contour dash | — | a signed contour set dashes its negative levels |
| Fonts | Type 42 | PDF/PS export would embed Type 3, or no named typeface resolves (advisory) |
| Alt text | ALT_TEXT_MIN_CHARS = 60 |
no description is attached, or the attached one is under 60 characters (advisory) |
Thresholds cite a published floor where one exists — SIAM's one point, WCAG's
4.5:1, the Nature/Science/PNAS type minima. The rest were measured, and
skill/references/style-guide.md records the measurement and the figure that
motivated each one.
The gate that catches people
Type size is measured on the printed page, not on the canvas. A figure authored
at 14 inches (1008pt) and placed on a 750pt slide renders at 750/1008 = 0.74x,
so a 9pt label arrives at 6.7pt — under the 7.5pt floor, and under it by an
amount no one notices on a monitor. page_scale derives that ratio per figure
and the type gate measures what renders, so sizes set through rcParams or by a
helper are caught along with the ones set inline.
Placing at a fraction of the content width changes the ratio again:
audit(fig, placed_frac=0.48) mirrors \includegraphics[width=0.48\textwidth],
and without it a half-width figure is certified at twice the type size it
ships at. For a venue in the table, audit(fig, venue="neurips") supplies the
width; python check_figure.py --venues prints all twelve with their content
widths in points.
Install
Copy three files. check_palette.py needs only the standard library;
check_figure.py needs matplotlib; scipy is optional and changes only speed
(check_overplotting uses a KD-tree when scipy imports and an O(n^2) numpy
path when it does not).
git clone https://github.com/narenp12/figure-gate
cp figure-gate/skill/assets/figure.mplstyle       your-project/diagrams/
cp figure-gate/skill/scripts/check_palette.py     your-project/diagrams/
cp figure-gate/skill/scripts/check_figure.py      your-project/diagrams/
Installing instead of vendoring pins a version and puts the same two checkers
on PATH as check-palette and check-figure:
uv add figure-gate # or: uv tool install figure-gate
Copying is the default because a vendored checker is one you can read and edit beside the figures it gates, and the thresholds are meant to be edited.
Two settings need your document's values:
font.serifinfigure.mplstyle— your document's body typeface.CONTENT_WIDTH_PTat the top ofcheck_figure.py— the usable width of the page, in points. LeftNone, the scale is 1.0 and the page calculation does nothing, which is correct if you author each figure at the width it is placed at.venue=overrides it per call.
As a Claude Code skill
cp -r figure-gate/skill ~/.claude/skills/research-figures
Claude then runs these checks when you ask for a figure for a paper or a deck.
skill/SKILL.md is the workflow; skill/references/style-guide.md is the
measurement behind each threshold.
Use it
from pathlib import Path

import numpy as np
import matplotlib
matplotlib.use("agg")
import matplotlib.pyplot as plt
from matplotlib import colormaps

from check_figure import report

plt.style.use(str(Path(__file__).parent / "figure.mplstyle"))

x = np.linspace(0, 12, 300)
y = np.exp(-0.12 * x)

okabe = colormaps["okabe_ito"]          # matplotlib >= 3.11
fig, ax = plt.subplots(figsize=(7, 4), constrained_layout=True)
ax.plot(x, y, color=okabe(1))           # line width comes from the sheet

report(fig, "my-figure")                # prints 19 rows, returns True if ok
Two details that are load-bearing. The style sheet is resolved relative to
__file__, because plt.style.use("figure.mplstyle") resolves against the
working directory and breaks the first time a test runner or build script
invokes the module from elsewhere. And the backend is set explicitly: the
checks measure rendered geometry, and the examples in this repository all call
matplotlib.use("agg") before importing pyplot for that reason.
audit is the same checks without the printing, which is what a test wants:
from check_figure import audit

@pytest.mark.parametrize("name", sorted(FIGURES))
def test_figure_is_composed(name):
    ok, rows = audit(build(name))
    assert ok, "\n".join(f"{k}: {d}" for k, s, d in rows if not s)
Where this sits
Prescriptive style sheets already exist and are good: SciencePlots and LovelyPlots for journal looks, tueplots and mpl_sizes for exact conference sizing. Accessibility tooling exists too: matplotalt generates alt text, Chart4Blind converts a chart image into an accessible one, contrast reporters check colors in isolation.
Each of those acts before or beside the figure. None of them reads the built result and reports what it fails, which is the only thing here — so a style sheet and this are complementary: set defaults with one, verify them with the other.
What it does not do
Every check is an elimination gate: each one forbids a single enumerated failure, and none looks at the figure as a whole. 19 passing rows means the figure avoids 19 named defects. It does not mean the figure is good, and the checker cannot see that an arrow points at the wrong object, that reading order runs backwards, or that a label is true of the concept and false of the curve beside it. Render it and look at it.
The rules also do not transfer to interactive web charts, where hover, responsive reflow and dark mode change most of the constraints.
Design notes
Use what matplotlib ships. viridis for sequential, RdBu for diverging,
okabe_ito for categorical, style sheets for defaults, constrained_layout
for layout. Earlier versions hand-rolled all four and each was worse: RdBu's
poles clear every gate in check_palette.py unmodified, and a windowed custom
ramp discarded 35% of viridis for no measured gain.
WARN is not FAIL. Five rows are advisory. A sub-3:1 hue is legal when it carries a direct label; a heatmap panel legitimately measures 0.98 ink coverage. Failing those would train people to ignore the row, and an ignored gate is worth less than no gate.
Gates are tested for their ability to fail. The suite is 166 tests, and
each check has one asserting it catches a figure with exactly that defect. The
style sheet has its own tests because # starts a comment in matplotlib's
style format: grid.color: #e1e0d9 parses as an empty value, matplotlib keeps
its default, and every other test stays green.
The full reasoning — measurements behind each threshold, and the rules that
were tried and reverted — is in
skill/references/style-guide.md.
Which form the data wants is the decision no styling rule rescues, and it is
in skill/references/choosing-a-form.md,
built on Cleveland & McGill's ordering of the elementary perceptual tasks. Only
its mechanical subset is gated: a script can rule out a pie or a truncated bar
baseline, but it cannot tell you a box plot is hiding an n of 8.
Requirements
check_palette.py— Python 3.8+, standard library only. Tested on 3.8, 3.9, 3.11 and 3.13. Copied, it runs on 3.8; installed from PyPI it does not, because the package carriescheck_figure.pytoo and that needs 3.9.check_figure.py— Python 3.9+, matplotlib 3.8+.colormaps["okabe_ito"]needs matplotlib 3.11+. On older versions the palette is eight hex strings, listed in the style guide.
Those are the versions CI runs the palette checker on, with no pip install at
all, because "standard library only" is a load-bearing claim. The test job runs
against the current matplotlib and pins one row to 3.8.4, so a break in either
direction shows up.
Contributing
New gates are welcome at the bar the project holds itself to: a test proving the gate fails on a figure with that defect, a test proving it does not over-fire on the nearest legitimate case, and a note naming the real failure that motivated it. See CONTRIBUTING.md and SECURITY.md.
License
MIT — see LICENSE.
1 maintainer

Download files
Download the file for your platform. If you're not sure which to choose, learn more about installing packages.
Source Distribution
Built Distribution
Filter files by name, interpreter, ABI, and platform.
If you're not sure about the file name format, learn more about wheel file names.
Copy a direct link to the current filters
File details
Details for the file figure_gate-0.1.2.tar.gz.
File metadata
- Download URL: figure_gate-0.1.2.tar.gz
- Upload date:
- Size: 1.4 MB
- Tags: Source
- Uploaded using Trusted Publishing? Yes
- Uploaded via:
twine/6.1.0 CPython/3.13.14
File hashes
| Algorithm | Hash digest | |
|---|---|---|
| SHA256 |
1974a7ecae3996f0fc1360c5ec1a6828f8521ae9c14ee1062e4b85b3769fd42b
|
|
| MD5 |
f500ac953aa4d4c072e5d45adabe6d6d
|
|
| BLAKE2b-256 |
500e520a35a51a6b713afaa8a7caeaa5700788d4adf575f552b6336b389ffe47
|
Provenance
The following attestation bundles were made for figure_gate-0.1.2.tar.gz:
Publisher:
release.yml on narenp12/figure-gate
-
Statement:
-
Statement type:
https://in-toto.io/Statement/v1 -
Predicate type:
https://docs.pypi.org/attestations/publish/v1 -
Subject name:
figure_gate-0.1.2.tar.gz -
Subject digest:
1974a7ecae3996f0fc1360c5ec1a6828f8521ae9c14ee1062e4b85b3769fd42b - Sigstore transparency entry: 2267000369
- Sigstore integration time:
-
Permalink:
narenp12/figure-gate@77c53b03a4cebb388c10e63f33189725290d6087 -
Branch / Tag:
refs/tags/v0.1.2 - Owner: https://github.com/narenp12
-
Access:
public
-
Token Issuer:
https://token.actions.githubusercontent.com -
Runner Environment:
github-hosted -
Publication workflow:
release.yml@77c53b03a4cebb388c10e63f33189725290d6087 -
Trigger Event:
push
-
Statement type:
File details
Details for the file figure_gate-0.1.2-py3-none-any.whl.
File metadata
- Download URL: figure_gate-0.1.2-py3-none-any.whl
- Upload date:
- Size: 40.6 kB
- Tags: Python 3
- Uploaded using Trusted Publishing? Yes
- Uploaded via:
twine/6.1.0 CPython/3.13.14
File hashes
| Algorithm | Hash digest | |
|---|---|---|
| SHA256 |
9e71d27be1dc5ac017dfd9861eb4cb54a517c6f2d1dbfc7481e0d0846b2de475
|
|
| MD5 |
c16e93f28cc3d4ed966687db566883dc
|
|
| BLAKE2b-256 |
28c05b72d567667aa24162d2440ec784c1469358c4fcfb02019a5d2362994642
|
Provenance
The following attestation bundles were made for figure_gate-0.1.2-py3-none-any.whl:
Publisher:
release.yml on narenp12/figure-gate
-
Statement:
-
Statement type:
https://in-toto.io/Statement/v1 -
Predicate type:
https://docs.pypi.org/attestations/publish/v1 -
Subject name:
figure_gate-0.1.2-py3-none-any.whl -
Subject digest:
9e71d27be1dc5ac017dfd9861eb4cb54a517c6f2d1dbfc7481e0d0846b2de475 - Sigstore transparency entry: 2267000493
- Sigstore integration time:
-
Permalink:
narenp12/figure-gate@77c53b03a4cebb388c10e63f33189725290d6087 -
Branch / Tag:
refs/tags/v0.1.2 - Owner: https://github.com/narenp12
-
Access:
public
-
Token Issuer:
https://token.actions.githubusercontent.com -
Runner Environment:
github-hosted -
Publication workflow:
release.yml@77c53b03a4cebb388c10e63f33189725290d6087 -
Trigger Event:
push
-
Statement type:














