Convert matplotlib contour plots to geojson


Project description
# geojsoncontour
[](https://travis-ci.org/bartromgens/geojsoncontour) [](https://badge.fury.io/py/geojsoncontour) [](https://coveralls.io/github/bartromgens/geojsoncontour?branch=master)
A Python 3 module to convert matplotlib contour plots to geojson. Supports both contour and contourf plots.
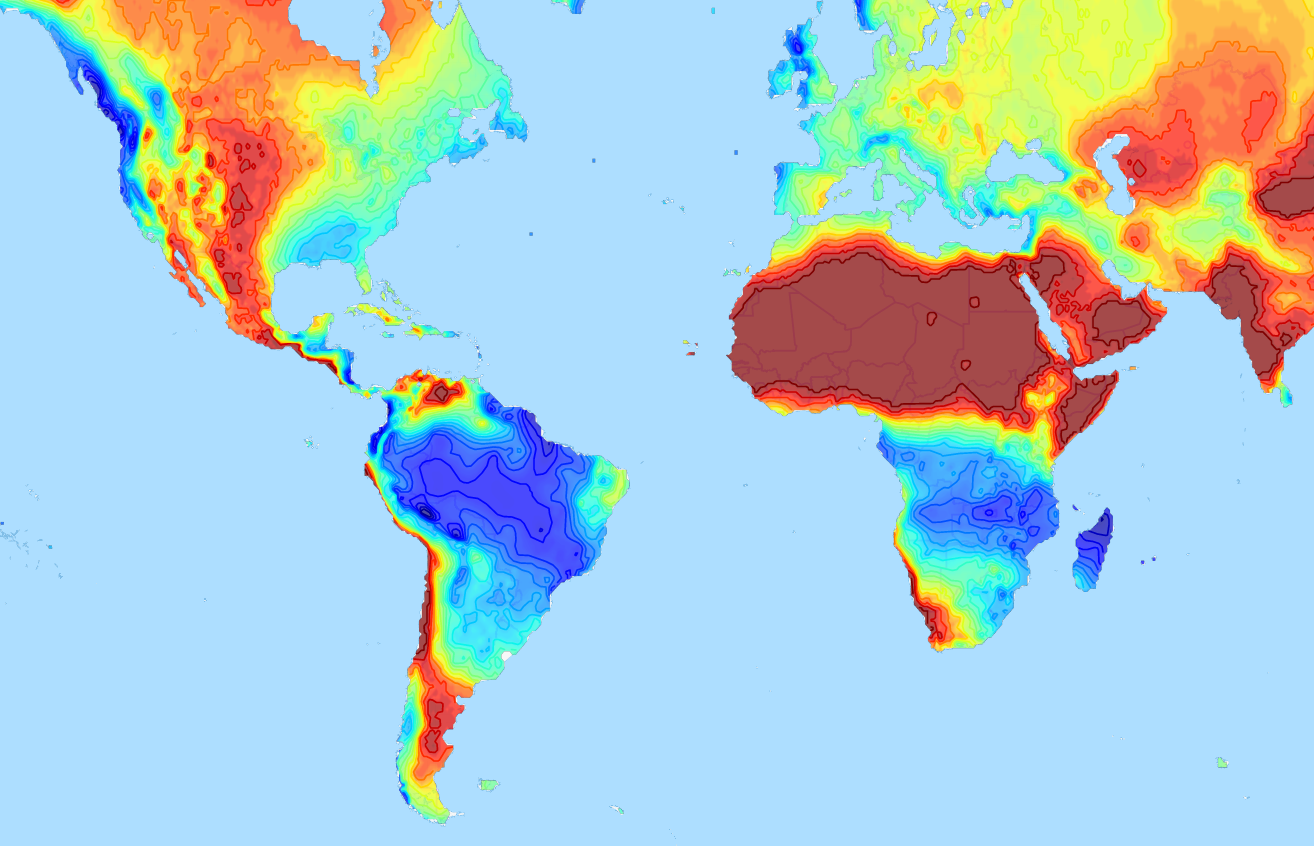
Designed to show geographical [contour plots](http://matplotlib.org/examples/pylab_examples/contour_demo.html),
created with [matplotlib/pyplot](https://github.com/matplotlib/matplotlib), as vector layer on interactive slippy maps like [OpenLayers](https://github.com/openlayers/ol3) and [Leaflet](https://github.com/Leaflet/Leaflet).
Demo project that uses geojsoncontour: [climatemaps.romgens.com](http://climatemaps.romgens.com)
## Installation
Install with pip,
```
$ pip install geojsoncontour
```
## Usage
Use `contour_to_geojson` to create a geojson with contour lines from a `matplotlib.contour` plot (not filled).
Use `contourf_to_geojson` to create a geojson with filled contours from a `matplotlib.contourf` plot.
### Contour plot to geojson
```python
import numpy
import matplotlib.pyplot as plt
import geojsoncontour
# Create contour data lon_range, lat_range, Z
<your code here>
# Create a contour plot plot from grid (lat, lon) data
figure = plt.figure()
ax = figure.add_subplot(111)
contour = ax.contour(lon_range, lat_range, Z, cmap=plt.cm.jet)
# Convert matplotlib contour to geojson
geojson = geojsoncontour.contour_to_geojson(
contour=contour,
ndigits=3,
unit='m'
)
```
For filled contour plots (`matplotlib.contourf`) use `contourf_to_geojson`.
See [example_contour.py](examples/example_contour.py) and [example_contourf.py](examples/example_contourf.py) for simple but complete examples.
### Show the geojson on a map
An easy way to show the generated geojson on a map is the online geojson renderer [geojson.io](http://geojson.io).
### Style properties
Stroke color and width are set as geojson properties following https://github.com/mapbox/simplestyle-spec.
### Create geojson tiles
Try [geojson-vt](https://github.com/mapbox/geojson-vt) or [tippecanoe](https://github.com/mapbox/tippecanoe) if performance is an issue and you need to tile your geojson contours.
## Tests
Run all tests,
```
python -m unittest discover
```
[](https://travis-ci.org/bartromgens/geojsoncontour) [](https://badge.fury.io/py/geojsoncontour) [](https://coveralls.io/github/bartromgens/geojsoncontour?branch=master)
A Python 3 module to convert matplotlib contour plots to geojson. Supports both contour and contourf plots.
Designed to show geographical [contour plots](http://matplotlib.org/examples/pylab_examples/contour_demo.html),
created with [matplotlib/pyplot](https://github.com/matplotlib/matplotlib), as vector layer on interactive slippy maps like [OpenLayers](https://github.com/openlayers/ol3) and [Leaflet](https://github.com/Leaflet/Leaflet).
Demo project that uses geojsoncontour: [climatemaps.romgens.com](http://climatemaps.romgens.com)

## Installation
Install with pip,
```
$ pip install geojsoncontour
```
## Usage
Use `contour_to_geojson` to create a geojson with contour lines from a `matplotlib.contour` plot (not filled).
Use `contourf_to_geojson` to create a geojson with filled contours from a `matplotlib.contourf` plot.
### Contour plot to geojson
```python
import numpy
import matplotlib.pyplot as plt
import geojsoncontour
# Create contour data lon_range, lat_range, Z
<your code here>
# Create a contour plot plot from grid (lat, lon) data
figure = plt.figure()
ax = figure.add_subplot(111)
contour = ax.contour(lon_range, lat_range, Z, cmap=plt.cm.jet)
# Convert matplotlib contour to geojson
geojson = geojsoncontour.contour_to_geojson(
contour=contour,
ndigits=3,
unit='m'
)
```
For filled contour plots (`matplotlib.contourf`) use `contourf_to_geojson`.
See [example_contour.py](examples/example_contour.py) and [example_contourf.py](examples/example_contourf.py) for simple but complete examples.
### Show the geojson on a map
An easy way to show the generated geojson on a map is the online geojson renderer [geojson.io](http://geojson.io).
### Style properties
Stroke color and width are set as geojson properties following https://github.com/mapbox/simplestyle-spec.
### Create geojson tiles
Try [geojson-vt](https://github.com/mapbox/geojson-vt) or [tippecanoe](https://github.com/mapbox/tippecanoe) if performance is an issue and you need to tile your geojson contours.
## Tests
Run all tests,
```
python -m unittest discover
```
Release history Release notifications | RSS feed


Download files
Download the file for your platform. If you're not sure which to choose, learn more about installing packages.
Source Distributions
No source distribution files available for this release.See tutorial on generating distribution archives.
Built Distribution
Filter files by name, interpreter, ABI, and platform.
If you're not sure about the file name format, learn more about wheel file names.
Copy a direct link to the current filters
File details
Details for the file geojsoncontour-0.2.1-py3-release-any.whl.
File metadata
- Download URL: geojsoncontour-0.2.1-py3-release-any.whl
- Upload date:
- Size: 8.2 kB
- Tags: Python 3
- Uploaded using Trusted Publishing? No
File hashes
| Algorithm | Hash digest | |
|---|---|---|
| SHA256 |
8eb6b2092adae28e9bd8d184da01cf22e425f18164e15432bcf3fc6a23cfd118
|
|
| MD5 |
aba2a5f556b1528e0cb9594a23a76a7a
|
|
| BLAKE2b-256 |
fd0824a58eb329126dad04b7010a1132dd4fa653aaec348cd3c28484289a0949
|


