Create heatmaps with shapes and size as a parameter

Project description
heatmapz - Better heatmaps in Python
Python code and Jupyter notebook for an improved heatmap implementation using Matplotlib and Seaborn.
Similar to what you can easily get in Tableau using a Size parameter, here you can have square size as parameter depending on the field value.
Described in detail in this blog post: https://towardsdatascience.com/better-heatmaps-and-correlation-matrix-plots-in-python-41445d0f2bec
See below for installation details, reference and examples.
Example of a correlation matrix

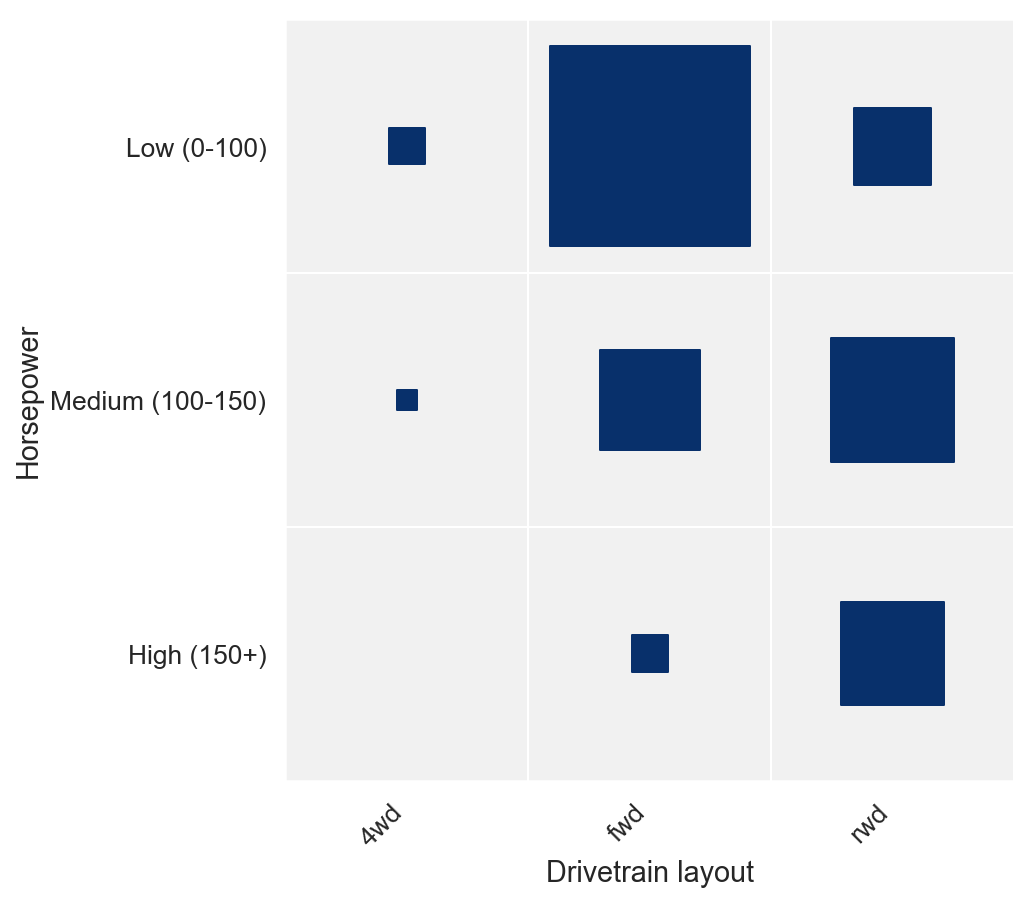
Example of a discrete joint distribution
Installation
To get the pip package run:
pip install heatmapz
Then you can use the following imports:
from heatmap import heatmap, corrplot
Reference
heatmap(x, y, **kwargs)
Parameters:
x : A list, np.array or pandas.Series containing the values for the horizontal dimension
y : A list, np.array or pandas.Series containing the values for the vertical dimension
Optional parameters:
color : A list, np.array or pandas.Series containing values based on which to apply the heatmap color. Should have the same length as x and y.
palette : A list of colors to use as the heatmap palette. The values from color are mapped onto the palette so that min(color) -> palette[0] and max(color) -> palette[len(palette)-1], and the values in between are linearly interpolated. A good way to choose or create a palette is to simply use Seaborn palettes (https://seaborn.pydata.org/tutorial/color_palettes.html).
color_range : A tuple (color_min, color_max) that enables capping the values of color being mapped to palette. All color values less than color_min are capped to color_min, and all color values larger than color_max are capped to color_max. Then those values are mapped to palette as described under color.
size : A list, np.array or pandas.Series containing values based on which to apply the size to the shapes in the plot. Should have the same length as x and y.
size_range : A tuple (size_min, size_max) that enables capping the values of size being applied to the shapes in the plot. Essentially controls min and max size of the shapes.
size_scale : Used to scale the size of the shapes in the plot to make them fit the size of the fields in the matrix. Default value is 500. You will likely need to fiddle with this parameter in order to find the right value for your figure size and the size range applied.
x_order : Should contain all distinct values of x ordered in the way you want them shown on the x-axis from left to right.
y_order : Should contain all distinct values of y ordered in the way you want them shown on the y-axis from bottom to top.
marker : Specify the shape to use in the plot. It can be any of the matplotlib marker shapes (https://matplotlib.org/api/markers_api.html). The default is 's' for square.
xlabel : Label for the x-axis. Default is none.
ylabel : Label for the y-axis. Default is none.
corrplot(data, size_scale=500, marker='s')
A shorthand function for making correlation plots from pandas dataframes.
Parameters:
data : You should pass the result of calling df.corr() on a dataframe.
size_scale : Used to scale the size of the shapes in the plot to make them fit the size of the fields in the matrix. Default value is 500. You will likely need to fiddle with this parameter in order to find the right value for your figure size and the size range applied.
marker : Specify the shape to use in the plot. It can be any of the matplotlib marker shapes (https://matplotlib.org/api/markers_api.html). The default is 's' for square.
Examples
You can find a walktrough with examples in this Colab notebook https://colab.research.google.com/drive/1YSvER-U3cwGplSHyXwaCXYhOWfWO53Iy


Download files
Download the file for your platform. If you're not sure which to choose, learn more about installing packages.
Source Distribution
Built Distribution
Filter files by name, interpreter, ABI, and platform.
If you're not sure about the file name format, learn more about wheel file names.
Copy a direct link to the current filters
File details
Details for the file heatmapz-0.0.4.tar.gz.
File metadata
- Download URL: heatmapz-0.0.4.tar.gz
- Upload date:
- Size: 4.5 kB
- Tags: Source
- Uploaded using Trusted Publishing? No
- Uploaded via: twine/3.1.1 pkginfo/1.5.0.1 requests/2.22.0 setuptools/46.1.3 requests-toolbelt/0.9.1 tqdm/4.36.1 CPython/3.7.4
File hashes
| Algorithm | Hash digest | |
|---|---|---|
| SHA256 |
747928c532b8865320b26a0dfbe7e188cc6618c9452ba84c08609fed4eb09605
|
|
| MD5 |
19d4c77af00913040d40f19a10da6dfd
|
|
| BLAKE2b-256 |
4a07736df758be785db1f6f809945b96a1103af8d25b24419c4bd64f68ae3c60
|
File details
Details for the file heatmapz-0.0.4-py3-none-any.whl.
File metadata
- Download URL: heatmapz-0.0.4-py3-none-any.whl
- Upload date:
- Size: 5.8 kB
- Tags: Python 3
- Uploaded using Trusted Publishing? No
- Uploaded via: twine/3.1.1 pkginfo/1.5.0.1 requests/2.22.0 setuptools/46.1.3 requests-toolbelt/0.9.1 tqdm/4.36.1 CPython/3.7.4
File hashes
| Algorithm | Hash digest | |
|---|---|---|
| SHA256 |
c13cda02feb8bba74709f63fbf6e606fb2f34ef12dcb1c2cee14355e56b0f666
|
|
| MD5 |
46dc99e98e5577e90acd80696daacfdf
|
|
| BLAKE2b-256 |
265d3928028fcb8de3bf09bb17975ca7e83f8b2f00cd28c10bc1150f8c418372
|


