Create heatmaps with shapes and size as a parameter
Project description
heatmap
Better heatmaps in Python
Python code and Jupyter notebook for an improved heatmap implementation using Matplotlib and Seaborn.
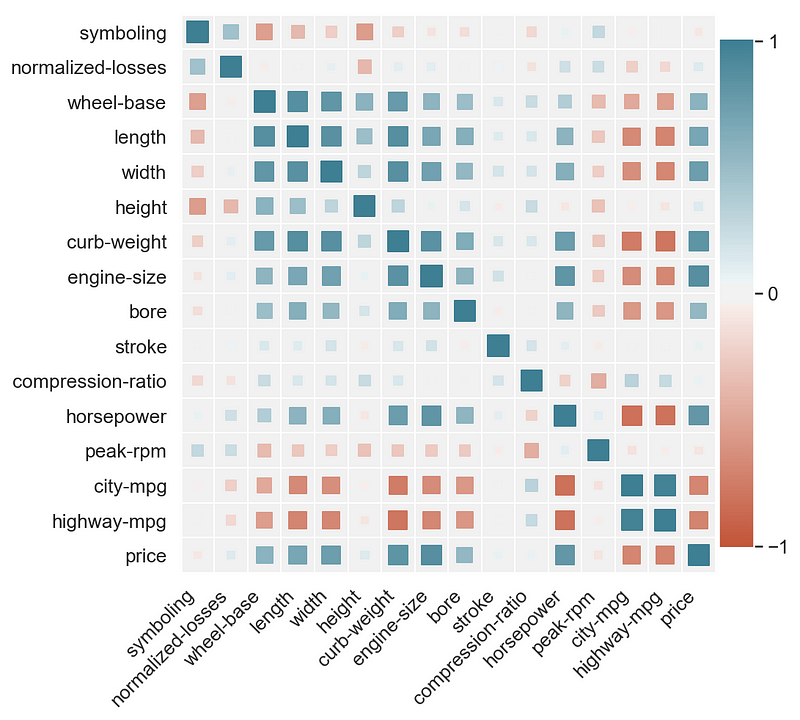
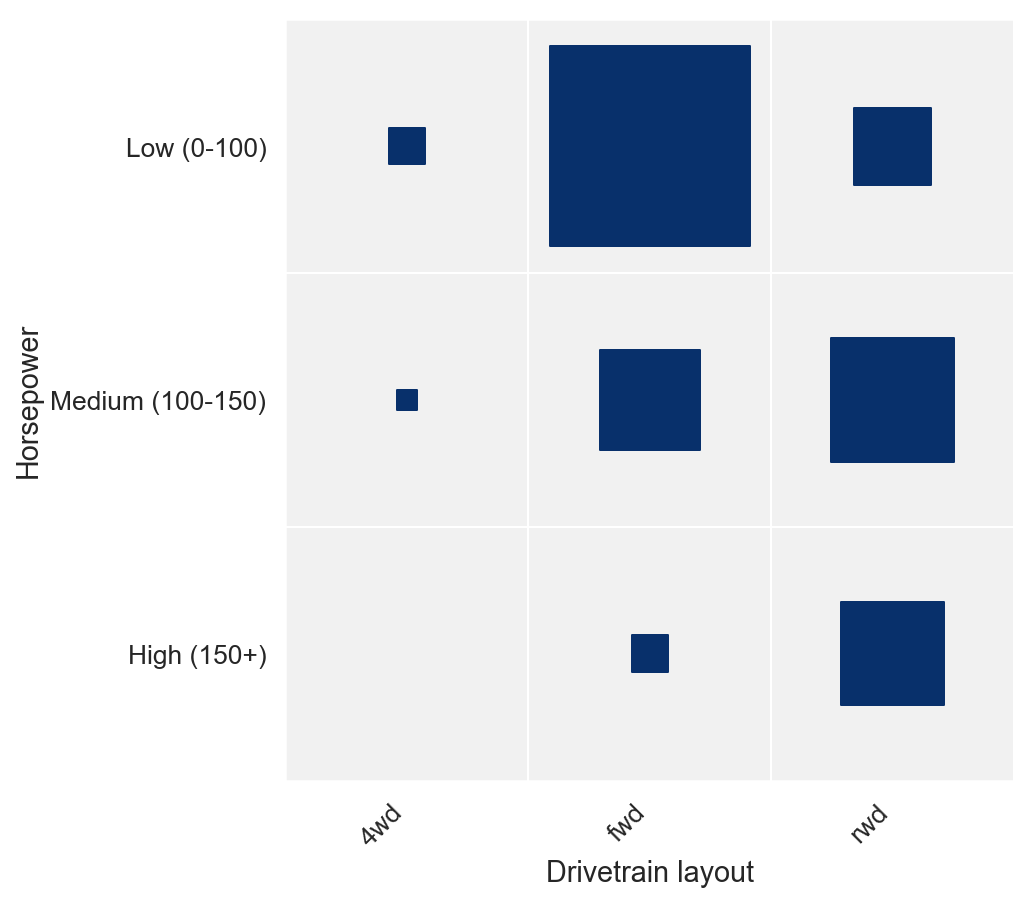
Similar to what you can easily get in Tableau using a Size parameter, here you can have square size as parameter depending on the field value.
Described in detail in this blog post: https://towardsdatascience.com/better-heatmaps-and-correlation-matrix-plots-in-python-41445d0f2bec
Example of a correlation matrix
Example of a discrete joint distribution
Project details
Download files
Download the file for your platform. If you're not sure which to choose, learn more about installing packages.
Source Distribution
heatmapz-0.0.2.tar.gz
(3.3 kB
view hashes)


