Interactive curses-based port and process viewer (using witr)

Project description
      ██╗  ██╗███████╗██╗███╗   ███╗██████╗  █████╗ ██╗     ██╗
      ██║  ██║██╔════╝██║████╗ ████║██╔══██╗██╔══██╗██║     ██║
      ███████║█████╗  ██║██╔████╔██║██║  ██║███████║██║     ██║
      ██╔══██║██╔══╝  ██║██║╚██╔╝██║██║  ██║██╔══██║██║     ██║
      ██║  ██║███████╗██║██║ ╚═╝ ██║██████╔╝██║  ██║███████╗███████╗
      ╚═╝  ╚═╝╚══════╝╚═╝╚═╝     ╚═╝╚═════╝ ╚═╝  ╚═╝╚══════╝╚══════╝
Interactive terminal-based port, process, file, and resource inspector for Linux
heimdall is a high-performance, curses-based Terminal User Interface (TUI) designed to give you instant visibility and control over your Linux system — all from a single, interactive view.
✨ Features
- 🔍 Live port listing using
ss - ⚡ Shows CPU% / MEM% usage per process
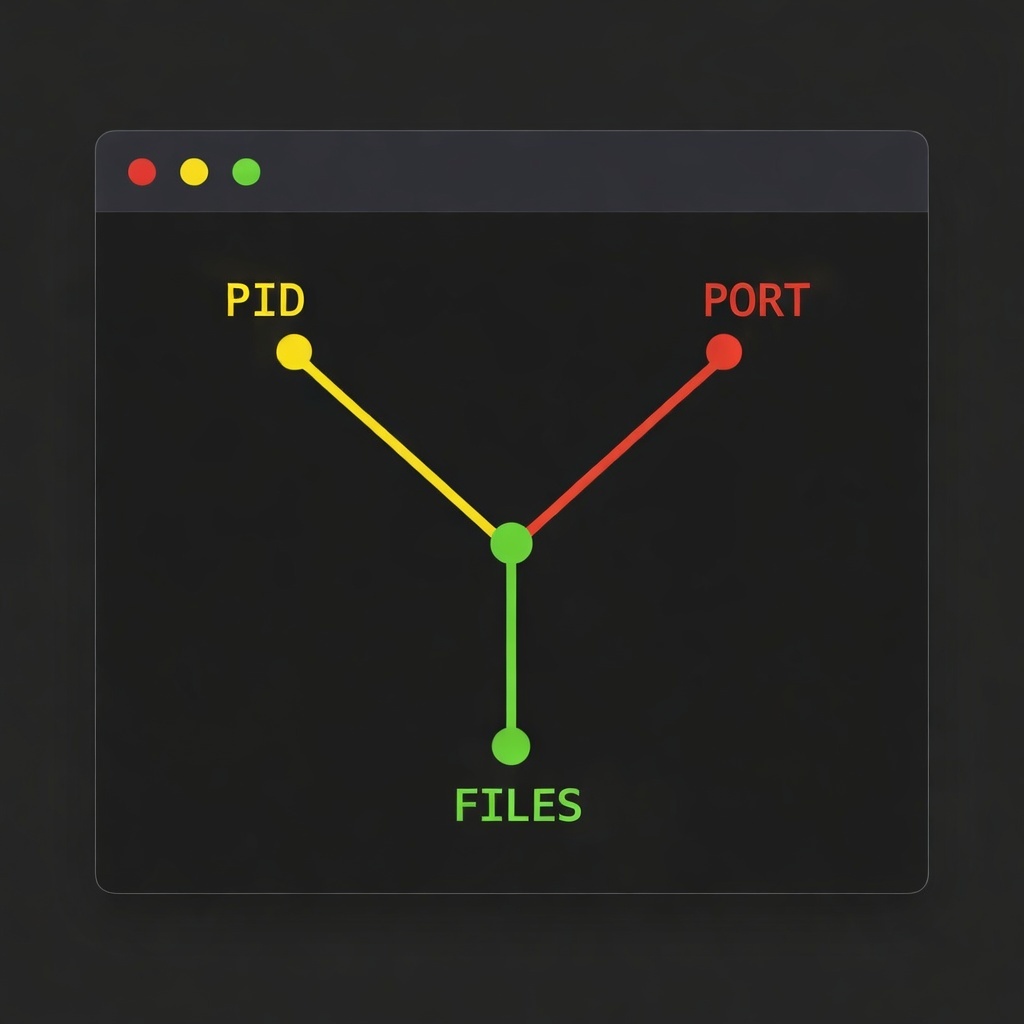
- 🧠 Maps PORT → PID → PROGRAM
- ⛔ Firewall toggle for selected port (temporarily block/unblock traffic)
- 📂 Displays all open files of the selected process (
/proc/<pid>/fd) - 🧾 Deep inspection via
witr --port - 🖥️ Fully interactive terminal UI (curses)
- ⚡ Real-time refresh
- 🛑 Stop a process or systemd service directly from the UI (with confirmation)
- 📝 Warnings annotation (e.g., suspicious working directory is flagged but explained)
- 🛠️ Action Center (Modal) — quick operational panel for ports & processes (see below)
- 💥 Kill Connections operation: list and kill established connections for a port.
- 🚫 Block IP operation: block a source IP for a port via iptables.
- 🔍 Deep Inspect / Info (i): Real-time ancestry tracking, resource pressure, and security audit.
- 🎬 Service Activity History: Extract historical logins, IP events, and session logs from system journals.
- 📡 Live Auto-Scan: Periodic background refresh of the port list (adjustable speed).
- 📸 Full System Dump (d): Comprehensive text report of all active services, including logs, process trees, and resource limits.
- 📦 Local Package Intelligence: Automatic fallback to local package managers (dpkg/rpm) for rich service details when other sources fail.
- 🛡️ Heimdall Sentinel (Security Audit):
- 🚩 Risk Level: Flags known high-risk services (e.g., FTP, Telnet) based on a built-in vulnerability database.
- ☢️ Behavioral Analysis: Real-time alerts for Backdoors, Masquerading, Script Listeners, and other anomalies.
- 🔄 Auto Service Updates: Background synchronization of
services.jsonfrom GitHub. - ⚙️ Settings Console (p): Configuration modal for updates and system preferences.
- 🔍 Interactive System Filter (F): Real-time filtering by Port, PID, or User directly from the TUI.
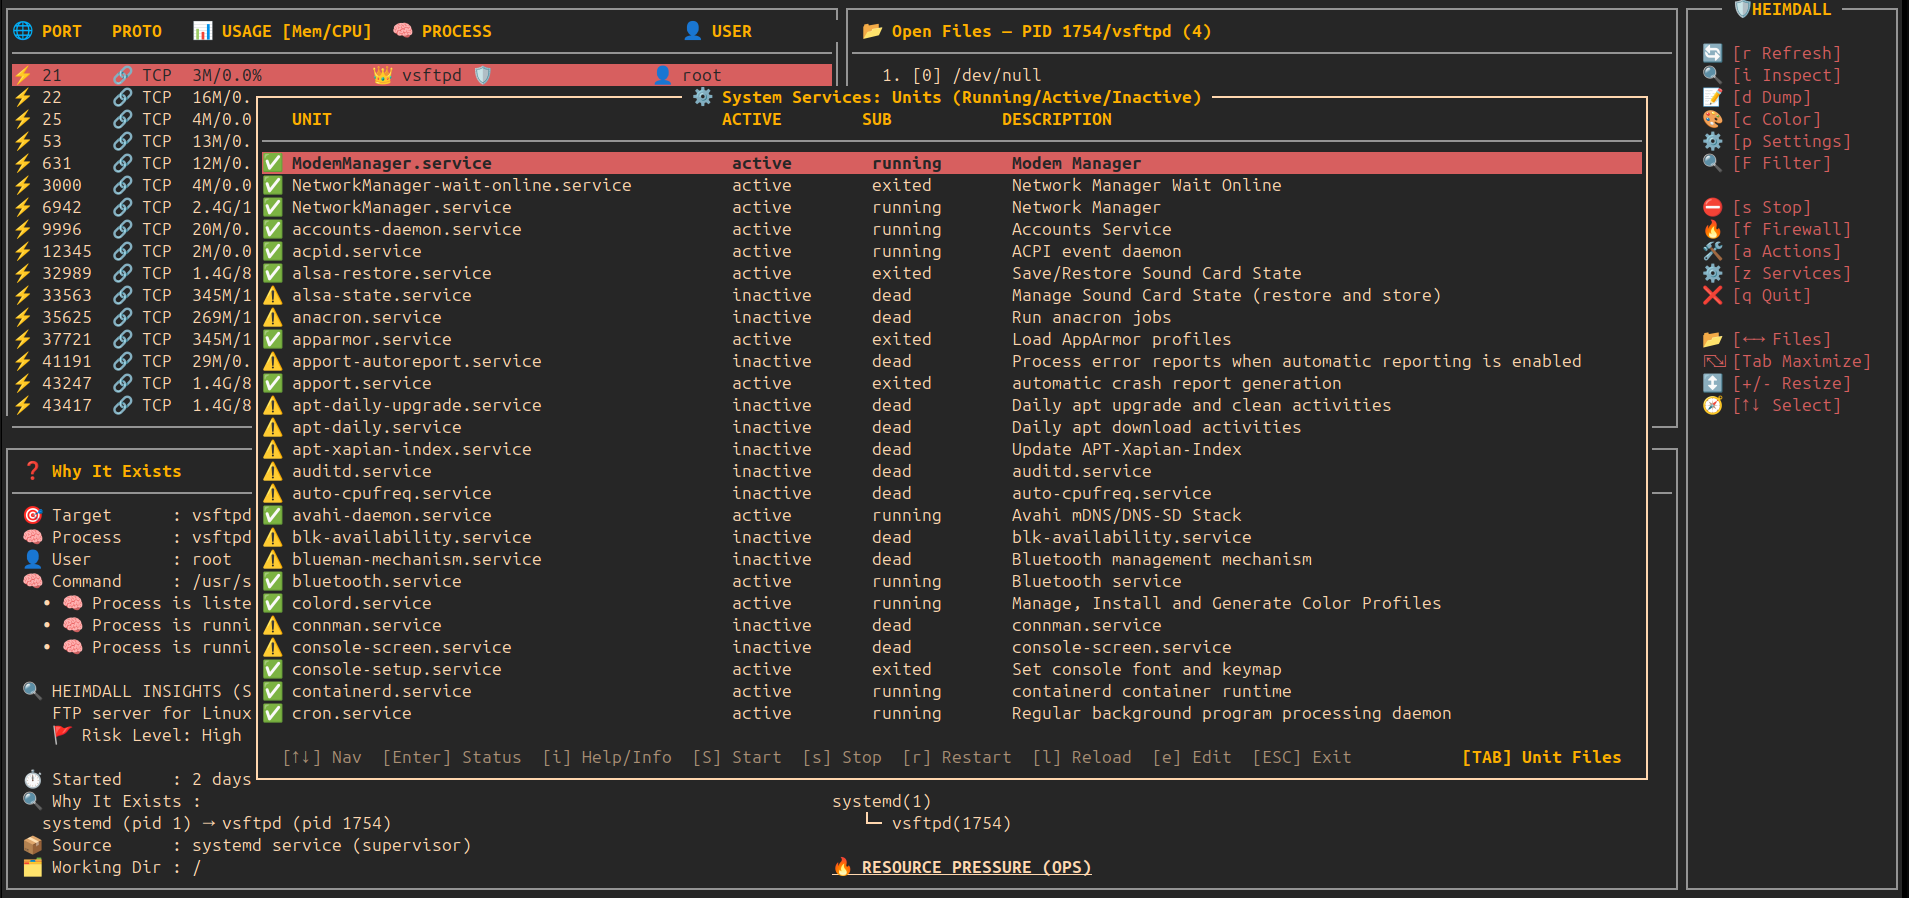
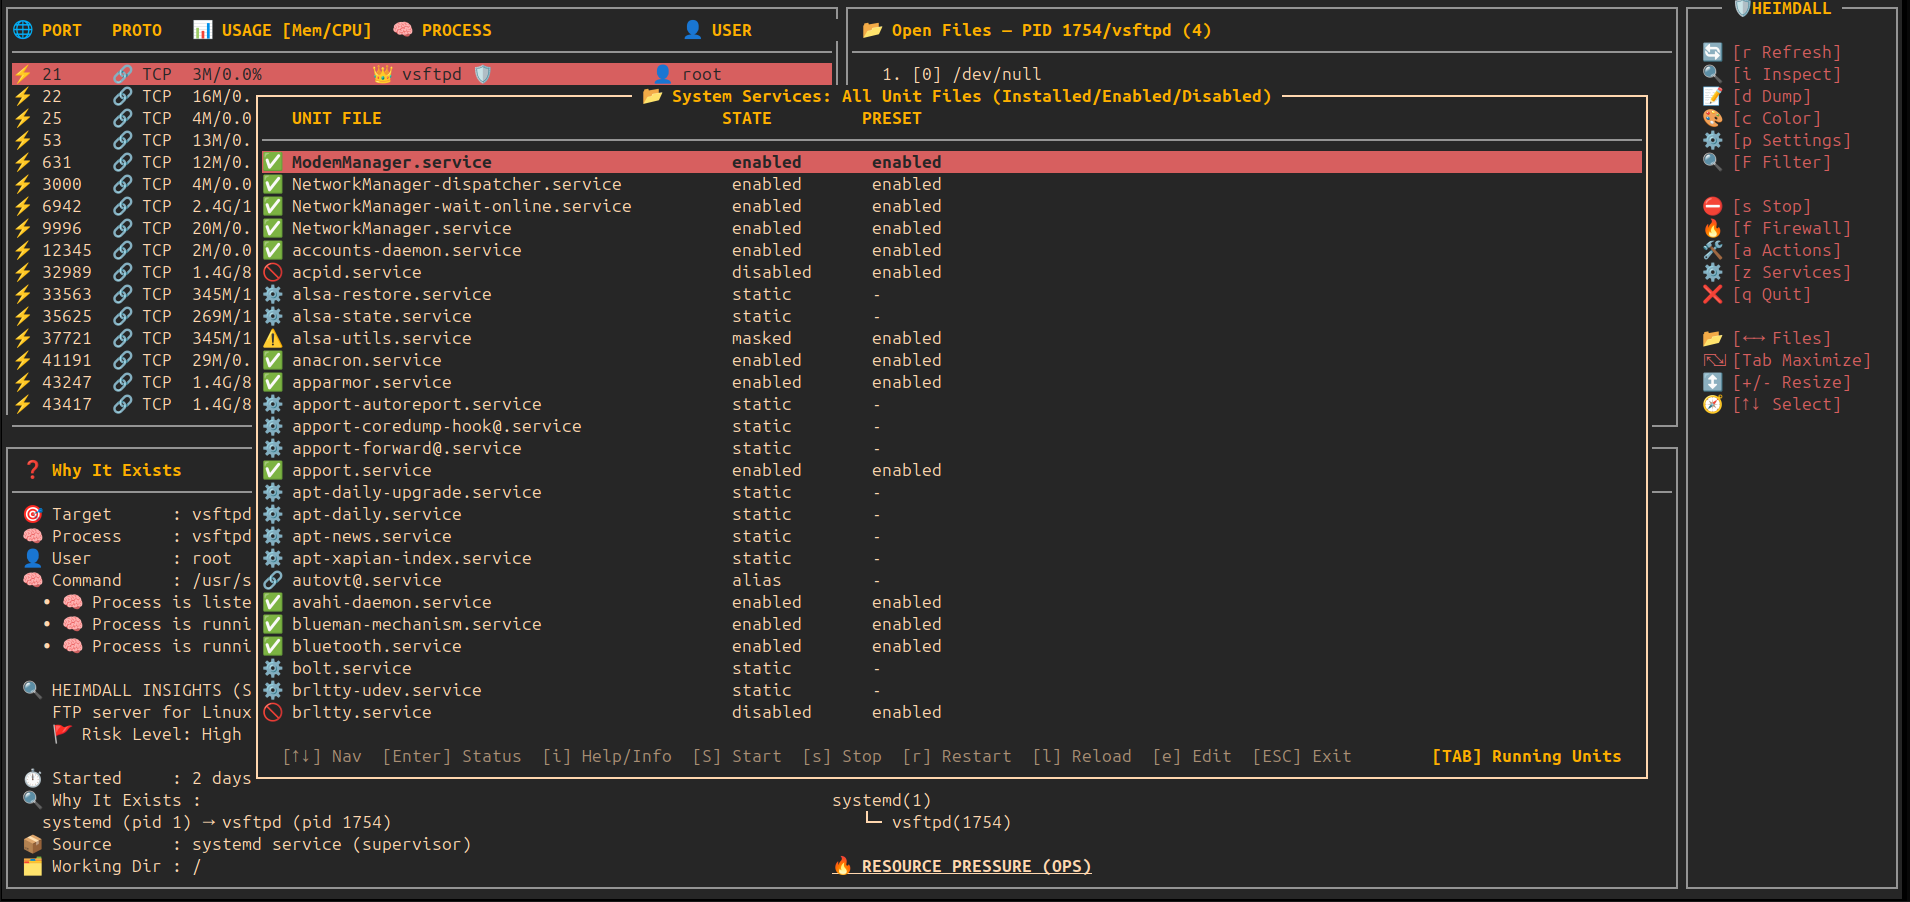
- ⚙️ System Services Manager (z): Integrated systemd service management.
- 🔄 Units vs Files (TAB): Toggle between active/running units and all installed unit files on disk.
- 🛠️ Full Actions: Start, stop, restart, reload, and edit unit files directly.
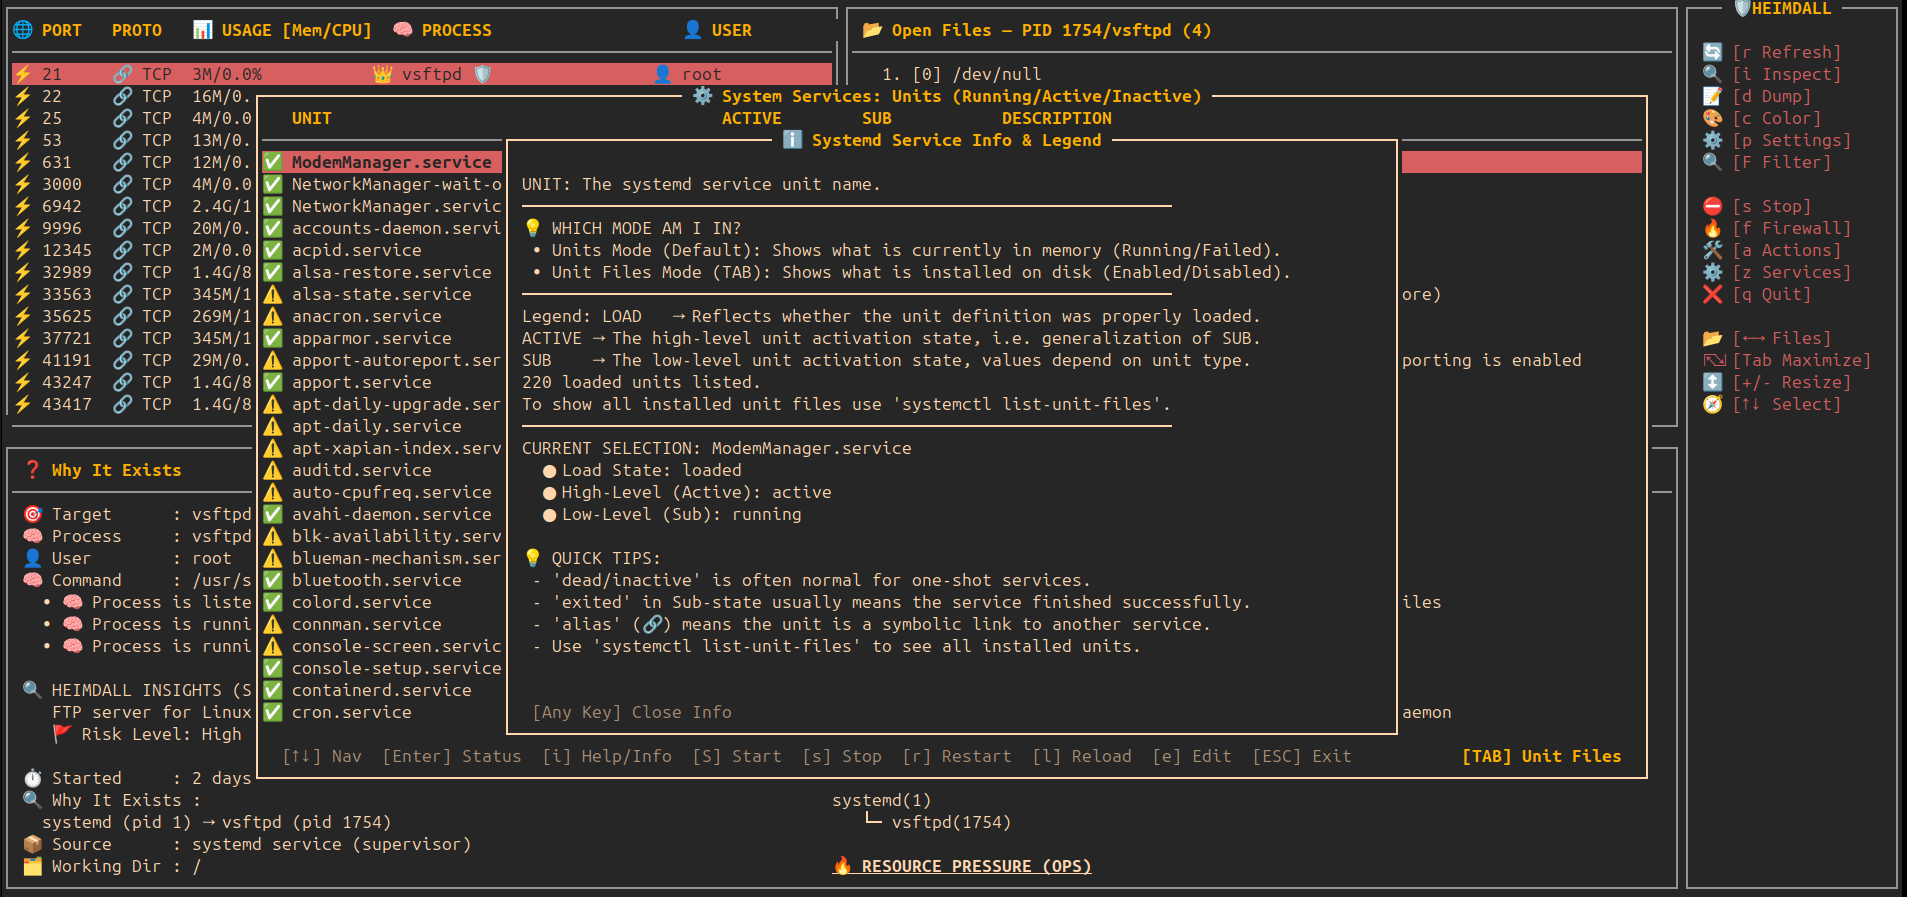
- ℹ️ Intelligence (i): Explain systemd terminology and clarify
alias/staticstates.
- 🌳 Precision Kill Tree: Nuclear termination for script loops that protects your terminal.
- 🛡️ Daemon Mode (Background): Non-interactive monitoring with automatic suspicious-outbound detection and mitigation.
- ⚖️ Process Priority (Renice): Detailed modal to change CPU priority with real-time feedback.
- ☠️ OOM Score Adjustment: Control which processes Linux sacrifices during RAM shortage.
- ⏸️ Tree-Aware Pause/Continue: Freezes both the process and its script loop parent.
- 🐞 Internal Debug Logging: Trace complex process behaviors in
~/.config/heimdall/debug.log. - 🧩 Modal UX: monospace, standard curses box(), 2-space padding, reverse+bold highlights.
It enables you to seamlessly navigate the full relationship between:
Open ports → owning processes → CPU & memory usage → firewall rules → files in use
This eliminates the need to jump between multiple tools such as ss, netstat, lsof, top, or firewall utilities.
Core Navigation
heimdall
├─ 🌐 Ports              View all open ports and their states
├─ ⚡ Usage (CPU/Mem)    Real-time resource consumption per process
├─ 🧠 Processes          Process inspection and ownership mapping
├─ ⛔ Firewall Toggle    Enable/disable firewall rules interactively
└─ 📂 Open Files         Files and sockets used by each process
🧠 What Makes It Special?
Unlike classic tools that show only one layer (ss, netstat, lsof),
heimdall connects everything together:
🔌 Port → ⚡ CPU/MEM Usage → 🧠 Process / Service → ⛔ Firewall Control → 📂 All open files
📸 Screenshots
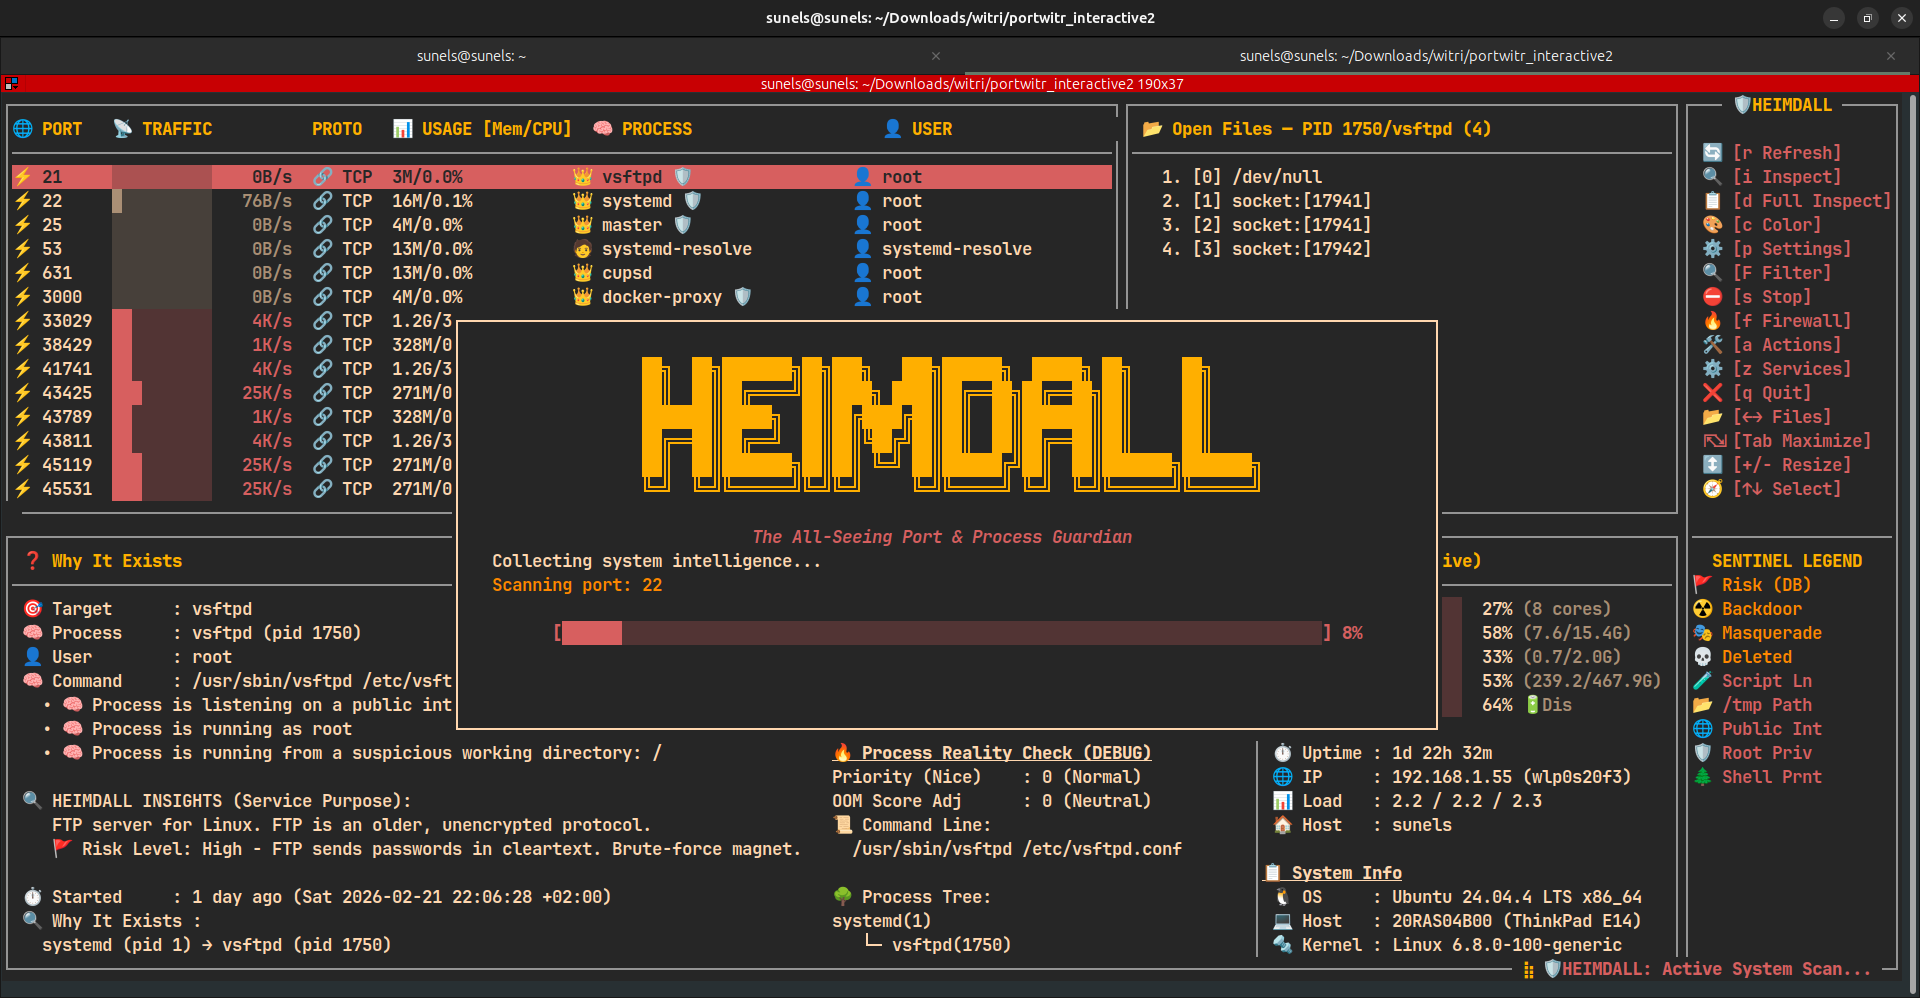
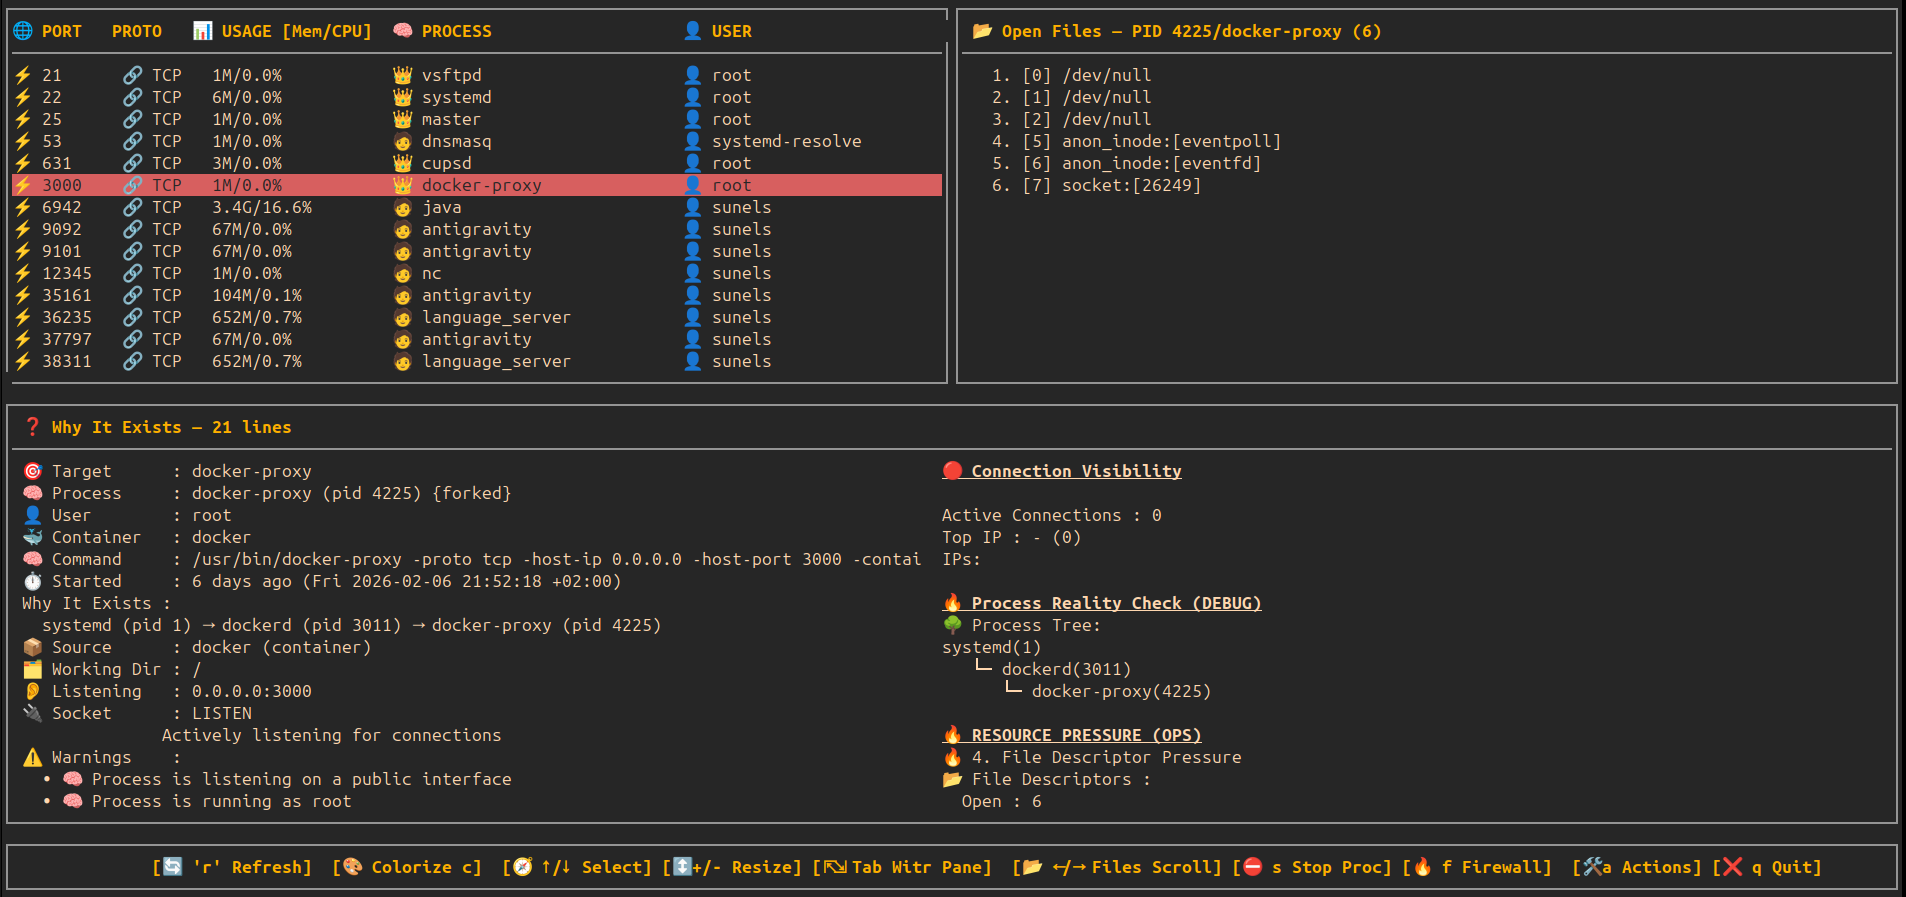
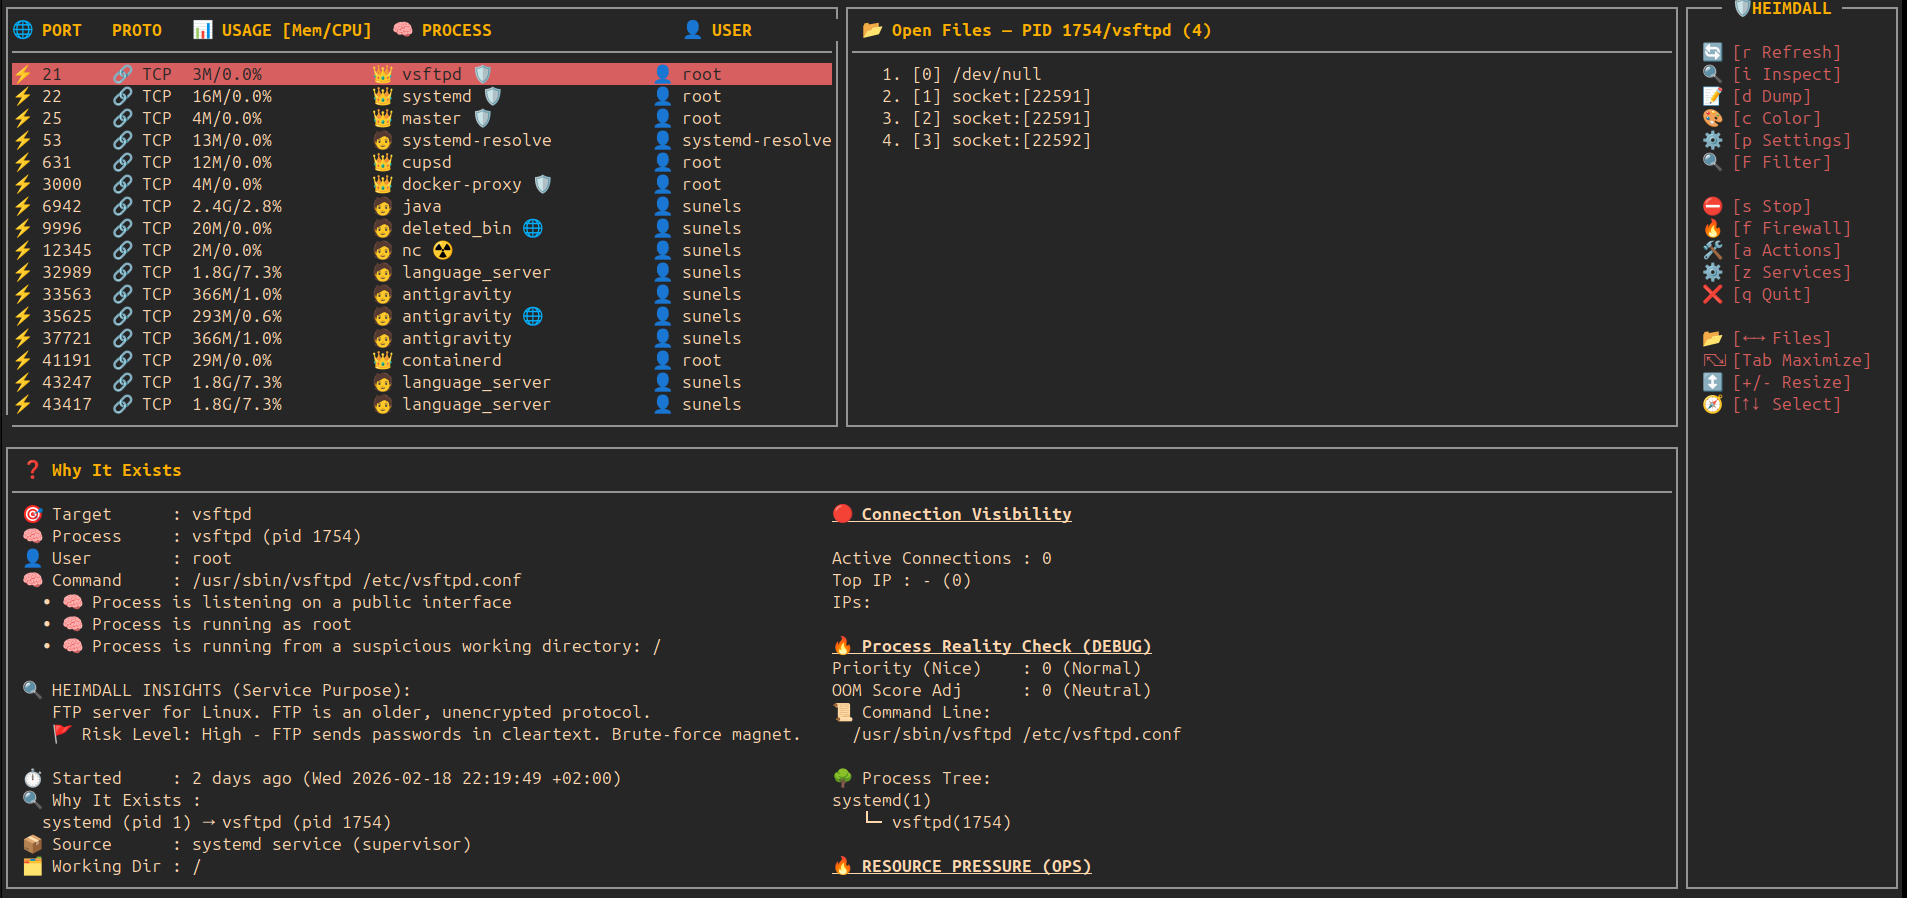
🔍 Main View — Ports, Processes & Open Files
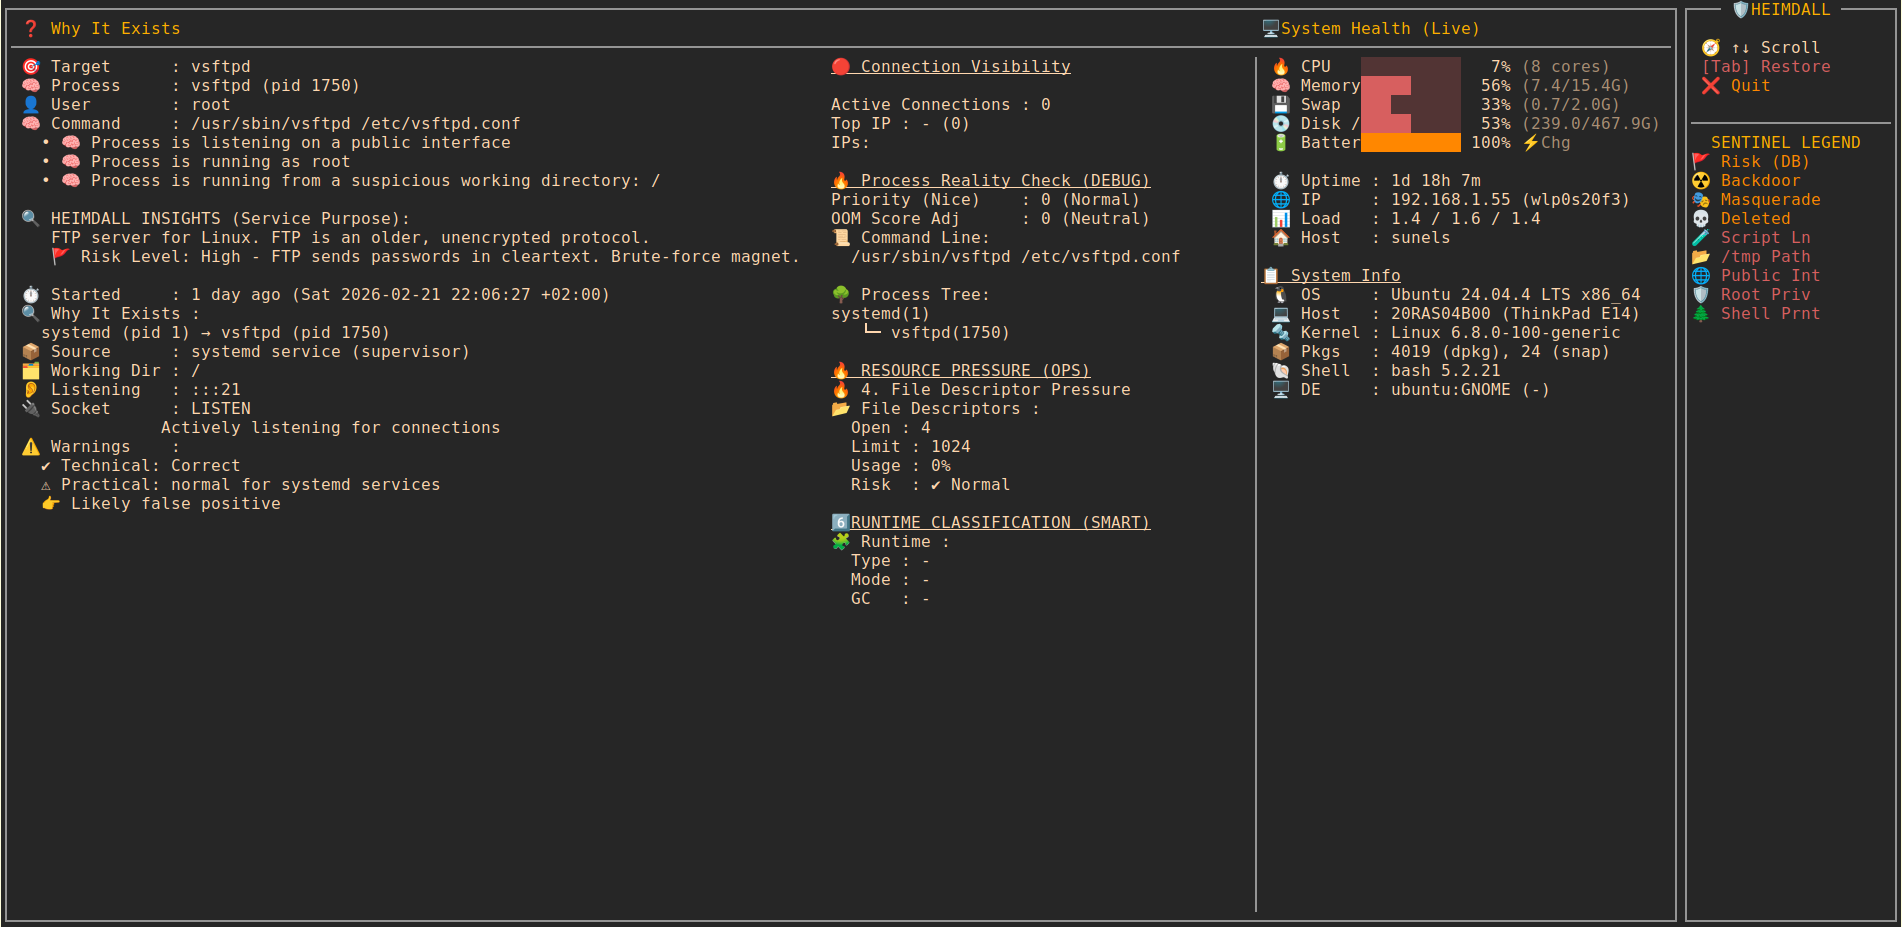
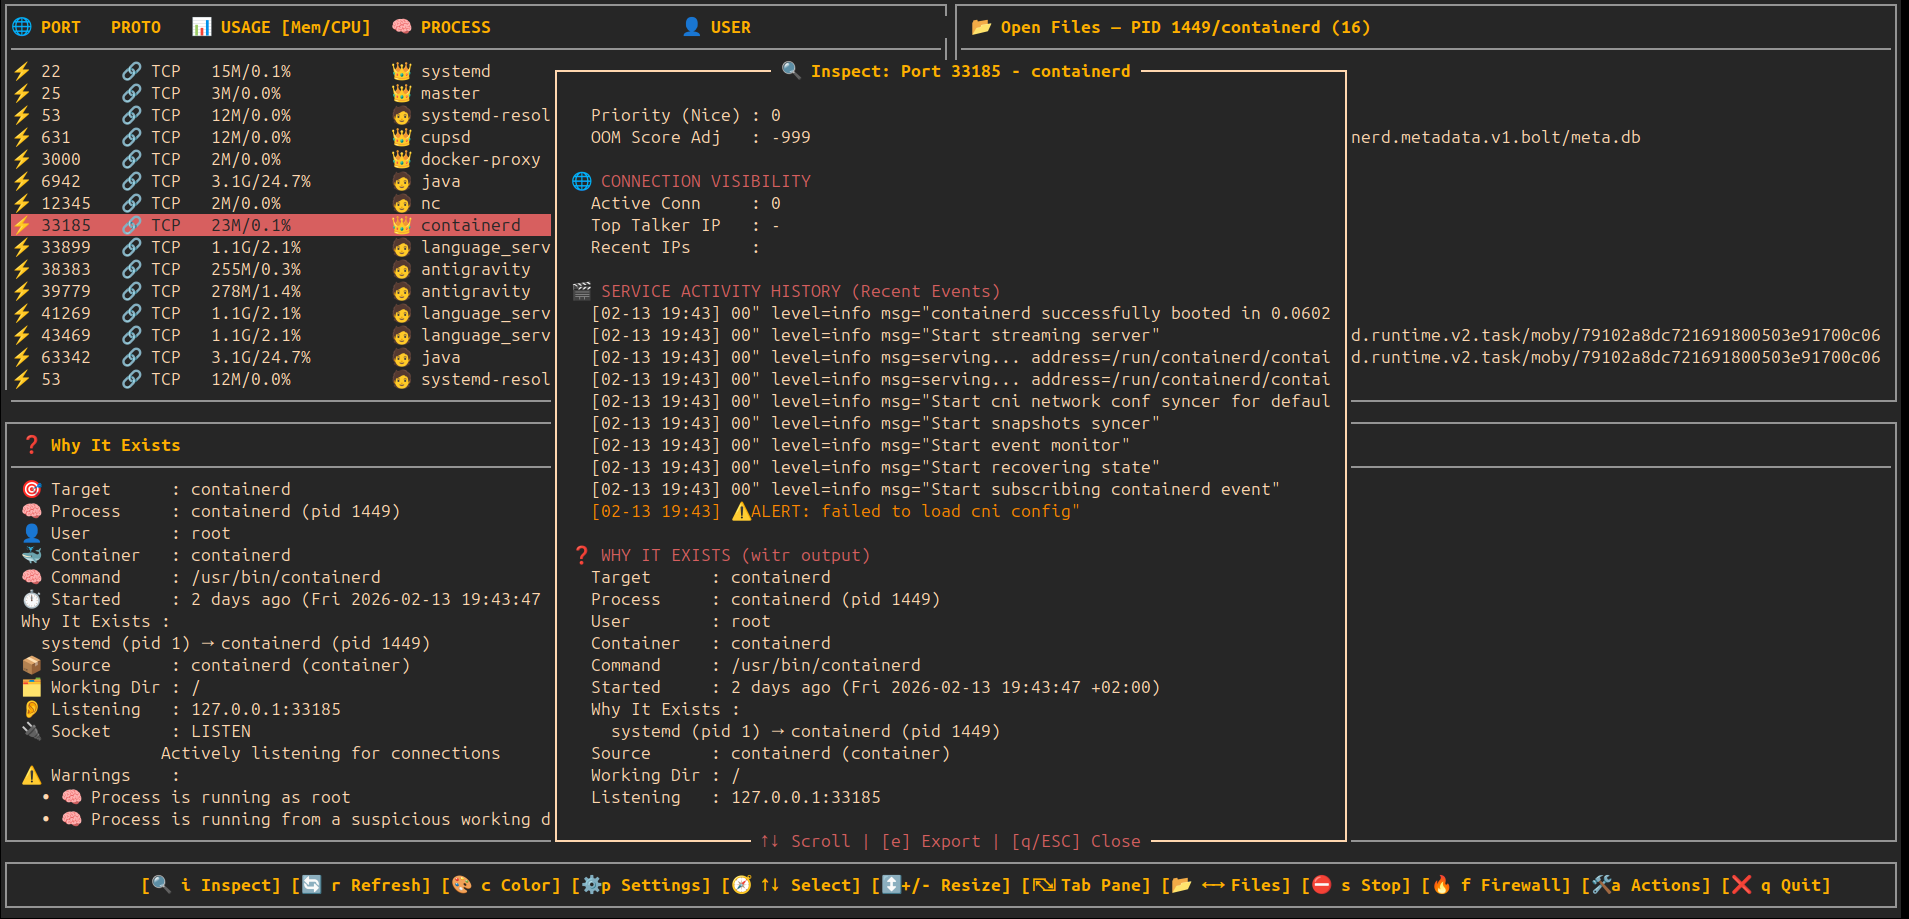
🧾 Detail View — Deep Port & Process Inspection
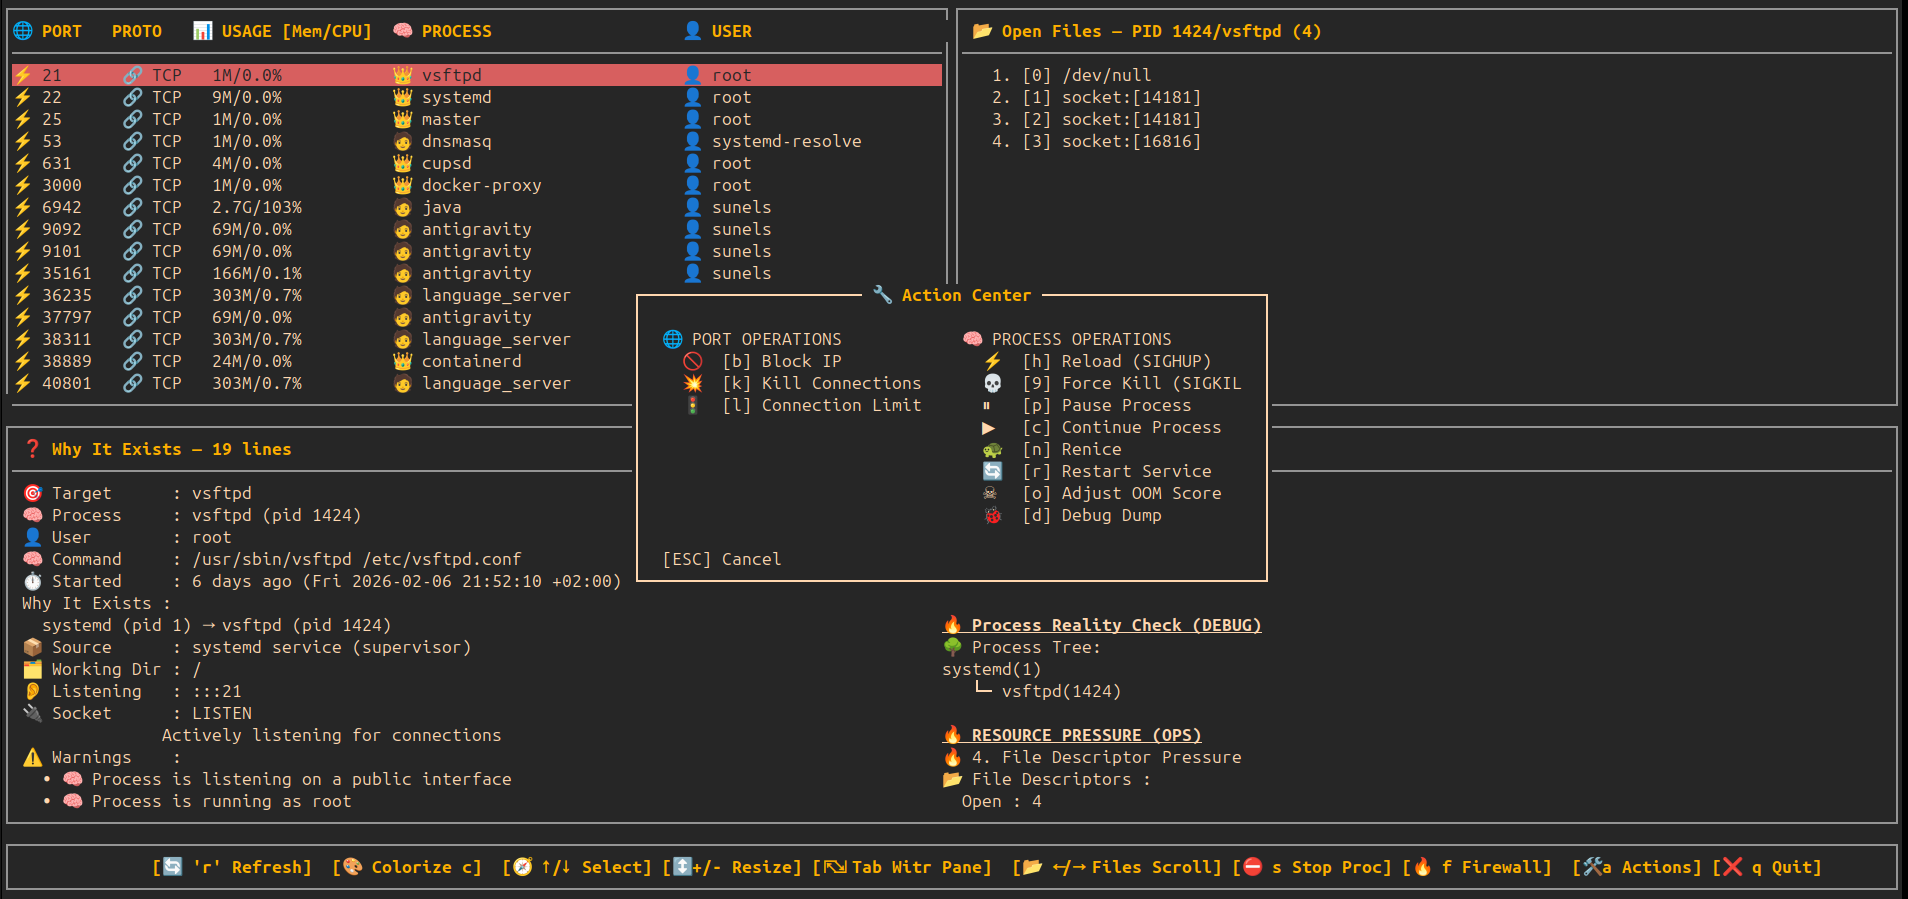
🧾 Detail View — Actions Center (Modal)
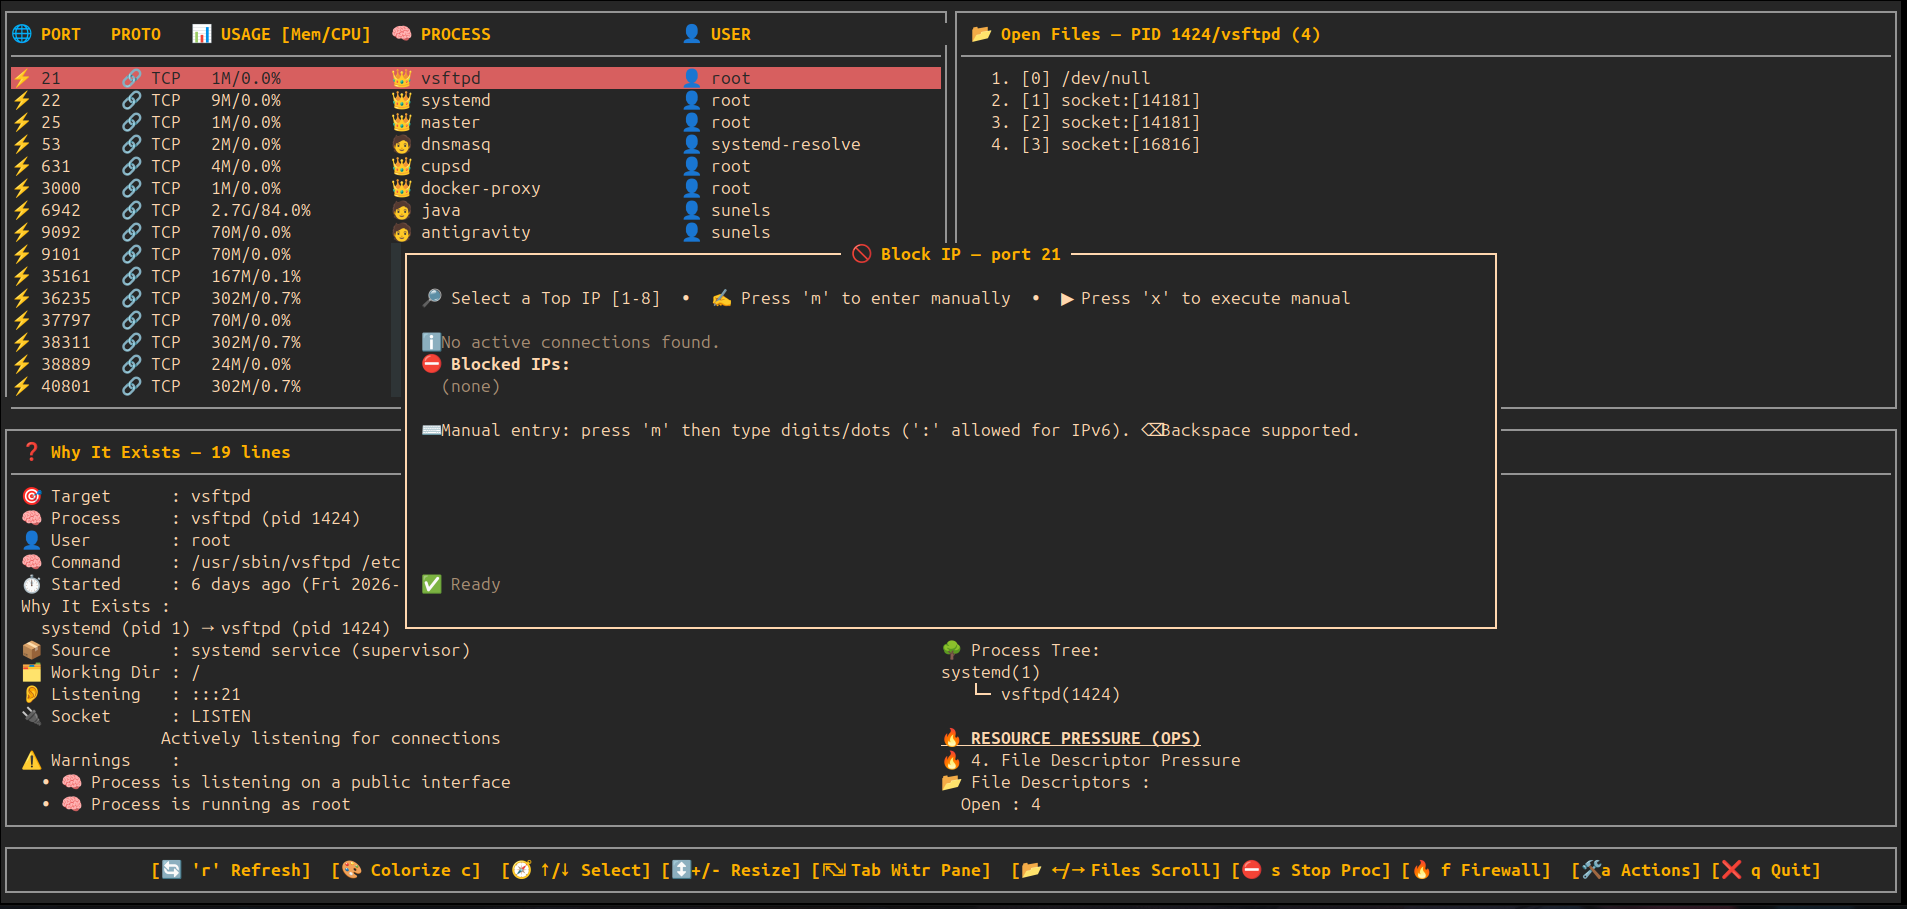
🧾 Detail View — Block IP Modal
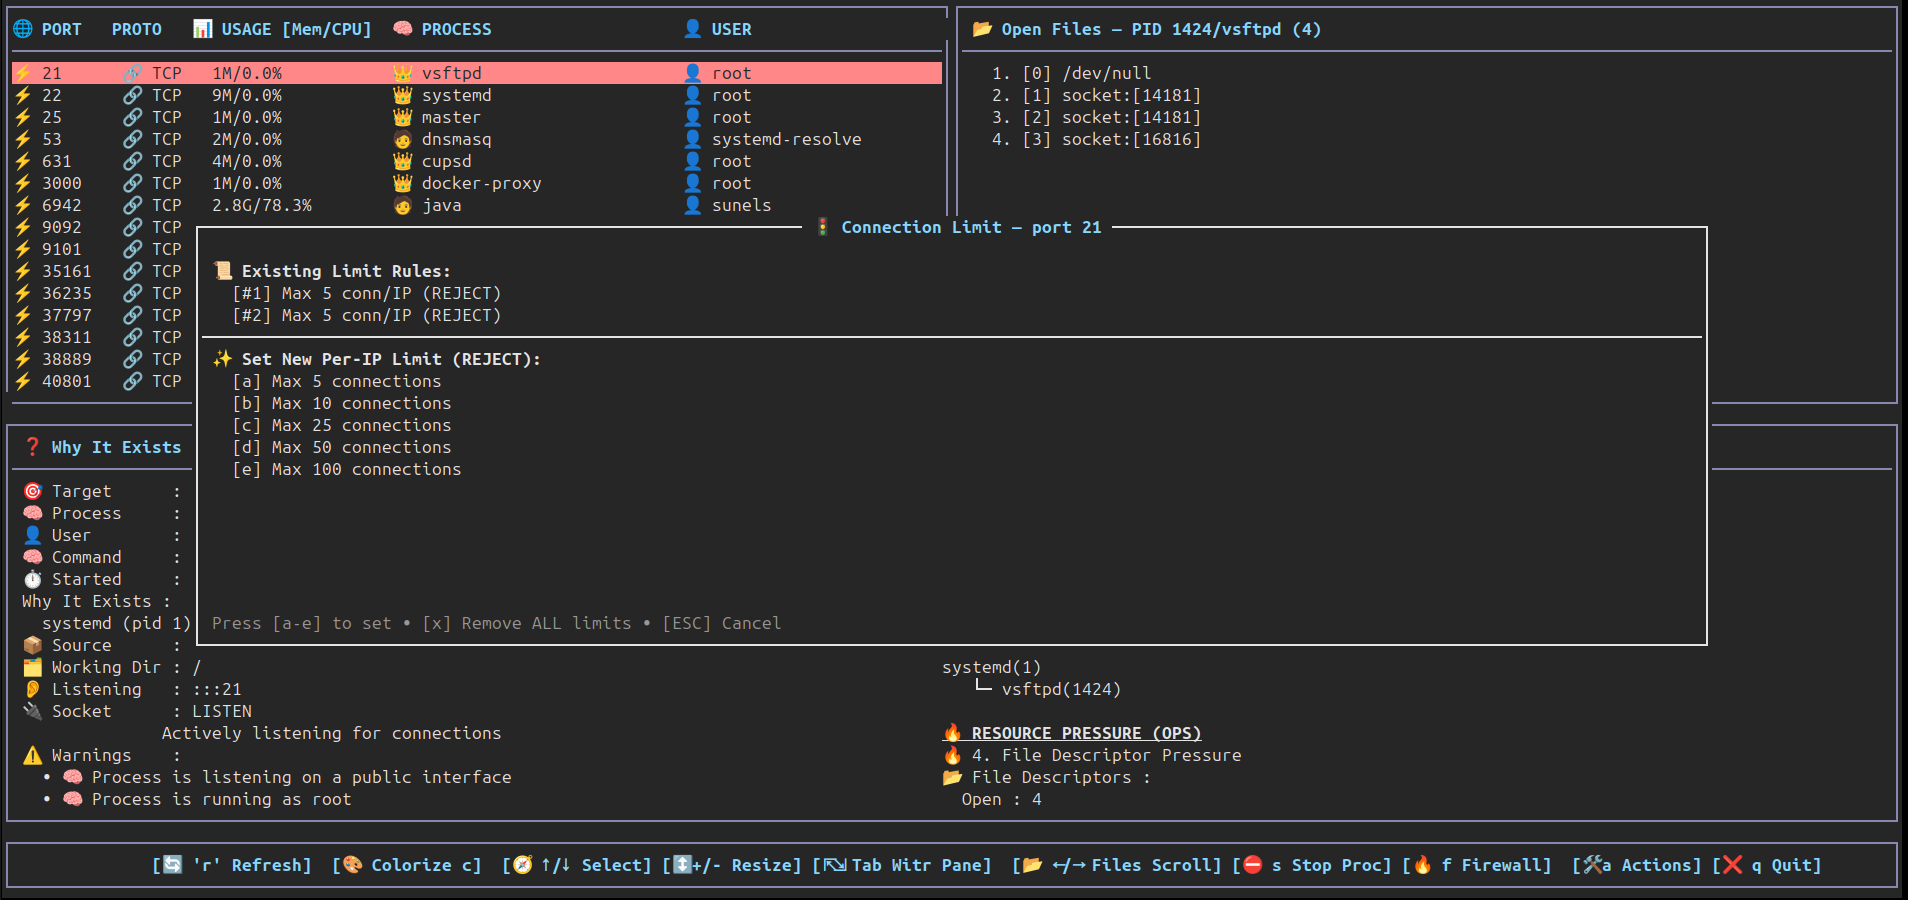
🧾 Detail View — Connection Limit Modal
🧾 Color Palette — Happy eyes edition
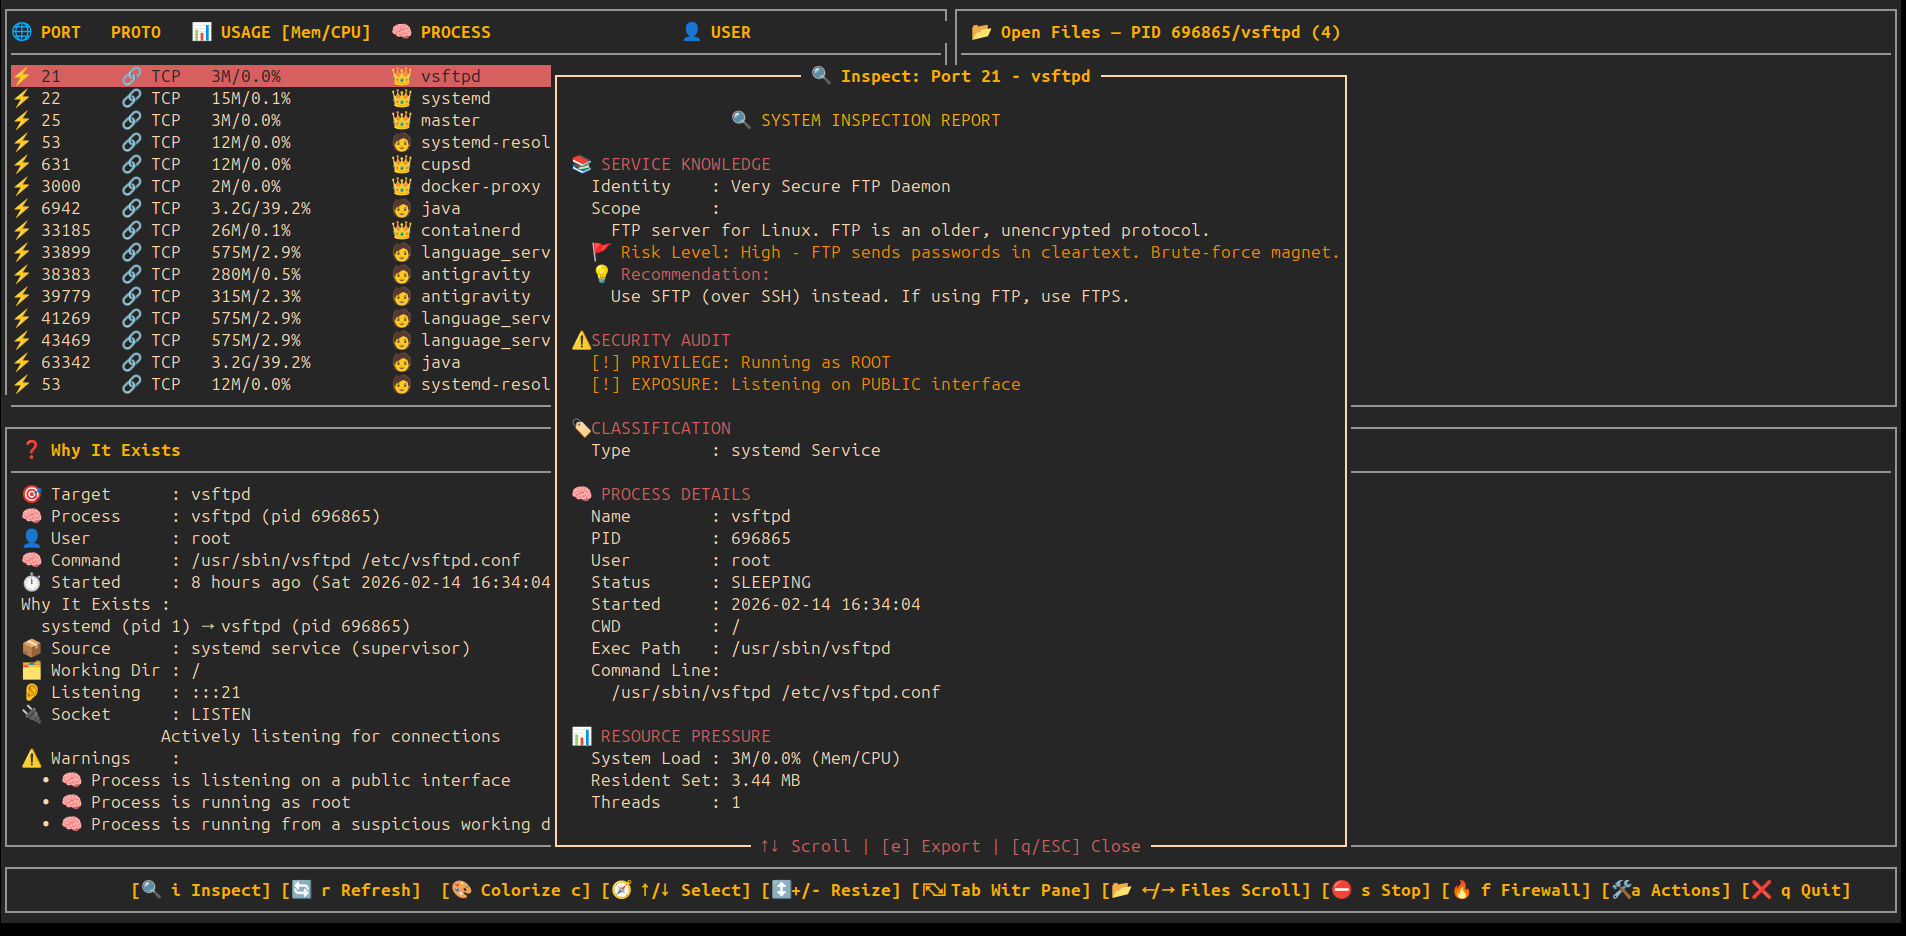
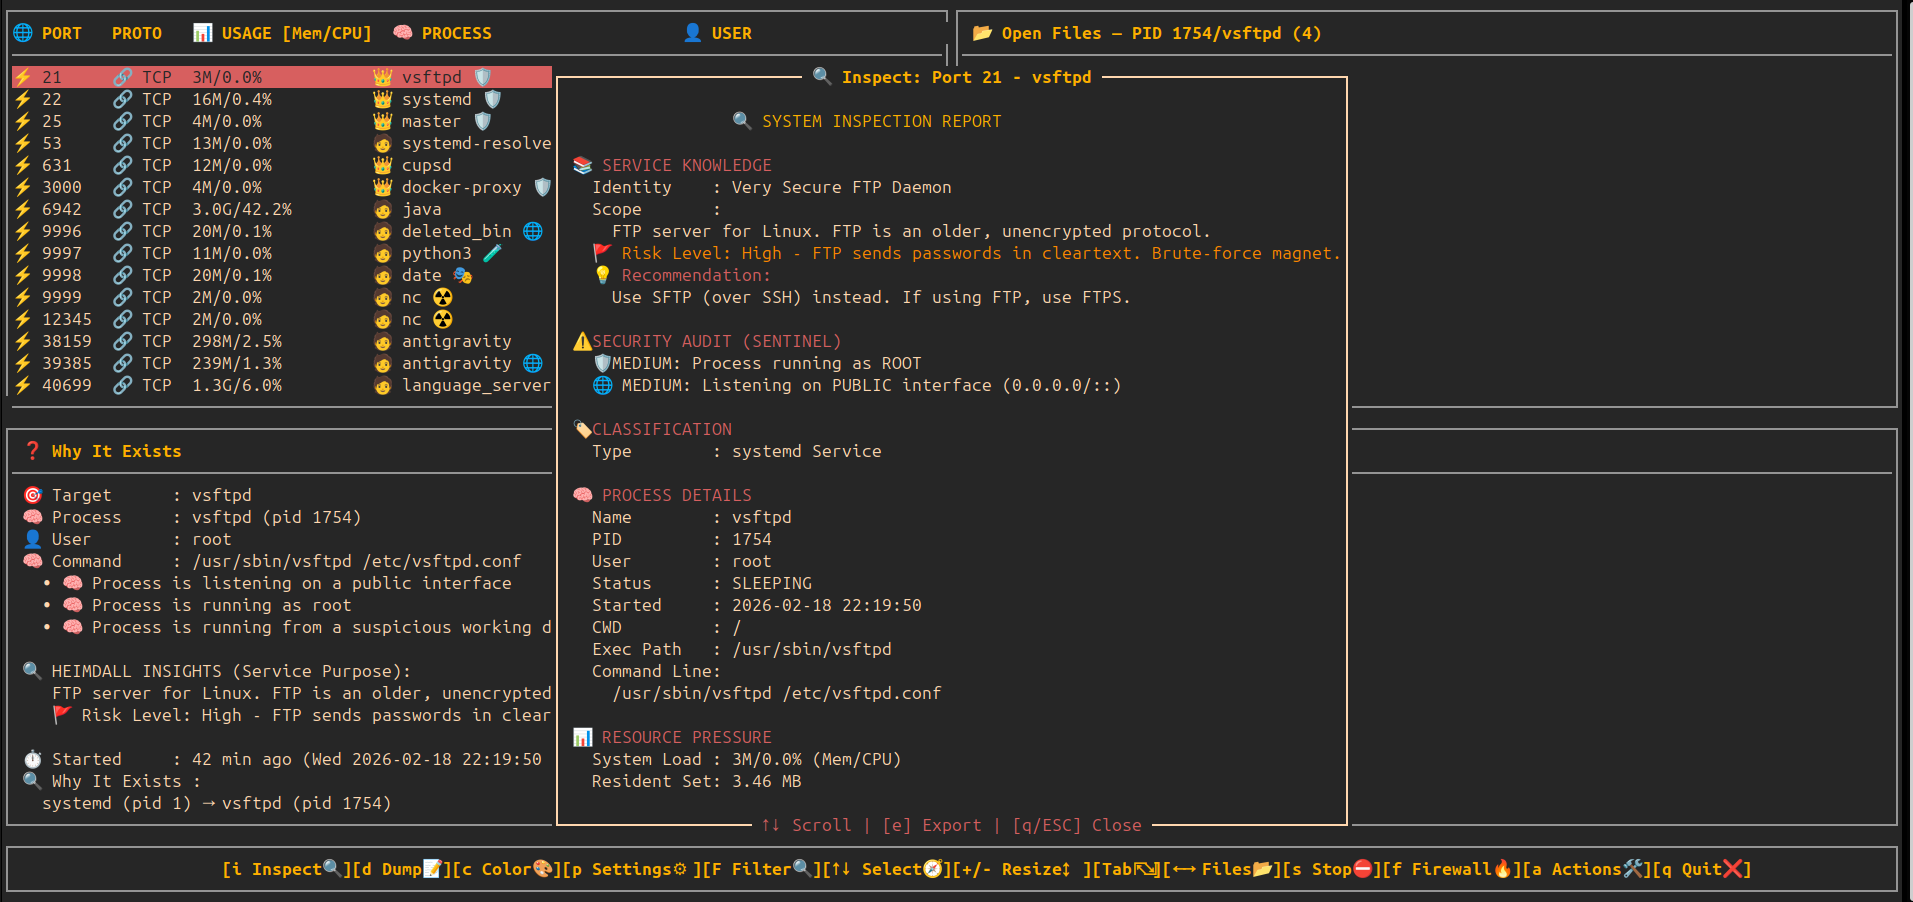
🔍 Deep Inspection — Static Service Analysis & Risk Audit
🔍 Deep Activity History — Historical Log Intelligence
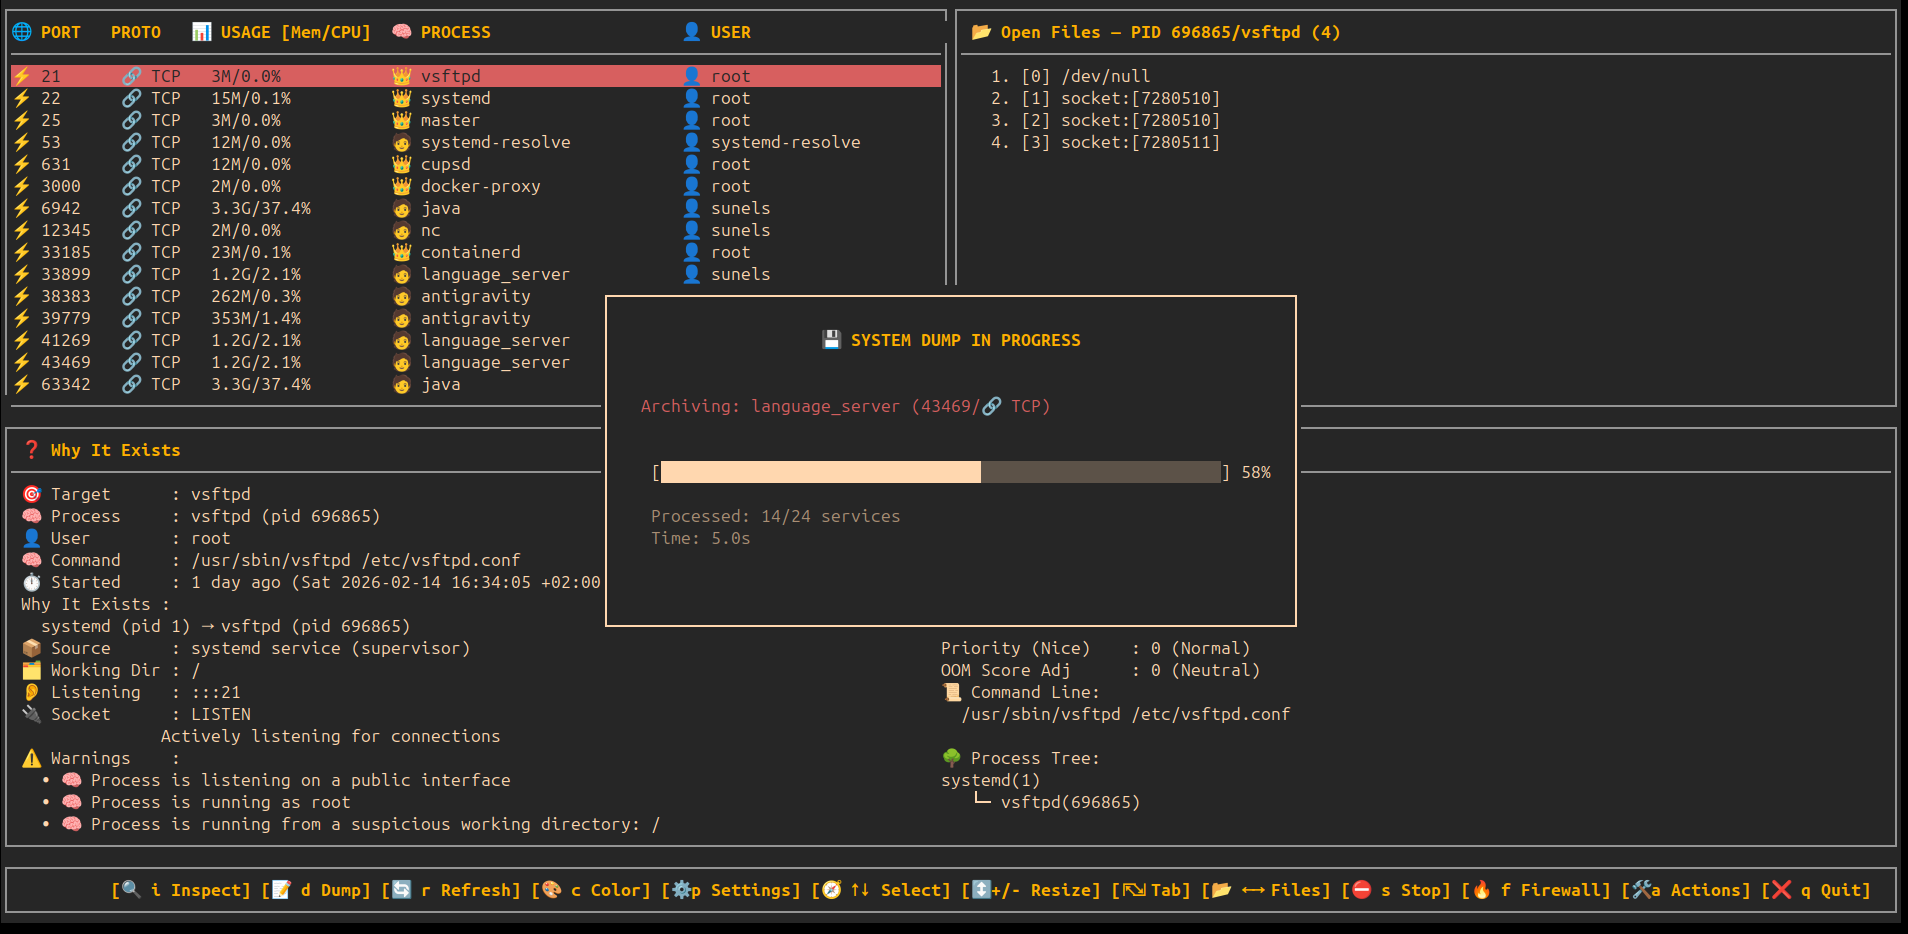
💾 Full System Dump — Visual Progress & Archive
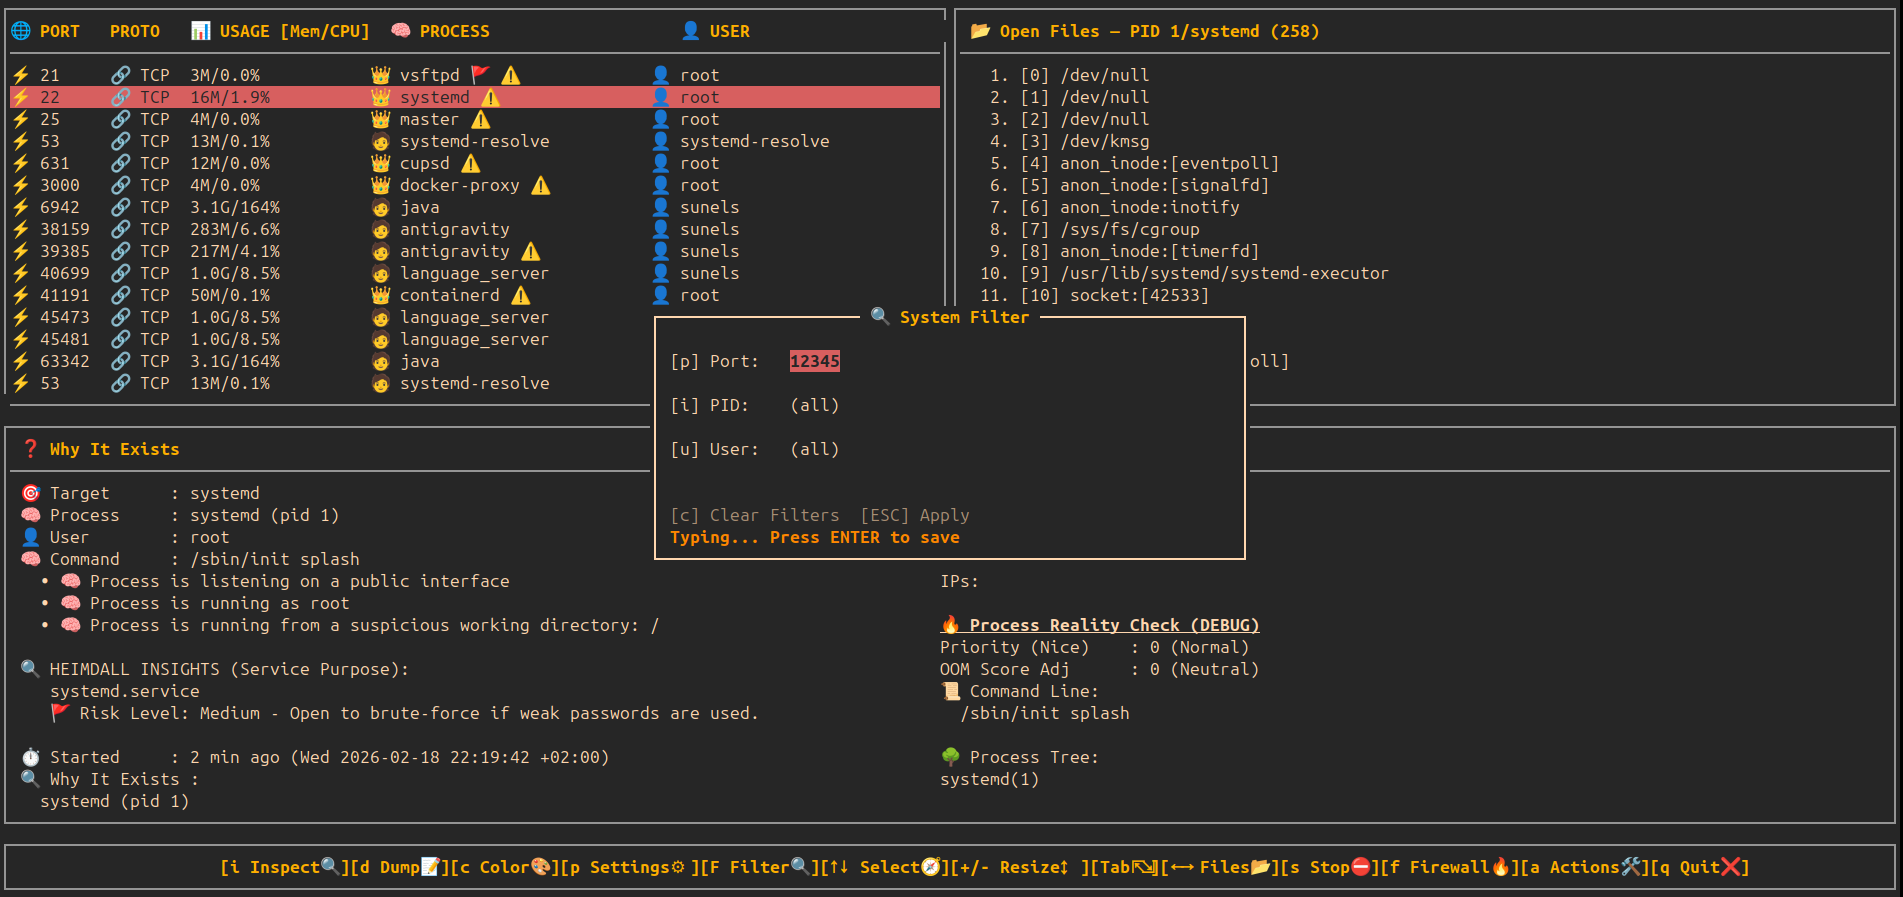
🔍 Interactive System Filter — Real-time TUI Filtering
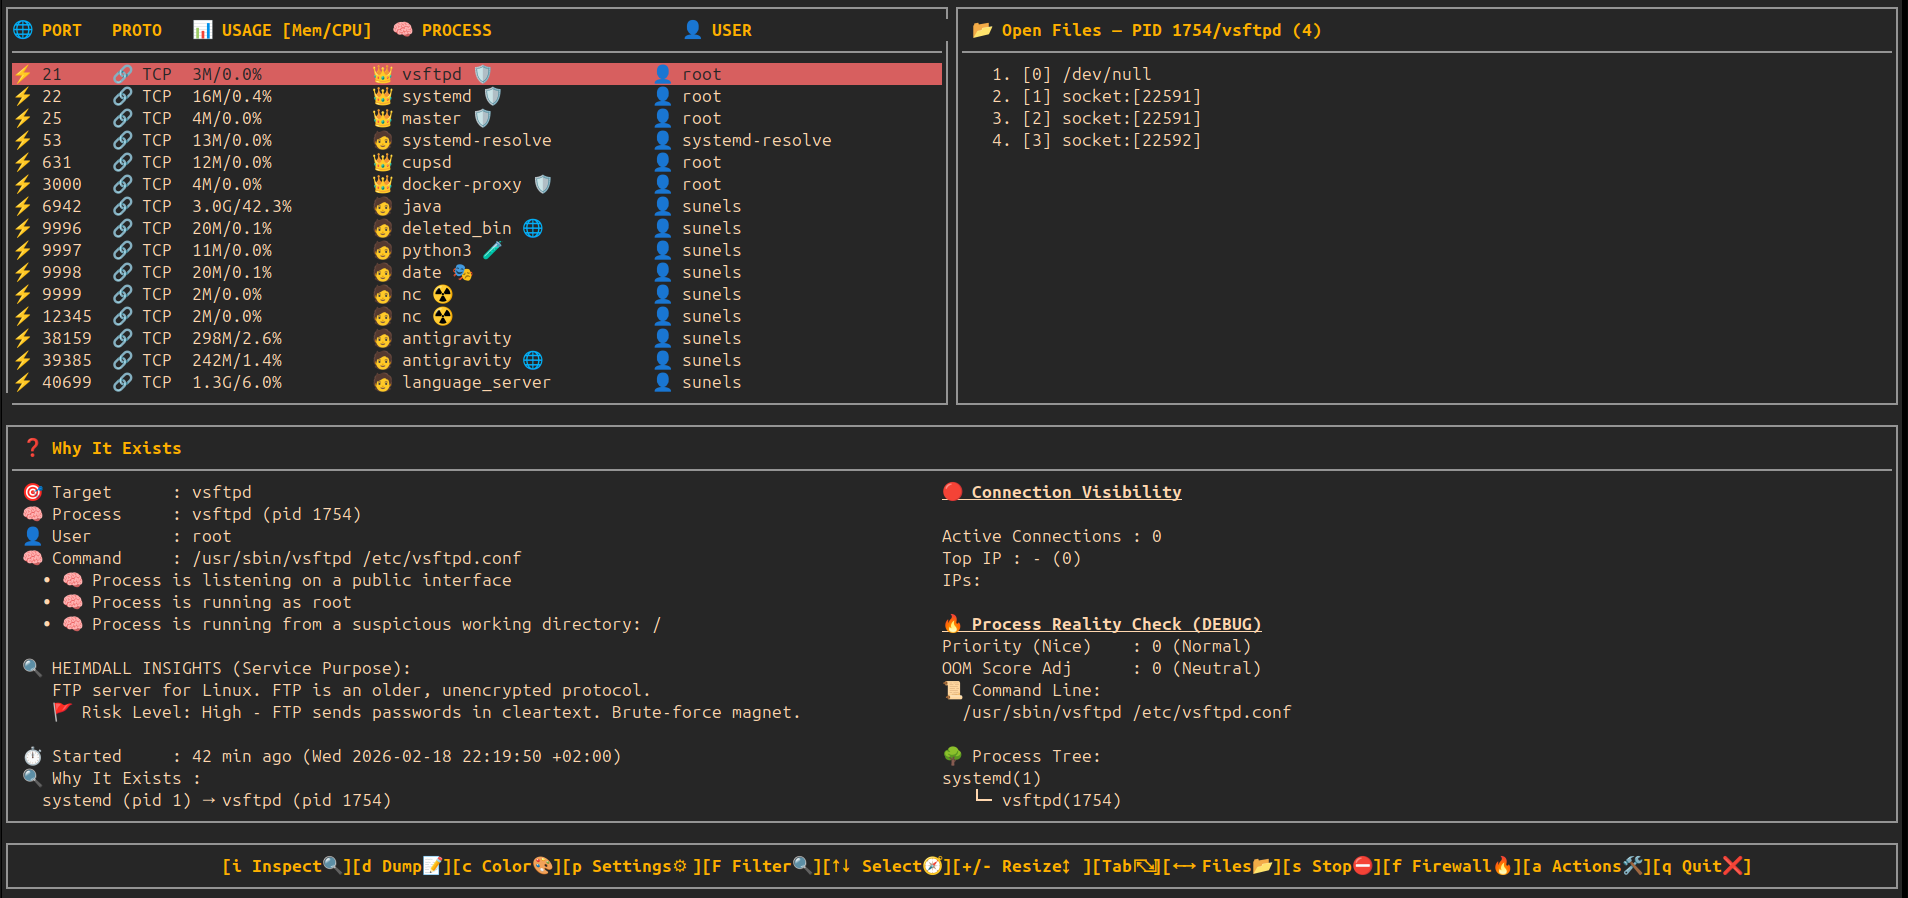
🛡️ Heimdall Sentinel — Behavioral Security Intelligence
🛡️ Sentinel Deep Audit — Intelligent Risk Scoring
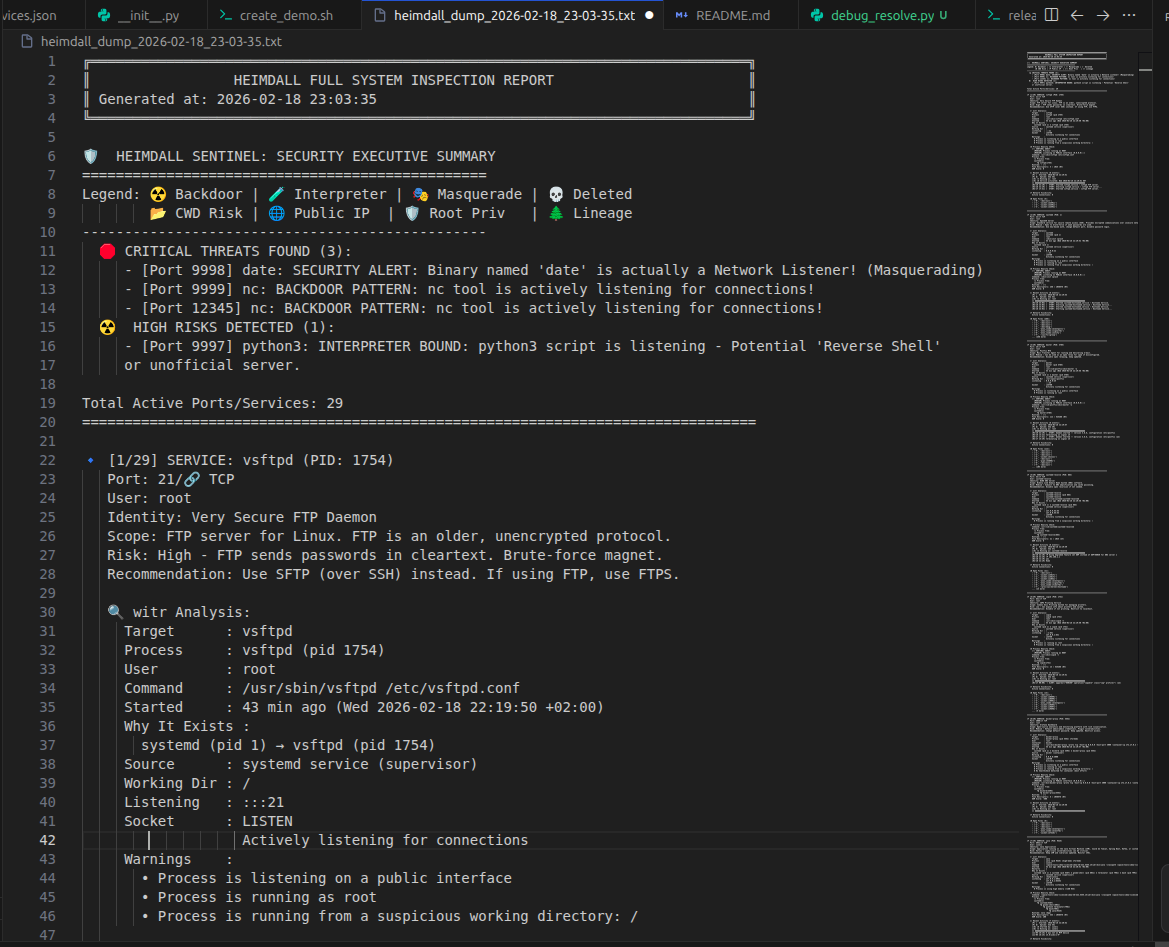
🛡️ Sentinel Report — Security Executive Summary
⚙️ System Services Manager (z) — View & Control Units (Active)
⚙️ System Services Manager — Info & Help (i)
📂 System Services Manager — All Unit Files (TAB)
🎮 Key Bindings
🖥️ Main View
| Key | Action |
|---|---|
| ↑ / ↓ | Move selection |
| + / - | Resize table height |
| → / ← | Scroll open files |
| r | Refresh port list |
| Tab | Switch to detail view |
| s | Stop selected process / service |
| f | Toggle firewall for selected port |
| a | Actions (open Action Center modal) |
| i | Inspect / Deep Information modal |
| F | Filter (Port, PID, User modal) |
| z | System Services Manager modal (TAB to switch view, 'i' for info) |
| d | Full System Dump (Reports all services/units to file) |
| p | Settings (Auto-update, etc.) |
| q | Quit |
📜 Detail View (witr output)
| Key | Action |
|---|---|
| ↑ / ↓ | Scroll |
| Tab | Back to main view |
| q | Quit |
🧠 How It Works
- Port discovery
ss -lntuHp
- Process resolution
- Extracts PID & program name from socket metadata
- CPU/Mem usage
- Uses
ps -p <pid> -o pcpu=,pmem=for human-readable metrics
- Uses
- Open file inspection
- Reads
/proc/<pid>/fd
- Reads
- Deep context
- Calls
witr --port <port>and annotates warnings
- Calls
- Control
- Optional process / service stop via
systemctlorkill - Temporary firewall block/unblock via F key
- Optional process / service stop via
🧪 Requirements
- 🐧 Linux only
- 🐍 Python 3.6+
- Required system tools:
ss(iproute2)systemctl/procfilesystemwitr(mandatory)psiptables/ufw(for firewall toggle)
- 🔐
sudoaccess required for:witr- stopping processes/services
- firewall rule management
- full
/procvisibility
🚀 Installation & Quick Start
Choose the installation method that fits your workflow.
📦 Option 1: Standalone Binary (Recommended)
No dependencies required. Works on any modern Linux.
- Download the latest
heimdallbinary from GitHub Releases. - Make it executable and run:
chmod +x heimdall
sudo ./heimdall
🐧 Option 2: Debian / Ubuntu (.deb)
Native system integration.
Download the .deb package from Releases layer:
sudo dpkg -i heimdall_0.8.0-1_all.deb
# If dependencies are missing:
sudo apt update && sudo apt install -f
🎩 Option 3: Fedora / RHEL / CentOS (.rpm)
Native RPM support.
# Build the RPM package
rpmbuild -ba heimdall.rpm.spec

# Install the generated RPM
sudo dnf install ~/rpmbuild/RPMS/noarch/heimdall-0.8.0-1.noarch.rpm
🏔️ Option 4: Arch Linux
Native Arch Linux package.
# Build and install using the provided PKGBUILD
makepkg -si
🐍 Option 5: Python / Pip
For Python users.
You can install directly from PyPI:
pip3 install heimdall-linux
Or download the .whl package from Releases and install:
# Install the downloaded wheel file
pip3 install heimdall-0.9.5-py3-none-any.whl

# Run
sudo heimdall
(Note: Requires witr installed separately)
🛠️ Option 6: Development (Source)
For contributors.
Clone the repo and prepare the environment:
git clone https://github.com/sunels/heimdall.git
cd heimdall

# Install dependencies (psutil, etc.) in editable mode
pip3 install -e .

# Run directly using the wrapper script:
sudo python3 run.py
🛡️ Daemon Mode (Background Protection)
Heimdall can run as a background daemon to monitor your system 24/7. It specifically watches for new outbound connections from processes that are already flagged as "Suspicious" by the Sentinel logic.
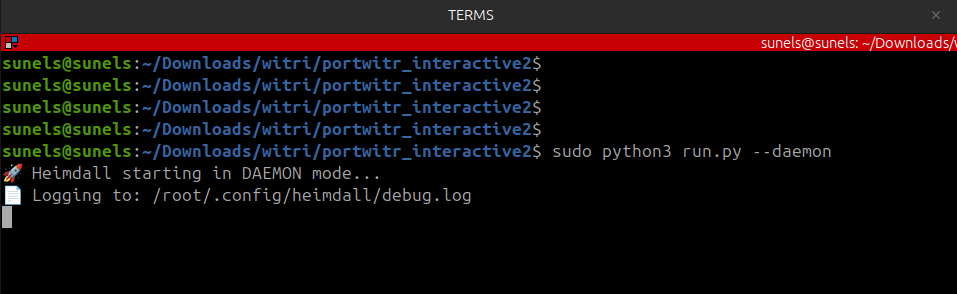
🚀 Usage
# Start manually in background
sudo heimdall --daemon

# Or enable via Settings (p) -> Daemon Mode: ON
🧠 How it protects
- Detection: Daemon polls connections every few seconds.
- Flagging: If a process with a HIGH/CRIT danger level (e.g. deleted binary, /tmp CWD) tries to connect to the internet.
- Suspension: Daemon immediately sends
SIGSTOPto the process. - Approval:
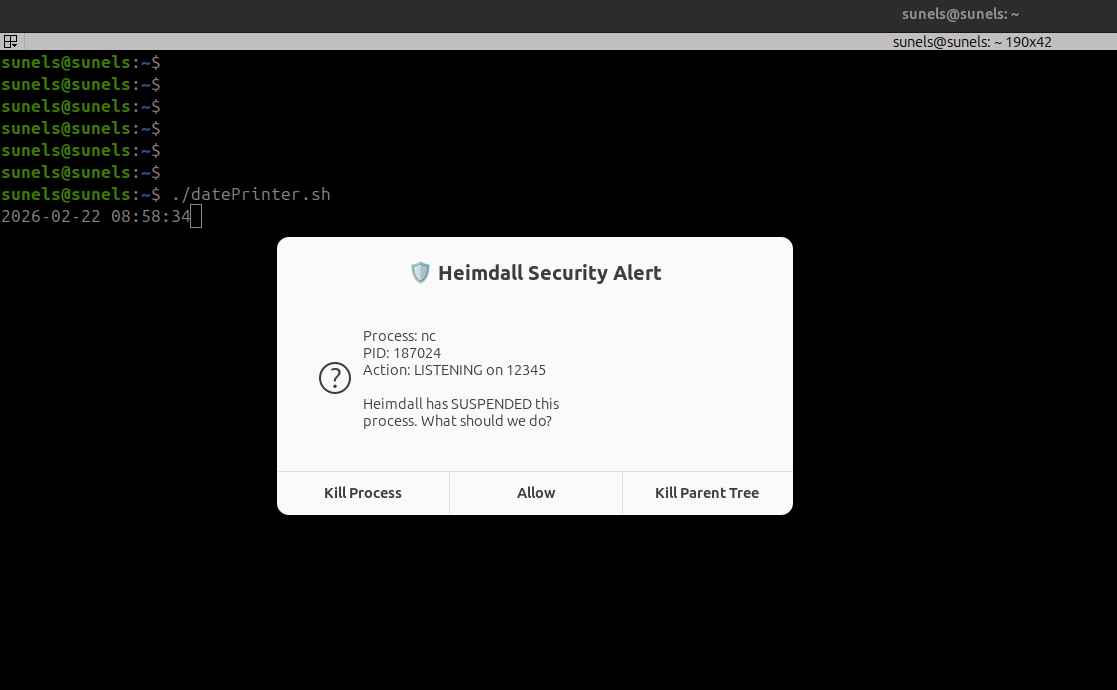
- If the Heimdall TUI is open, it pops up a Priority Alert Modal for you to Allow or Kill.
- If the TUI is closed, it sends a System Notification (
notify-send) and waits 30s.
- Enforcement: If denied or timed out, the process is Permanently Killed (
SIGKILL).
⚙️ Systemd Installation
To run Heimdall as a persistent system service:
- Copy the provided service file:
sudo cp heimdall.service /etc/systemd/system/ - Enable and start:
sudo systemctl enable --now heimdall - Check status/logs:
sudo systemctl status heimdalljournalctl -u heimdall -f
🛡️ Sentinel & Daemon Mode: The Safety Story
Heimdall isn't just a viewer; it's a proactive guardian. Here is how the Sentinel engine and Daemon mode work together to protect your system:
1. Advanced Risk Auditing
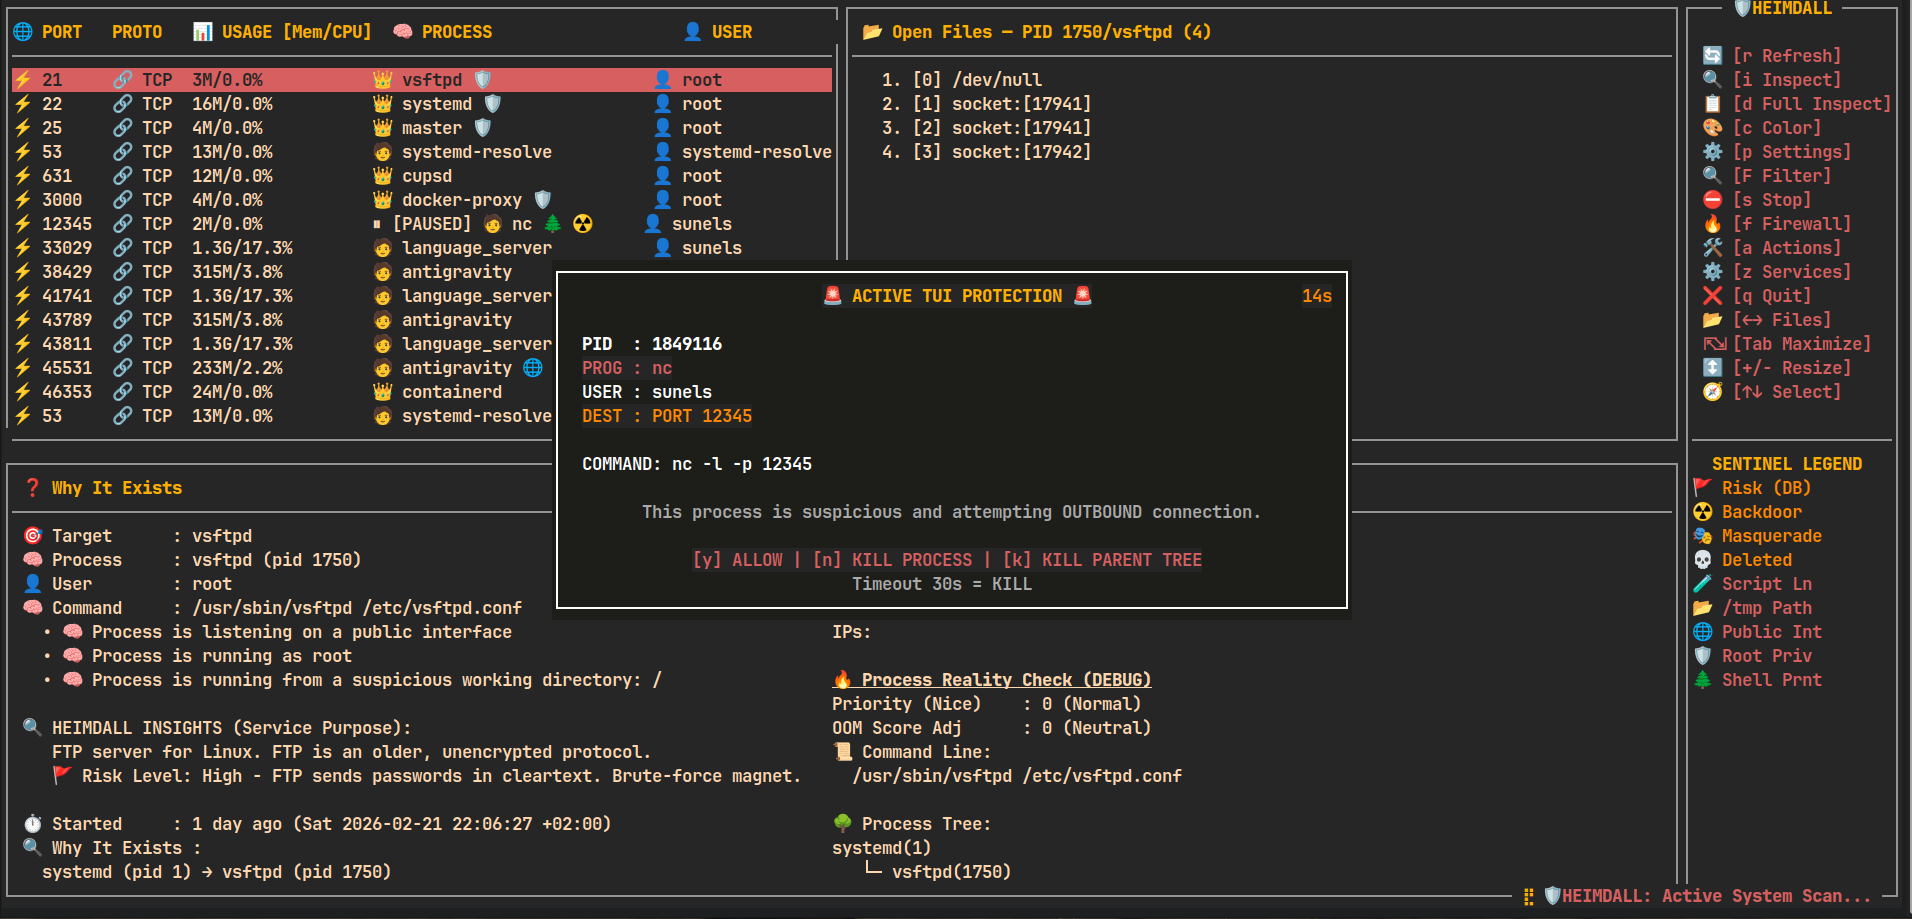
When you use the TUI, Heimdall Sentinel performs a deep dive into every listener. Below, it identifies an outdated vsftpd service running as root and flags it as High Risk, explaining exactly why it's a brute-force magnet.
2. Going "Hands-Free" with Daemon Mode
By running heimdall --daemon, you move the security logic into the background. It stays silent until a truly suspicious event occurs — like a script-managed backdoor attempt.
3. Real-time Intervention
The moment a suspicious process (like a hidden nc listener) tries to open a port, the Daemon immediately suspends it and prompts you with a high-priority intervention modal.
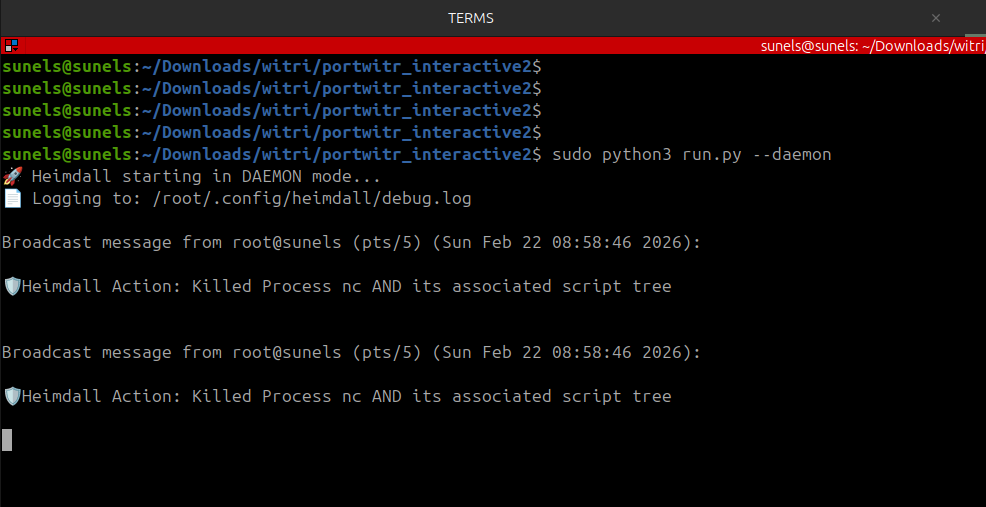
4. System-Wide Alerts
If you are working in another terminal, Heimdall sends a wall broadcast to all TTYs and a native desktop notification, ensuring you never miss a security event even if the TUI is closed.
🚀 Usage
Launch the interactive dashboard:
heimdall
🔍 Startup Filters
You can restrict the view to specific targets using command-line arguments:
# Filter by Port
heimdall --port 80

# Filter by PID
heimdall --pid 1234

# Filter by User
heimdall --user root

# Combine filters (e.g. root processes on port 443)
heimdall --port 443 --user root
🛠 Action Center (Interactive Operations)
Press a from the main screen to open the Action Center modal — a compact two-column modal grouping common operational actions for ports and processes.
UI / behavior highlights
- Monospace rendering inside curses; bordered window uses curses box().
- Padding: 2 spaces internal; text kept away from borders.
- Highlighting: reverse + bold for flash feedback (150–200ms) when a key is pressed.
- Single-key control: press the shown single-letter key (e.g.,
b) — no Enter or mouse required. - ESC closes the topmost modal; each modal closes independently. When the modal stack is empty the main screen is redrawn (same effect as pressing
r). - All actions run inside the same curses process and provide immediate feedback.
Action Center layout (icons mirror the UI)
- Left column — 🌐 PORT OPERATIONS
- 🚫 [b] Block IP
- 💥 [k] Kill Connections
- 🚦 [l] Connection Limit (planned)
- Right column — 🧠 PROCESS OPERATIONS
- ⚡ [h] Reload (SIGHUP)
- 💀 [9] Force Kill (SIGKILL)
- 🌳 [t] Force Kill Tree (Nuclear Kill)
- ⏸ [p] Pause Process (Tree-Aware)
- ▶ [c] Continue Process (Tree-Aware)
- 🔄 [r] Restart Service
- ⚖️ [n] Renice (Priority)
- ☠ [o] Adjust OOM Score
- 🐞 [d] Debug Dump
🚫 Block IP — details
Invoked from Action Center via [b]:
- Two ways to choose an IP:
- Select from "Top connections" list (single-key 1..8). Selection flashes briefly and executes immediately.
- Manual entry: press
mto start manual input, type the IP (digits,.for IPv4,:and hex for IPv6 allowed), Backspace supported, pressxto execute.
- Validation:
- Uses Python's
ipaddressmodule for final validation before applying rules. - Textual length limits applied (reasonble max for IPv4/IPv6) to reject obviously invalid submissions.
- Uses Python's
- Execution:
- Blocks via iptables (sudo) using a DROP rule limited to the selected port.
- The UI updates a local cache of blocked IPs and shows that list inside the modal under "⛔ Blocked IPs".
- After a successful block the application requests a full refresh (same behavior as pressing
r) so the main view reflects changes immediately.
- Safety notes:
- Blocking requires sudo and iptables — ensure appropriate privileges.
- Actions are immediate and affect live traffic; use with care.
💥 Kill Connections — details
Invoked from Action Center via [k]:
- Lists all active ESTABLISHED connections for the selected port (up to 9 connections shown for single-key selection)
- Each connection shows: protocol (TCP/UDP), local address:port, and remote address:port
- Selection:
- Press a number key (1-9) to select and kill the corresponding connection
- Selected connection flashes briefly before termination
- Press ESC to cancel without killing any connection
- Execution:
- Primary method: Uses
sudo ss -Kto forcefully terminate the TCP connection - Fallback method: If
ss -Kfails, attempts to useconntrack -Dto drop the connection from the connection tracking table - After successful termination, the UI automatically refreshes to reflect changes
- Primary method: Uses
- Use cases:
- Terminate suspicious or unwanted connections
- Free up connection slots when debugging connection limits
- Quickly disconnect specific clients without affecting other connections
- Safety notes:
- Requires sudo privileges for
ss -Korconntrackcommands - Connection termination is immediate and forceful (similar to TCP RST)
- Use with caution in production environments
- If connection count exceeds 9, only the first 9 are shown (consider using Block IP for bulk operations)
- Requires sudo privileges for
🚦 Connection Limit — details
Invoked from Action Center via [l]:
- Purpose: Limit concurrent TCP connections per IP to mitigate DoS attacks or ensure fair resource usage.
- View Rules: Lists existing iptables
connlimitrules for the selected port. - Add Limit: Quickly add predefined per-IP limits (5, 10, 25, 50, 100) using shortcut keys
[a-e].- Uses
iptableswithconnlimitmodule. - Action is
REJECTwithtcp-reset(polite refusal).
- Uses
- Remove Limit: Press
[x]to remove all existing limit rules for the port. - Safety:
- Limits are enforced immediately via
sudo iptables. - Non-persistent (cleared on reboot unless saved manually).
- Limits are enforced immediately via
🔍 Interactive System Filter — details
Invoked from Main View via [F]:
- Dynamic Filtering: Instantly narrow down the live list without restarting the application.
- Supported Fields:
[p] Port: Filter by specific listener port (e.g.,80,443).[i] PID: Filter by specific Process ID.[u] User: Filter by process owner (e.g.,root,www-data).
- Interactive Input:
- Press the field key (p, i, or u) to start typing.
- Real-time buffer: See what you are typing before applying.
- Press ENTER to save the value to the filter set.
- Press ESC while typing to cancel the current field edit.
- Apply & Clear:
- Press ESC (when not typing) to apply filters and return to the main view.
- Press
[c]to clear all active filters instantly.
- Status Indicator: When filters are active, a "🔍 Filter: ..." status line appears above the help bar in the main view.
🛡️ Heimdall Sentinel — details
Heimdall Sentinel is a behavioral heuristic engine that goes beyond simple process listing. It analyzes process metadata, command-line arguments, working directories, and process lineage to detect anomalies that traditional tools miss.
Key Behavioral Detections:
- ☢️ Backdoor Patterns: Detects Netcat (
nc),socat, and other tools when they are used as active network listeners (e.g.,nc -l). - 🧪 Interpreter Bound: Flags scripting languages (
python,bash,node,perl) that are listening on ports without a known development context (Potential Reverse Shells). - 🎭 Masquerading: Identifies malicious processes that use innocent names (like
ls,ps, ordate) but are actually network services. - 💀 Integrity Alerts: Flags processes running from executables that have been deleted from the disk (a common malware persistence technique).
- 🌲 Lineage Analysis: Detects suspicious process trees, such as network listeners spawned directly from a user shell instead of a proper system supervisor like
systemd. - 📂 Path & Privilege: Alerts on processes running from world-writable directories (
/tmp) or possessing unnecessary root privileges.
Sentinel Intelligence Locations:
- Main View: Visual icons (
☢️,💀,🧪) appear next to process names for instant triage. - Deep Inspection (i): Shows a prioritized list of security findings with human-readable explanations.
- Daemon Mode: Monitors all outbound connections in real-time and suspends any process flagged by Sentinel until approved.
- Full System Dump (d): Includes a Security Executive Summary at the top of the report, grouping all critical threats for quick review.
UI / Implementation notes
- Modal sizing is responsive to terminal size and has been widened to reduce text wrapping compared to earlier versions.
- Feedback messages are shown using a short non-blocking centered message overlay (no need to press an extra key to continue).
- The "Block IP" modal uses emoji/iconography to make options clearer and more visible in the TUI.
⚠️ Safety Notes (expanded)
- Destructive actions (stop, kill, firewall changes) require explicit keys; confirmation dialogs are used for stop operations.
- Blocking via iptables is immediate—this tool does not create persistent firewall rules across reboots.
- Non-root usage limits visibility; some operations require sudo.
🛡️ Risk & Security Indicators
Heimdall now proactively flags potential security issues directly in the main view using the Sentinel Heuristic Engine:
| Icon | Level | Meaning | Description |
|---|---|---|---|
| 🚩 | DB | High Risk Service | Known risky service (e.g., FTP, Telnet, Redis) from building-in database. |
| ☢️ | CRIT | Backdoor Pattern | nc, socat or similar tools actively waiting for inbound connections. |
| 🎭 | CRIT | Masquerading | Binary named like a common tool (ls, ps, date) but acting as a network listener. |
| 💀 | CRIT | Deleted Binary | The process is running from a deleted executable (Common malware behavior). |
| 🧪 | HIGH | Script Listener | An interpreter (python, bash, node) is listening without a known dev context. |
| 📂 | HIGH | Suspicious CWD | Process is working from world-writable directories like /tmp or /dev/shm. |
| 🌐 | MED | Public Exposure | Service is listening on 0.0.0.0 or :: (Public) instead of localhost. |
| 🛡️ | MED | Root Privilege | Process belongs to the root user (Surface area risk). |
| 🌲 | MED | Shell Lineage | Process was spawned from a shell/terminal instead of a proper system service. |
Example: 👑 nc ☢️ means a Netcat process is running as root and has been flagged as a potential Backdoor.
🧩 Design Philosophy
- ❌ No reinvention of system tools
- ✅ Built on native Linux introspection
- 🔍 Read-only by default (except explicit stop/firewall actions)
- 🎯 Optimized for:
- “Port already in use” debugging
- Security inspection
- DevOps / SRE diagnostics
- Understanding legacy systems
📁 Project Structure
heimdall/
├── heimdall/            # 📦 Core Python Package
│   ├── __init__.py      # Main application logic & UI
│   ├── __main__.py      # Entry point (python -m heimdall)
│   ├── services.json    # Default service definitions database
│   └── services.sha256  # Integrity verification hash
├── screenshots/         # 📸 README screenshots & logo
├── run.py               # 🚀 Development wrapper script (run without installing)
├── release.sh           # 🤖 Automated build & release script
├── setup.py             # Python package configuration (pip/build)
├── MANIFEST.in          # Package file inclusion rules
├── debian/              # Debian packaging configuration
└── README.md
🛣️ Roadmap (Ideas)
- 🔎 Port search & filters
- 📤 JSON export
- 🧪 Parser unit tests
- 🍎 Partial macOS support
- 🔌 Plugin system
🚀 Release Management (For Maintainers)
Heimdall includes an automated release.sh script to manage versioning, builds, and publishing to PyPI, Debian, and GitHub.
📦 Prerequisites
# Install build and twine
pip install --upgrade build twine
🔑 Set Credentials
Before releasing, set your PyPI token:
export TWINE_USERNAME=__token__
export TWINE_PASSWORD=pypi-YOUR_TOKEN_HERE
🚢 Perform Release
The script automatically bumps versions in all metadata files, builds Wheel/Sdist/Deb, and uploads to PyPI.
# Bump patch (0.9.4 -> 0.9.5) and release to PyPI
./release.sh patch

# Bump minor (0.9.4 -> 1.0.0)
./release.sh minor

# Release to TestPyPI for verification
./release.sh patch --test
📄 License
MIT License
👤 Author
Serkan Sunel
🔌 heimdall
See the whole picture — not just the port.
🛠 Performance / Startup caching
- The TUI now eagerly preloads heavy data (witr output, connection lists, open-files and per-PID usage) for all discovered ports during the splash/startup phase. This means:
- First launch may take a little longer (splash progress shows updates), but subsequent scrolling is instant because data is read from in-memory caches.
- The UI operates on a read-only "snapshot" taken at startup — no heavy system commands are executed while you scroll. If you need fresh data, press
rto refresh (re-takes the snapshot).
- You can tune caching TTL constants in the source (USAGE_TTL, FILES_TTL, PARSE_TTL, WITR_TTL, CONN_TTL) to balance freshness vs. UI responsiveness.
Release history Release notifications | RSS feed


Download files
Download the file for your platform. If you're not sure which to choose, learn more about installing packages.
Source Distribution
Built Distribution
Filter files by name, interpreter, ABI, and platform.
If you're not sure about the file name format, learn more about wheel file names.
Copy a direct link to the current filters
File details
Details for the file heimdall_linux-0.9.6.tar.gz.
File metadata
- Download URL: heimdall_linux-0.9.6.tar.gz
- Upload date:
- Size: 100.9 kB
- Tags: Source
- Uploaded using Trusted Publishing? No
- Uploaded via: twine/6.2.0 CPython/3.12.3
File hashes
| Algorithm | Hash digest | |
|---|---|---|
| SHA256 |
26f46df0e7558461f7f232124bad151e5e381c91c35a3567ddcf77777b22d150
|
|
| MD5 |
134db13c30548b481886cb5de8e75b97
|
|
| BLAKE2b-256 |
2580727a75fb349dd20a58c5d5ae6e8e773e72b9f7a17a30c8cb338fd0a1a6b0
|
File details
Details for the file heimdall_linux-0.9.6-py3-none-any.whl.
File metadata
- Download URL: heimdall_linux-0.9.6-py3-none-any.whl
- Upload date:
- Size: 92.6 kB
- Tags: Python 3
- Uploaded using Trusted Publishing? No
- Uploaded via: twine/6.2.0 CPython/3.12.3
File hashes
| Algorithm | Hash digest | |
|---|---|---|
| SHA256 |
d784f9a3ddbabf205d66b3e54664ced18f9161910a9b4b3ebc0e27dd0c626fd4
|
|
| MD5 |
a2e63df88ee874edadd4b3cb72ac42f0
|
|
| BLAKE2b-256 |
505607cde43fe984ef2dde618effd30f10d1cd83a44eacc682d539f772e2e709
|


