



"To deal with hyper-planes in a 14 dimensional space, visualize a 3D space and say 'fourteen' very loudly. Everyone does it." - Geoff Hinton
Overview
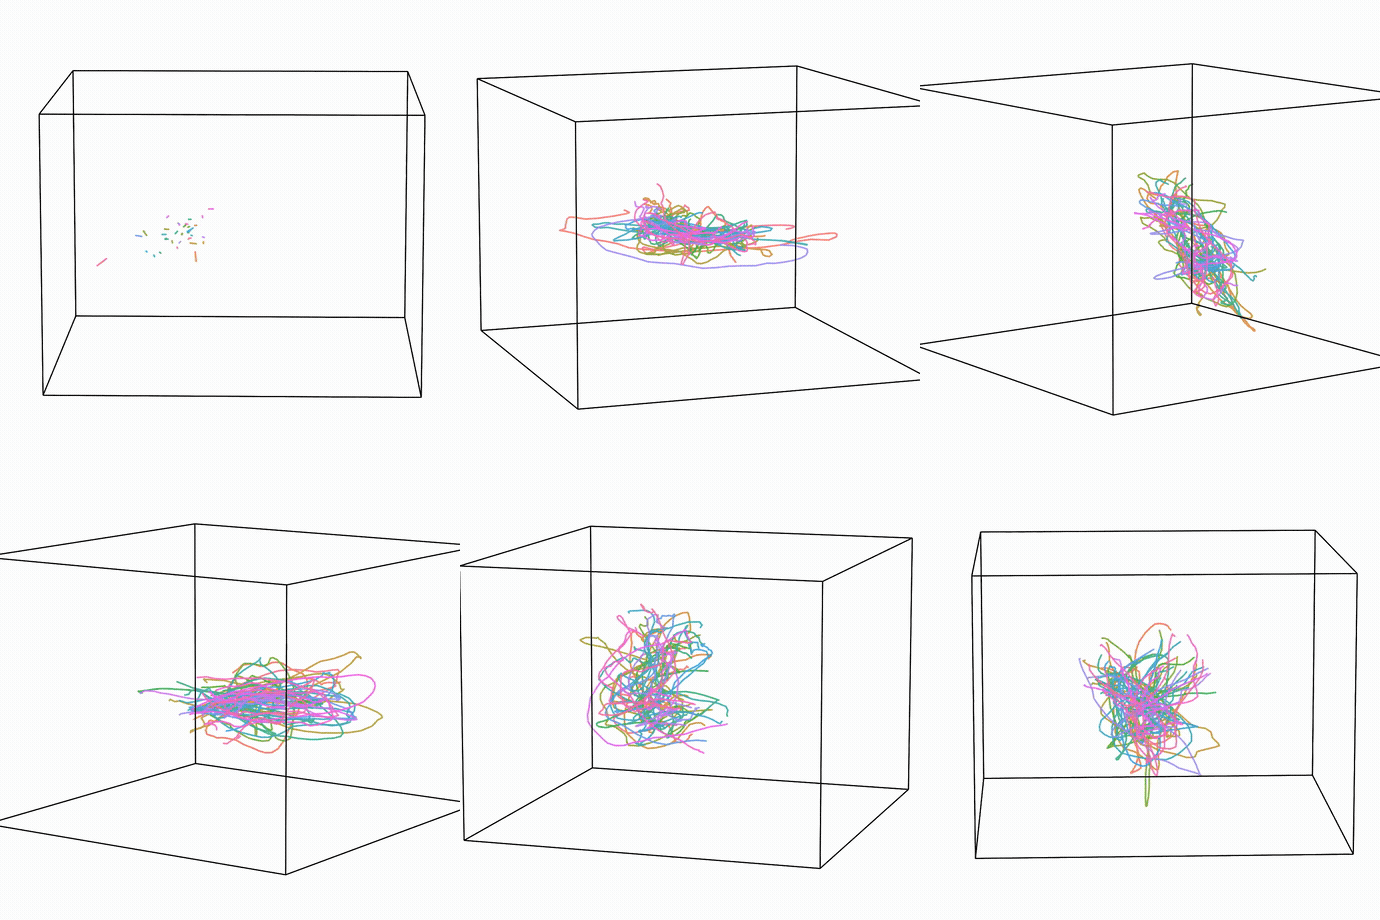
HyperTools is designed to facilitate dimensionality reduction-based visual explorations of high-dimensional data. The basic pipeline is to feed in a high-dimensional dataset (or a series of high-dimensional datasets) and, in a single function call, reduce the dimensionality of the dataset(s) and create a plot. The package is built atop many familiar friends, including matplotlib, scikit-learn and seaborn. Our package was featured in 2017 on Kaggle's now-retired "No Free Hunch" blog (archived copy). For a general overview, you may find this talk useful (given as part of the MIND Summer School at Dartmouth).
What's new
1.1 makes hierarchical (MultiIndex) DataFrames a first-class input,
grows the animation API, adds model comparisons for forecasting and
imputation, loads text and market data in one line, and installs optional
extras on demand.
1.0 was a ground-up rewrite that keeps the familiar API. It added an
optional interactive (plotly) backend, hyp.Pipeline, hyp.manip,
hyp.predict and hyp.impute, morph and 2-D animations, and more text
embedding models, and it runs on Python 3.10–3.13. A few long-deprecated
arguments were removed.
The changelog has the complete list for both releases, including what changed for code and saved data from earlier versions.
A quick tour
Each clip below is one of the animated examples from the tutorials; follow the link under a clip for the full code and the full-length animation.
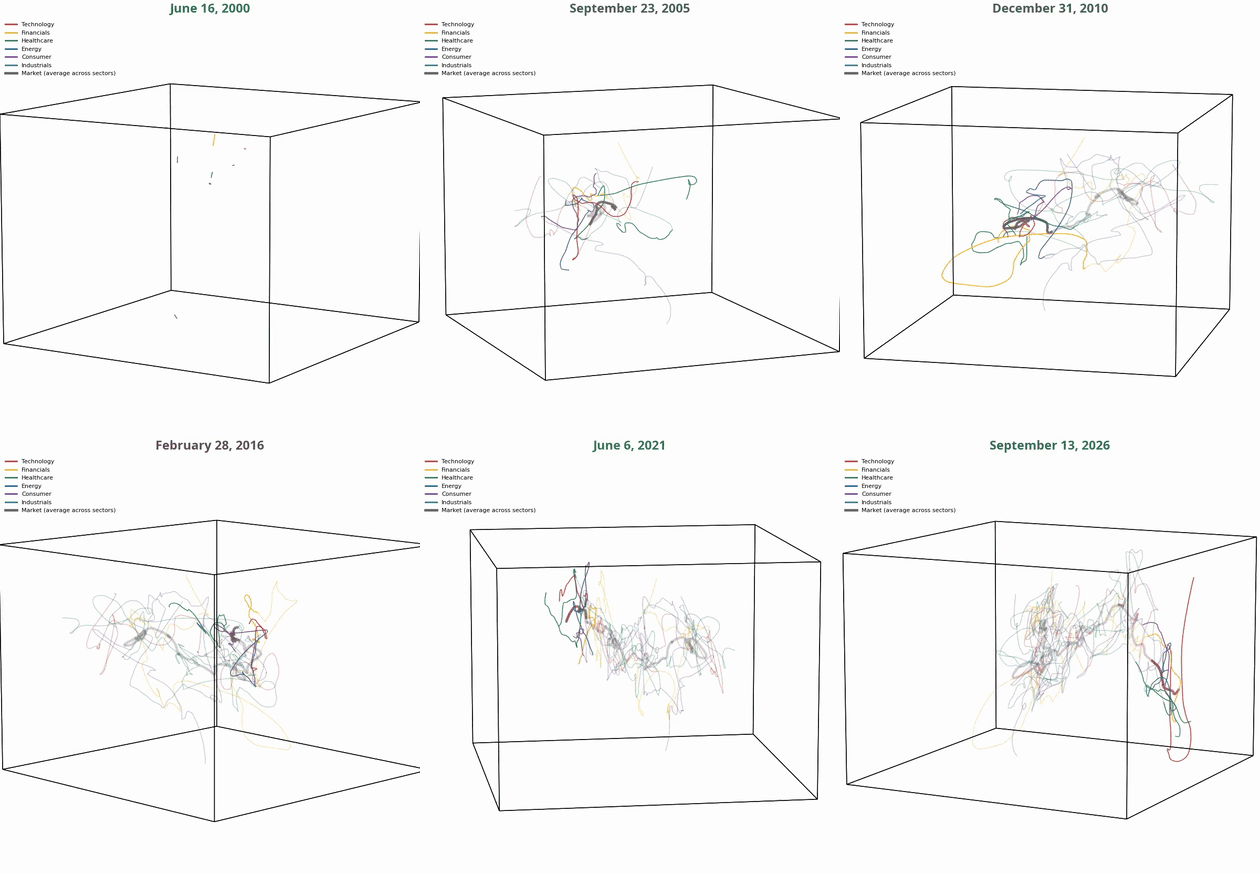
Many datasets in one space
Six stock-market sectors, each reduced to 3-D on its own and then hyperaligned into a shared space, with a heavier path for the market as a whole.
Text goes in, geometry comes out
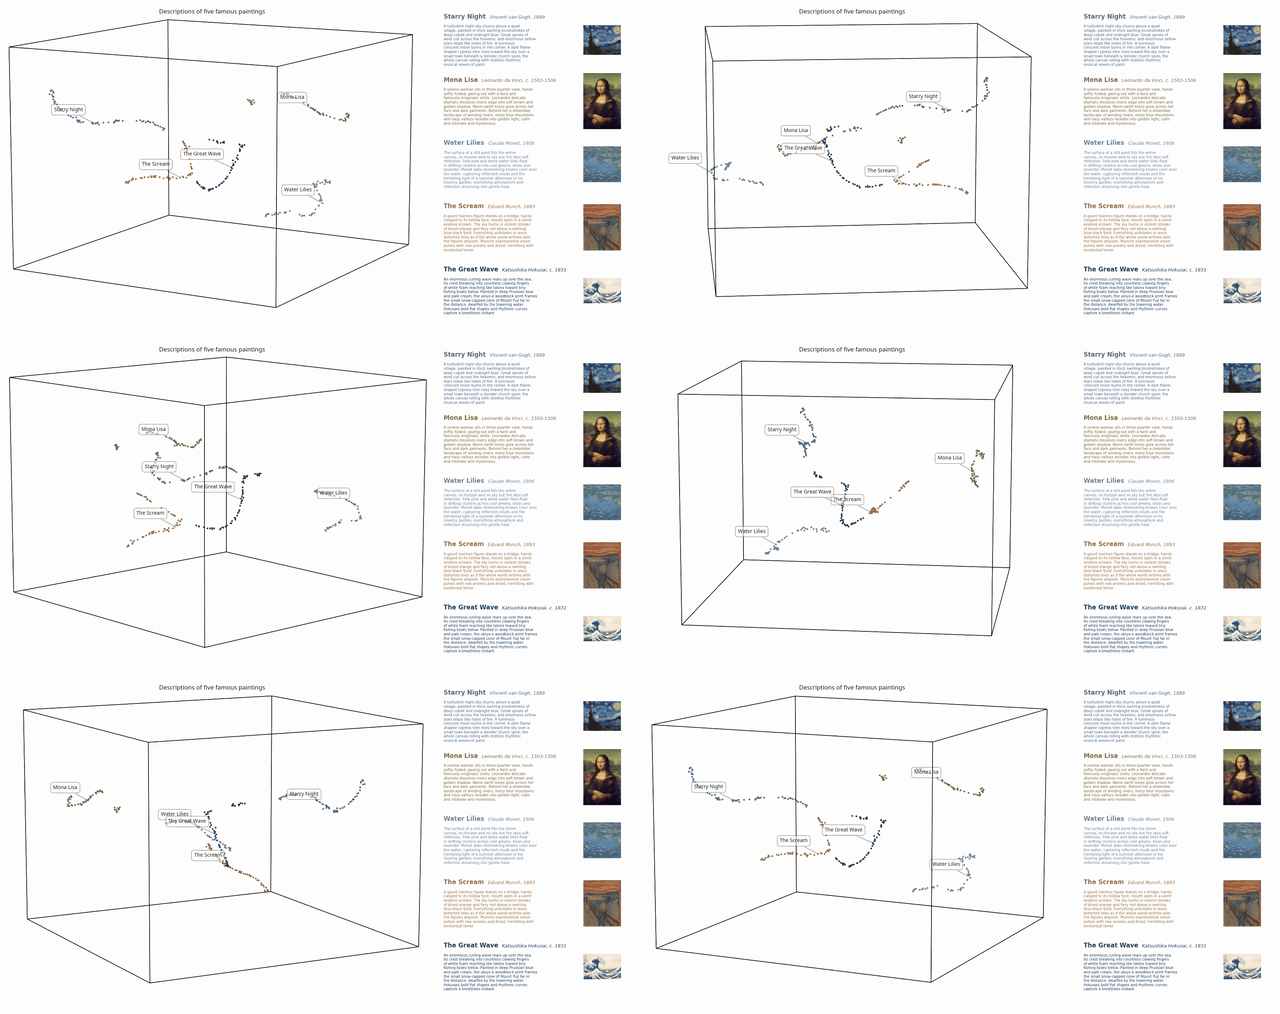
Give hyp.plot a list of strings and it embeds them, projects them into 2-D
or 3-D, and plots the result. Here a paragraph about each of five paintings
becomes its own cloud, drawn in a color pulled from the canvas itself.
Reveal a dataset over time
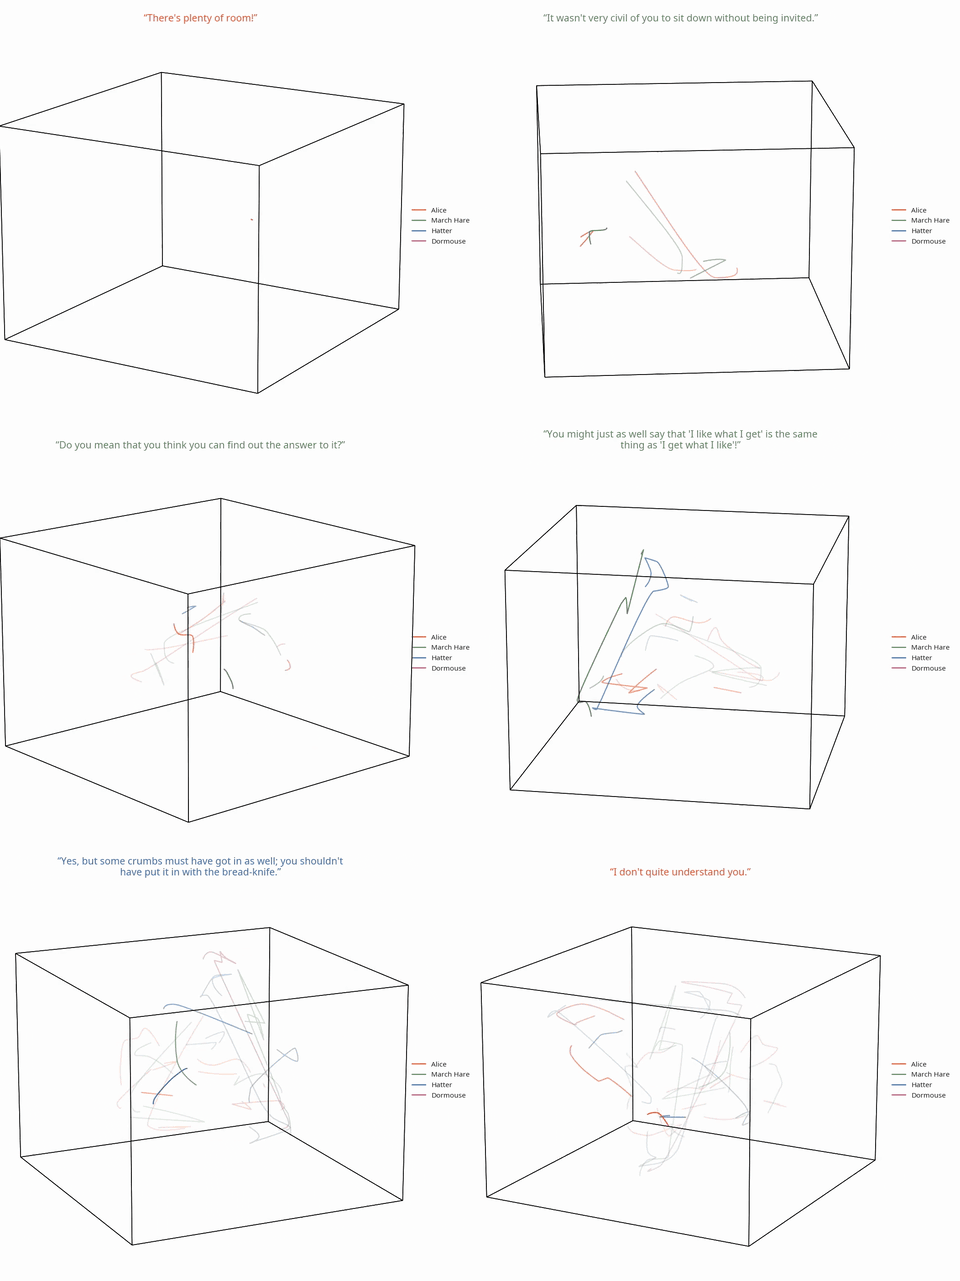
order='serial' reveals a dataset one piece at a time. This is the Mad
Tea-Party from Alice's Adventures in Wonderland: each segment is one turn of
the conversation, colored by speaker and placed by what is being said.
Tutorial: the shape of a conversation
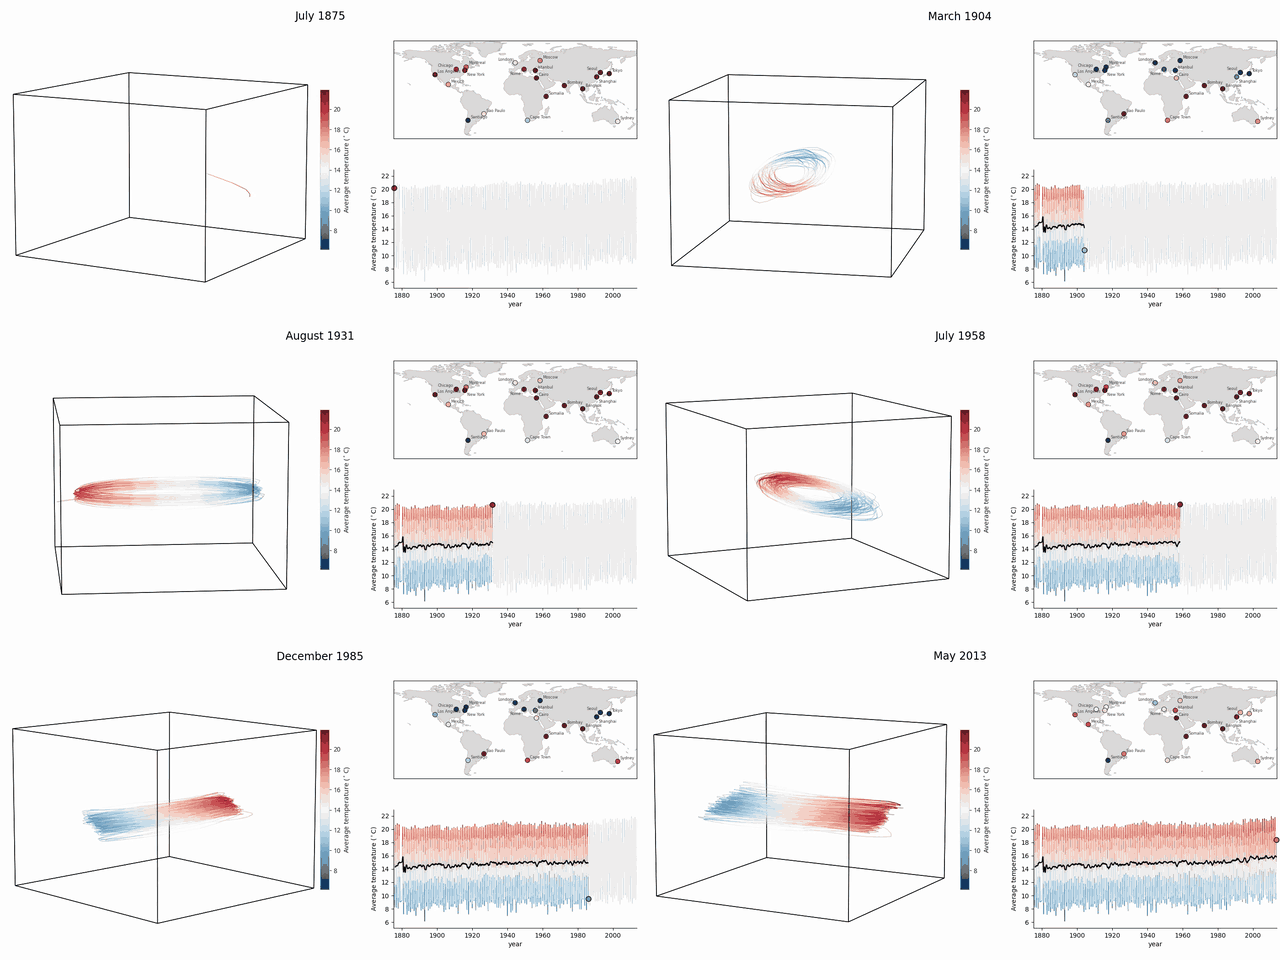
Many features, one path
Monthly temperatures in 20 cities around the globe, from 1875 to 2013, drawn as a single path and colored by the average temperature that month.
Tutorial: weather across the decades
Morph between shapes
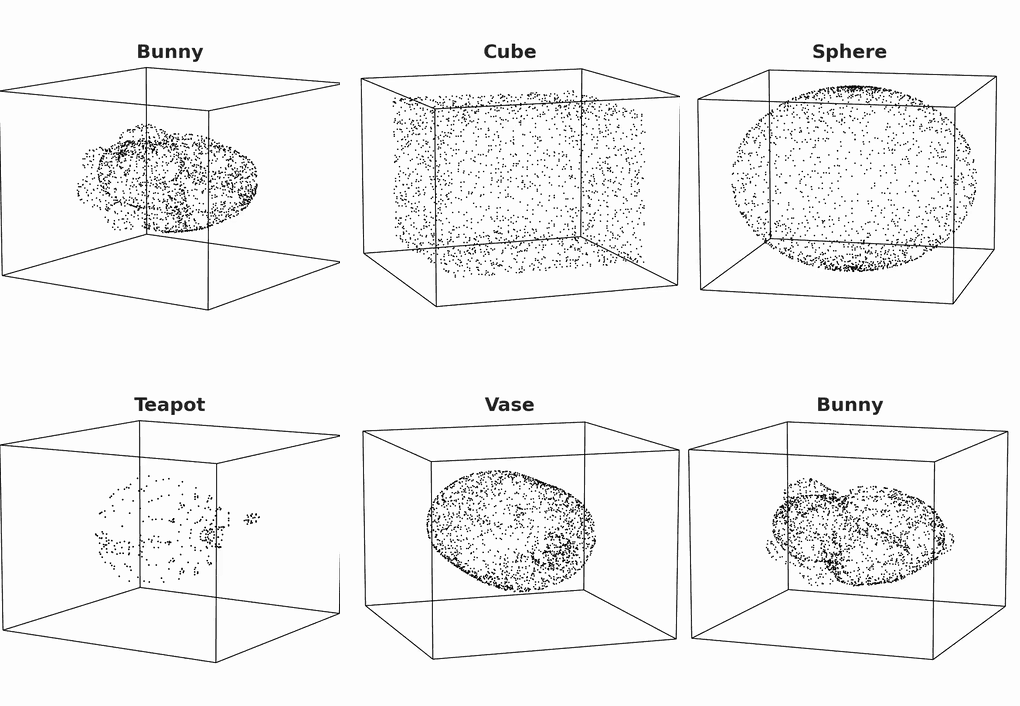
animate='morph' interpolates between point clouds or meshes. These are some
of the built-in shapes that hyp.load provides.
import hypertools as hyp
names = ['bunny', 'cube', 'sphere', 'teapot', 'vase']
shapes = [hyp.load(n) for n in names]
hyp.plot(shapes, '.', color='k', animate='morph', title=names)
Tutorial: morphing the shapes zoo
Try it!
Check the repo of Jupyter notebooks from the HyperTools paper (note: those notebooks predate the 1.x API described below). For up-to-date, runnable examples covering every 1.1 feature, see the example gallery in the docs.
Installation
To install the latest stable version run:
pip install hypertools
To install the latest unstable version directly from GitHub, run:
pip install -U git+https://github.com/ContextLab/hypertools.git
Or alternatively, clone the repository to your local machine:
git clone https://github.com/ContextLab/hypertools.git
Then, navigate to the folder and type:
pip install -e .
(These instructions assume that you have pip installed on your system)
Optional extras install themselves on demand
The optional features listed under What's new (the plotly backend, HF text
embeddings, the Laplace and Chronos forecasters, autoencoder reducers,
gensim vectorizers, Kaggle loading, LSL streaming, 3-D density iso-surfaces,
.xlsx loading) are declared as extras in pyproject.toml:
pip install "hypertools[interactive]", hypertools[text],
hypertools[predict], hypertools[predict-hf], hypertools[torch],
hypertools[gensim], hypertools[kaggle], hypertools[lsl],
hypertools[density3d], hypertools[io]. You do not have to install them
ahead of time: the first call that needs one installs that extra's
requirements into the running interpreter (printing a one-line notice) and
carries on. hypertools itself is never reinstalled, so a development or
branch install stays as it is. Static image export with the plotly backend
also provisions what kaleido needs on first use (a Chrome build and, on
Debian/Ubuntu images such as Colab and Kaggle, the system libraries it
lacks). hyp.set_autoinstall(False) turns this off (for the session, or
for one block as a context manager); a missing extra then raises
ImportError with the manual pip install command.
Requirements
- python>=3.10
- scikit-learn>=1.5.2
- pandas>=2.2.3
- seaborn>=0.13.0
- pillow>=10.4.0
- matplotlib>=3.9.2
- scipy>=1.14.1
- numpy>=2.1.0
- umap-learn>=0.5.5, numba>=0.61.0
- pydata-wrangler>=0.5.1 (data-wrangling core)
- pykalman>=0.11, statsmodels>=0.14.3 (Kalman/ARIMA forecasting; Kalman imputation)
- requests>=2.31.0, dill>=0.3.8, ipympl>=0.9.3
- ffmpeg (for saving animations)
All Python dependencies are declared in pyproject.toml and installed
automatically by pip. The base install covers all core functionality
(plotting, dimensionality reduction, alignment, clustering, normalization,
Kalman/ARIMA forecasting, and missing-data imputation) and therefore pulls in the
full scientific stack (NumPy, SciPy, pandas, scikit-learn, matplotlib,
seaborn, UMAP/Numba, statsmodels, pykalman, ipympl, pydata-wrangler); it is
not a minimal footprint. Heavier optional model families are separated into
extras that add features on request (mix and match, e.g.
pip install "hypertools[interactive,torch]"):
interactive-- plotly + kaleido, forhyp.plot(..., backend='plotly'). kaleido renders static images (PNG/PDF, and the frames of saved plotly animations) through a headless Chrome, which hypertools provisions on first use (see Optional extras install themselves on demand above); if that is not possible, the error says what to run. Interactive/HTML plotly output needs no browser.text-- transformer/sentence-transformers text embeddings (via datawrangler'shfextra)predict-- the skatersLaplaceensemble forecaster forhyp.predict(Kalman,GaussianProcess,AutoRegressor, andARIMAalready work with the base install)predict-hf-- the Hugging FaceChronosforecaster forhyp.predictio--.xlsxsupport forhyp.loaddensity3d-- smooth 3-Ddensity=Trueiso-surfaces (scikit-image)torch-- the six autoencoder reducers (reduce='Autoencoder'and variants)kaggle--hyp.load('kaggle/<owner>/<dataset>')lsl--hyp.io.lsl_stream(...)(Lab Streaming Layer input)gensim--Word2Vec/Doc2Vec/FastTextvectorizers andLdaModel/LsiModel/HdpModelsemantic modelsdev-- test/development dependencies (pip install -e ".[dev]")
Documentation
Check out our readthedocs page for further documentation, complete API details, and additional examples.
Citing
We wrote a short JMLR paper about HyperTools, which you can read here, or you can check out a (longer) preprint here. We also have a repository with example notebooks from the paper here.
Please cite as:
Heusser AC, Ziman K, Owen LLW, Manning JR (2018) HyperTools: A Python toolbox for gaining geometric insights into high-dimensional data. Journal of Machine Learning Research, 18(152): 1--6.
Here is a bibtex formatted reference:
@ARTICLE{heusser2018hypertools,
    author  = {Andrew C. Heusser and Kirsten Ziman and Lucy L. W. Owen and Jeremy R. Manning},
    title   = {HyperTools: a Python Toolbox for Gaining Geometric Insights into High-Dimensional Data},
    journal = {Journal of Machine Learning Research},
    year    = {2018},
    volume  = {18},
    number  = {152},
    pages   = {1-6},
    url     = {http://jmlr.org/papers/v18/17-434.html}
}
Contributing
If you'd like to contribute, please first read our Code of Conduct.
For specific information on how to contribute to the project, please see our Contributing page.
Testing
CI runs on every push via GitHub Actions (badge at the top of this page).
To test HyperTools locally, install pytest (pip install -e ".[dev]") and run pytest in the HyperTools folder.
Examples
See here for more examples.
Plot
import numpy as np
import hypertools as hyp

# two random-walk "datasets" (rows = observations, columns = features)
walk = lambda seed: np.cumsum(np.random.default_rng(seed).standard_normal((300, 10)), axis=0)
list_of_arrays = [walk(1), walk(2)]
list_of_labels = ['A'] * 300 + ['B'] * 300  # one label per observation

hyp.plot(list_of_arrays, animate=True, hue=list_of_labels)

Align
import numpy as np
import hypertools as hyp

# rotated, noisy views of one shared trajectory
rng = np.random.default_rng(0)
base = np.cumsum(rng.standard_normal((300, 3)), axis=0)
list_of_arrays = [base @ np.linalg.qr(rng.standard_normal((3, 3)))[0]
                  + 0.05 * rng.standard_normal(base.shape) for _ in range(3)]

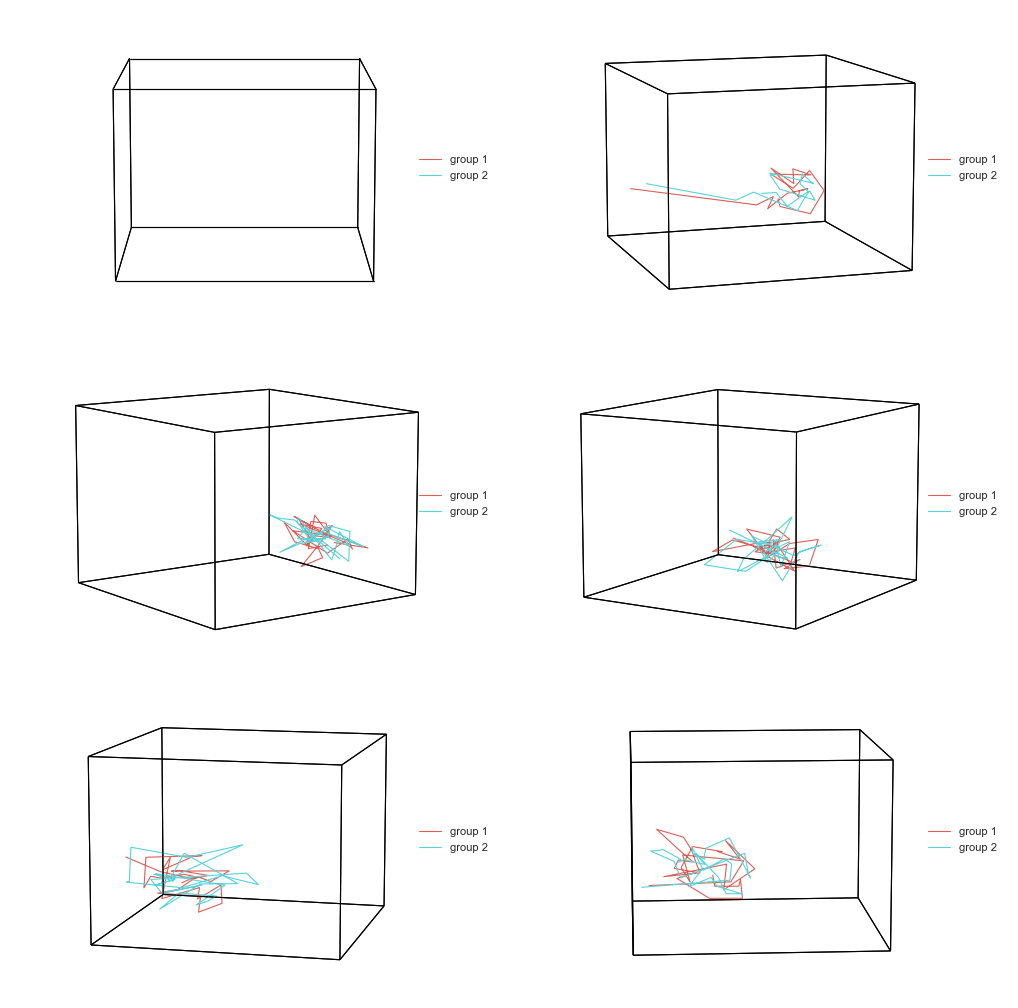
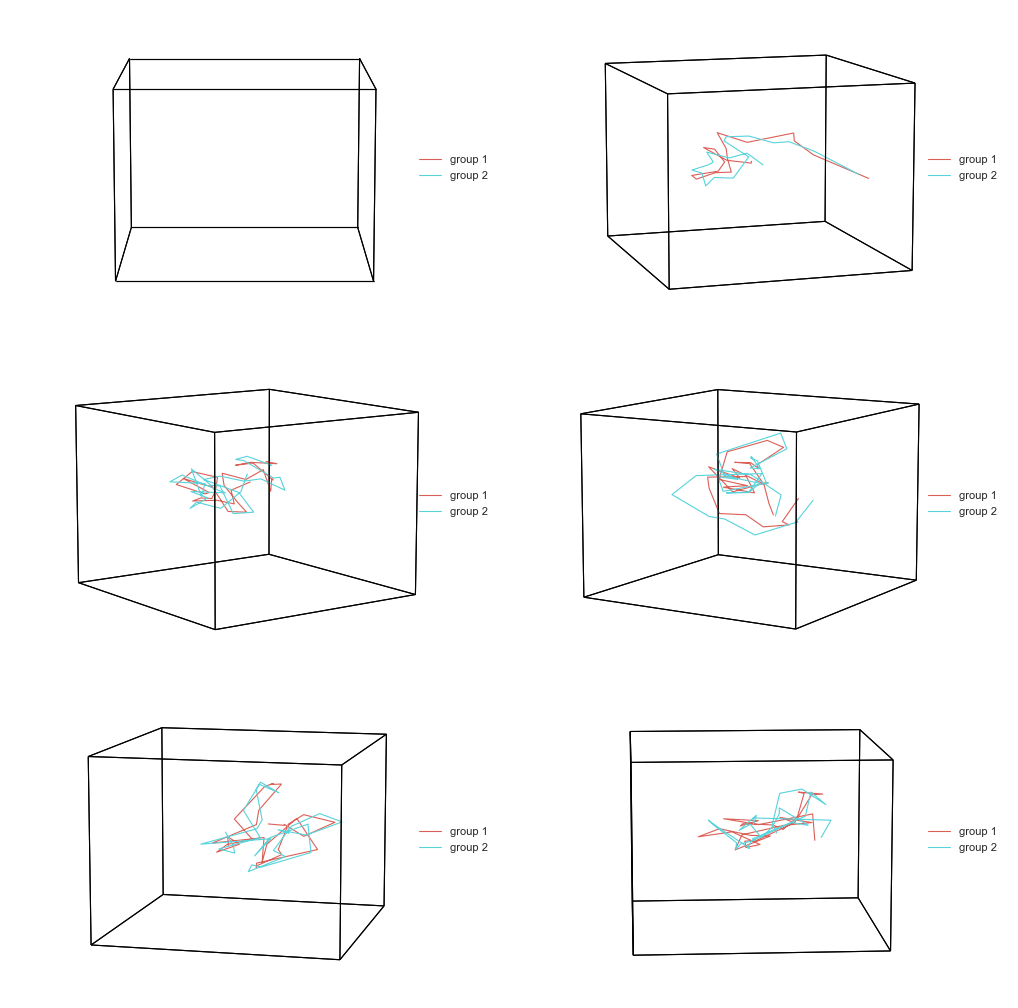
hyp.plot(list_of_arrays, align='hyper')
BEFORE
AFTER
Cluster
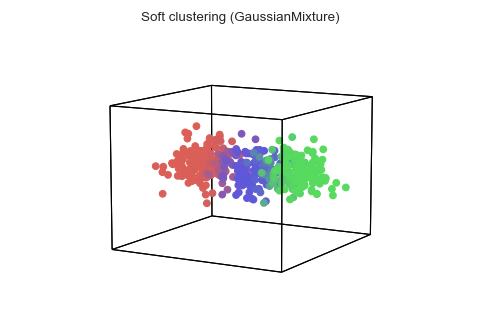
Soft ("mixture-model") clustering, new in 1.0 -- each point's color blends its component memberships:
import numpy as np
import hypertools as hyp

# three overlapping point clouds
rng = np.random.default_rng(0)
array = np.vstack([rng.standard_normal((100, 3)) + offset
                   for offset in ([0, 0, 0], [4, 0, 0], [0, 4, 0])])

hyp.plot(array, 'o', cluster='GaussianMixture', n_clusters=3)
Surfaces
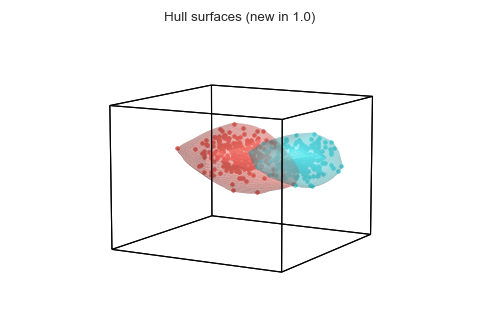
New in 1.0: overlay a smooth, lit surface over each dataset's convex hull:
import numpy as np
import hypertools as hyp

rng = np.random.default_rng(0)
blob_a = rng.standard_normal((100, 3))
blob_b = rng.standard_normal((100, 3)) + [4, 0, 0]

hyp.plot([blob_a, blob_b], '.', surface=True)
Describe
import numpy as np
import hypertools as hyp

rng = np.random.default_rng(0)
list_of_arrays = [np.cumsum(rng.standard_normal((200, 20)), axis=0)
                  for _ in range(3)]

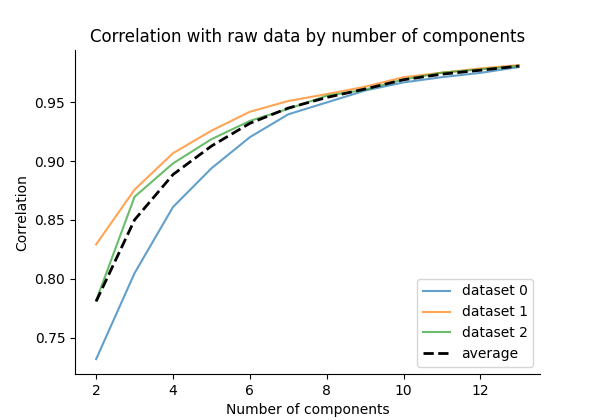
hyp.describe(list_of_arrays, reduce='PCA', max_dims=14)
1 maintainer

Metadata
1 maintainer
Release files for hypertools 1.1.0
For a detailed explanation of source distributions (sdists) and built distributions (wheels), please see the package formats documentation.
Source distribution (sdist)
| File | Size | Uploaded | |
|---|---|---|---|
| hypertools-1.1.0.tar.gz | 2.5 MB | Details |
Built distribution (wheel)
| File | Interpreter | ABI | Platform | Reset |
|---|---|---|---|---|
| hypertools-1.1.0-py3-none-any.whl | Python 3 | none | any | Details |
Total release size: 4.1 MB
Release files / hypertools-1.1.0.tar.gz
| Download URL | hypertools-1.1.0.tar.gz |
|---|---|
| Size | 2.5 MB |
| Tags | Source |
|
SHA-256 checksum How to use checksums |
054c783704a01086b4c0082bf2b58b128601076bfc7c910ea155b389c589a954
|
|
BLAKE2b-256 checksum How to use checksums |
d579aa4e2b5d60fcb04979756439b734b2e35f9774bed028b9164d37e2f8469d
|
| Upload date | |
|
Uploaded using Trusted Publishing? What is trusted publishing? |
No |
| Uploaded via |
twine/6.2.0 CPython/3.12.14
|
Release files / hypertools-1.1.0-py3-none-any.whl
| Download URL | hypertools-1.1.0-py3-none-any.whl |
|---|---|
| Size | 1.6 MB |
| Tags | Python 3 |
|
SHA-256 checksum How to use checksums |
38363bf5caf8bf5576d78d94524c6626202ebb0a7c4a0c6556c2a4187372bfab
|
|
BLAKE2b-256 checksum How to use checksums |
55cfc904354c5d1245eee745488b5ae978f2cdbc0d1868e858b0ca04944b130d
|
| Upload date | |
|
Uploaded using Trusted Publishing? What is trusted publishing? |
No |
| Uploaded via |
twine/6.2.0 CPython/3.12.14
|














