Ultra-high-performance data profiling natively for Ibis
Verified details
These details have been verified by PyPIProject links
GitHub Statistics
Maintainers

Project description

Ibis Profiling


An ultra-high-performance data profiling system built natively for Ibis.
Core Principle: Profiling as Query Compilation
Unlike traditional profiling tools (e.g., ydata-profiling) that load data into local memory (Pandas), Ibis Profiling treats profiling as a query planning problem.
It compiles dozens of statistical metrics into a minimal set of optimized SQL queries that execute directly in your remote backend (DuckDB, BigQuery, Snowflake, ClickHouse, etc.). This ensures that computation happens where the data lives, enabling the profiling of multi-billion row datasets in seconds rather than hours.
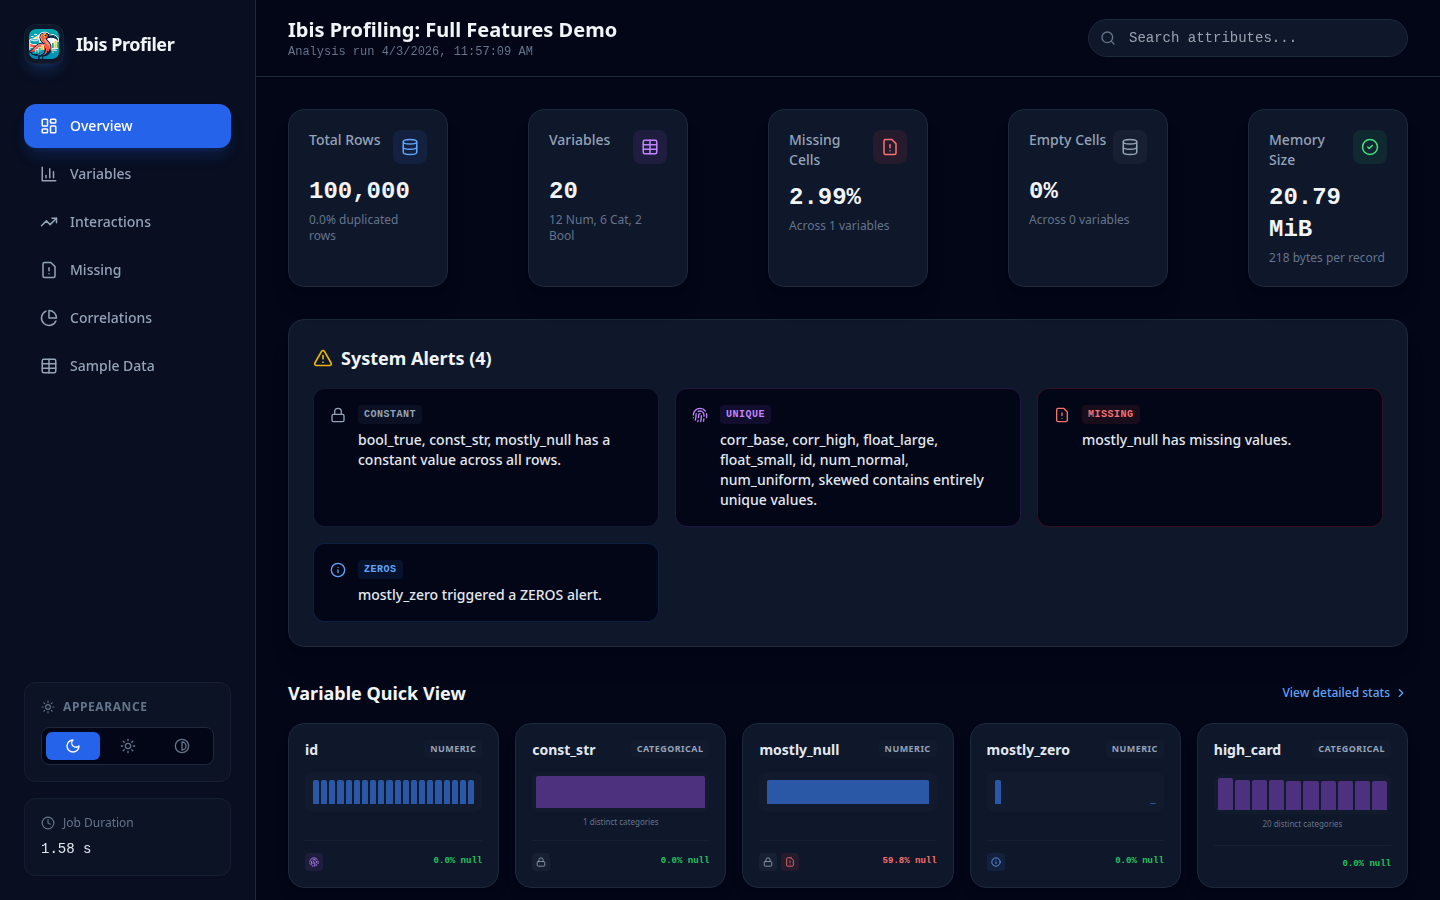
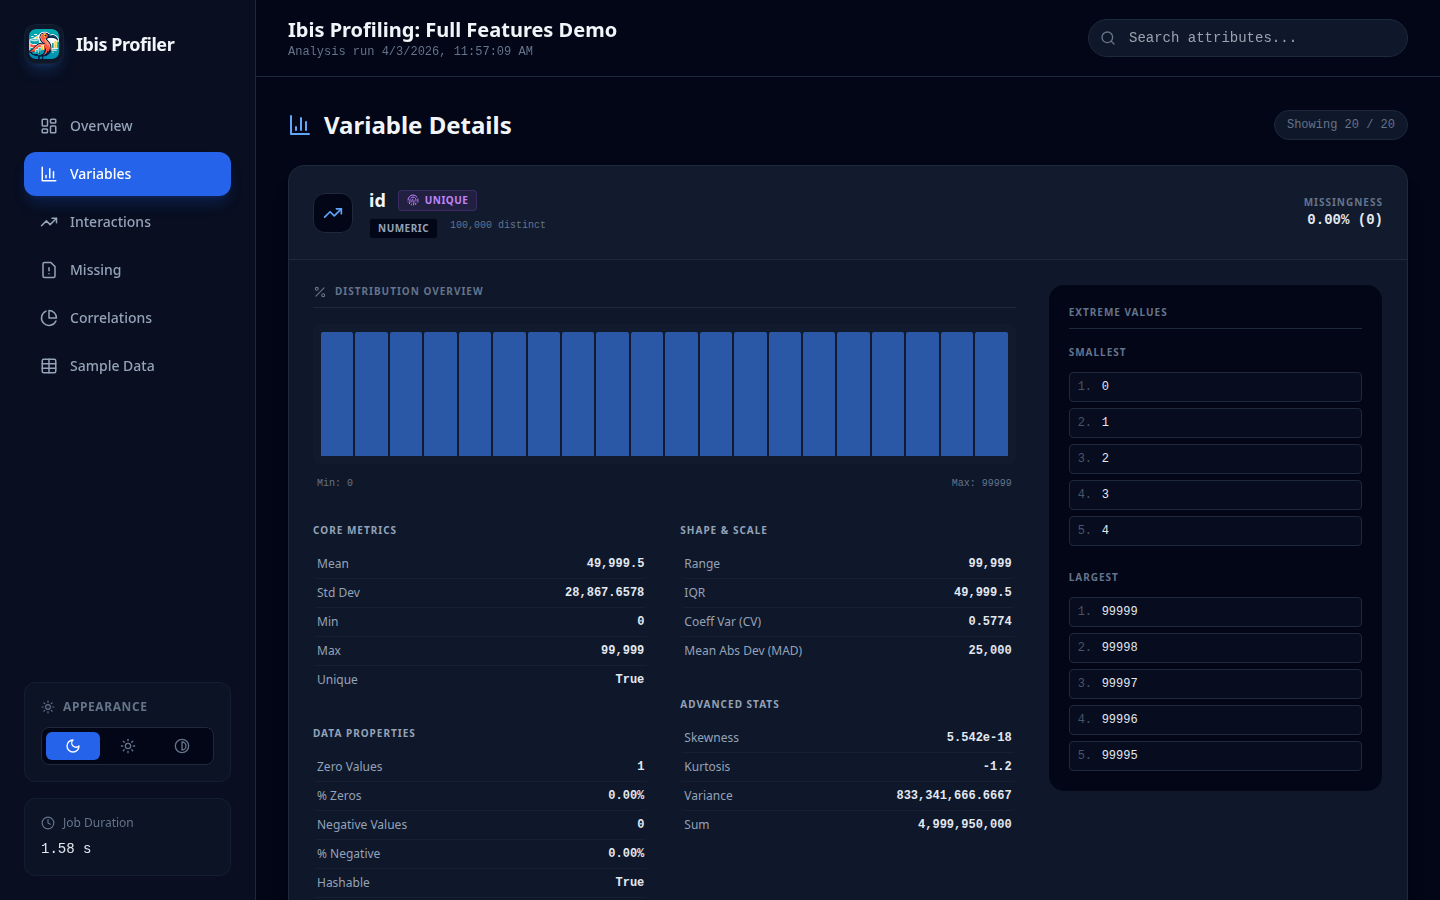
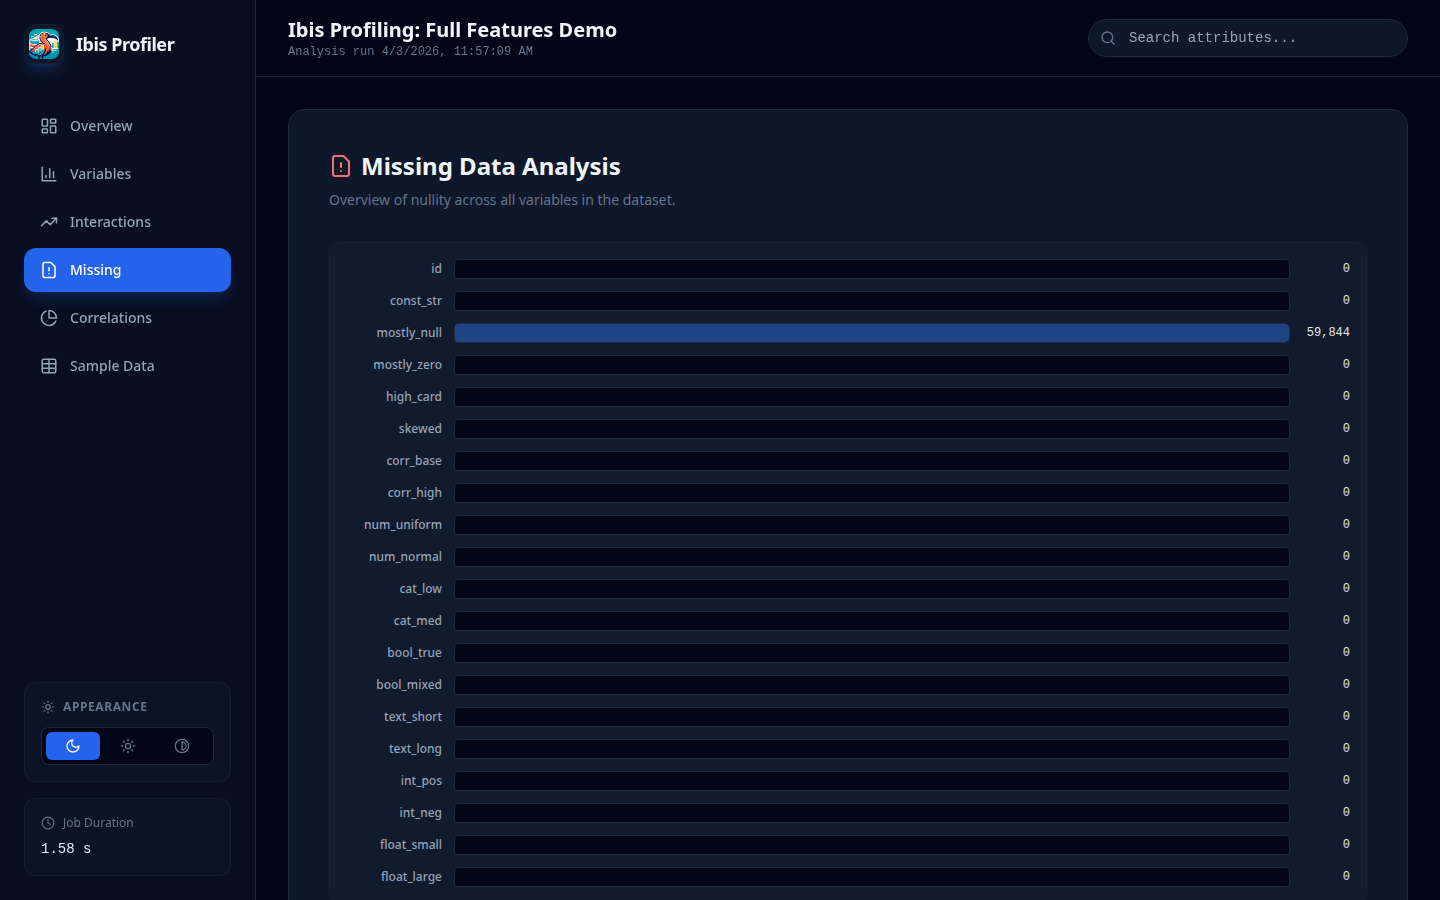
🖼️ Preview
Overview Dashboard
Variable Detail View
Missing Values Analysis
🚀 Key Features
- Backend Pushdown: 100% of the heavy lifting is done by the database engine.
- Multi-Pass Execution: Intelligently splits computation into optimized passes to handle complex moments (Skewness, MAD) without backend "nested aggregation" errors.
- JSON Schema Parity: Achieves full structural and statistical parity with
ydata-profiling, allowing drop-in replacement for downstream automated pipelines. - Modern SPA Report: Generates a lightweight Single Page Application (SPA) with a modern React-based UI.
- Adjustable Themes: Includes built-in support for Dark, Light, and High Contrast modes with persistent user settings.
- Auto-Categorical Detection: Intelligent heuristics automatically reclassify low-cardinality integers (e.g., status codes, term months) as categorical for better visualization.
- DateTime Distribution: Full support for temporal histograms and distribution analysis.
- Excel Support: Directly profile Excel files (.xlsx, .xls, .xlsb) using high-performance Rust-based parsing.
- Scalability: Profile 5 million rows in < 12 seconds (Minimal mode) and < 22 seconds (Full mode).
- Python Compatibility: Fully tested on Python 3.11 through 3.14.3 (Core functionality).
🛡️ Backend Stability & NaN Handling
A critical challenge in database-native profiling is the handling of NaN (Not-a-Number) values in floating-point columns. Traditional database aggregations (like STDDEV_SAMP in DuckDB) often throw OutOfRange errors when encountering NaNs.
Ibis Profiling implements a Safe-Aggregation layer that automatically treats NaN values as NULL during statistical computation. This ensures:
- Zero Crash Policy: Profiles complete successfully even on messy synthetic or sensor data.
- Mathematical Consistency: Statistics (mean, std, variance) are computed on the subset of valid numeric values, matching the behavior of high-level tools like Pandas while staying within the database.
📈 Performance Benchmarks
Benchmarks were conducted using a synthetic dataset with 20 columns (mix of numeric, categorical, text, and boolean) on a standard Linux environment using the DuckDB backend.
| Dataset Size | Ibis (Min) | Ibis (Full) | ydata (Min) | ydata (Full) | Mem Ibis (Min) | Mem ydata (Min) | Mem Ibis (Full) | Mem ydata (Full) |
|---|---|---|---|---|---|---|---|---|
| 10k Rows | 0.89s | 1.40s | 9.94s | 28.38s | ~2.4 MB | ~74 MB | ~4.5 MB | ~107 MB |
| 25k Rows | 1.03s | 1.57s | 12.20s | 30.47s | ~2.1 MB | ~154 MB | ~4.4 MB | ~188 MB |
| 50k Rows | 1.22s | 1.82s | 16.63s | 35.10s | ~2.0 MB | ~284 MB | ~4.4 MB | ~324 MB |
| 500k Rows | 2.29s | 3.56s | 91.93s | ~3m (est) | ~2.0 MB | ~2.5 GB | ~4.4 MB | ~2.8 GB (est) |
| 1M Rows | 3.14s | 5.44s | 166.31s | ~6m (est) | ~2.1 MB | ~4.9 GB | ~4.4 MB | ~5.3 GB (est) |
| 5M Rows | 10.69s | 17.88s | ~14m (est) | ~45m (est) | ~2.0 MB | >20 GB (est) | ~4.4 MB | >25 GB (est) |
| 10M Rows | 20.64s | 21.29s* | ~28m (est) | ~1.5h (est) | ~2.4 MB | >40 GB (est) | ~2.6 MB* | >50 GB (est) |
| 20M Rows | 43.98s | 8.77s** | >1h (est) | >3h (est) | ~2.4 MB | >80 GB (est) | ~1.0 MB** | >100 GB (est) |
*Notes:
- 10M Full (21.29s) used 10 columns.
- 20M Full (8.77s) used 5 columns.
- All other benchmarks use 20 columns.
- Ibis memory usage is nearly constant and extremely low compared to ydata-profiling due to database-native pushdown.*
🔍 Estimation Methodology
Projections for ydata-profiling on larger datasets are derived from observed scaling trends:
- Time (Minimal): Scaled linearly based on the jump from 500k (92s) to 1M (166s) rows.
- Time (Full): Scaled with a factor of ~2.5x - 3x over Minimal mode, consistent with small-sample ratios.
- Memory: Scaled linearly based on observed peak usage (~2.5 GB at 500k, ~4.9 GB at 1M), reflecting the overhead of loading the full dataset into Pandas DataFrames.
🛠 Installation
Install Ibis Profiling directly from PyPI:
Using uv (Recommended)
uv add ibis-profiling
Using pip
pip install ibis-profiling
💻 Usage
Command Line Interface (CLI)
You can profile datasets directly from the terminal without writing any Python code.
Basic Usage
# If installed locally
uv run ProfileReport --file-path data.csv --output report.html

# One-off run (no installation required)
uv run --with ibis-profiling,ibis-framework[duckdb] ProfileReport --file-path data.parquet
CLI Options
| Option | Shortcut | Description |
|---|---|---|
--file-path |
-f |
(Required) Path to input file (CSV, Parquet, Excel). |
--output |
-o |
Path to output file (default: report.html). |
--title |
-t |
Custom report title. |
--minimal |
Generate a minimal report (faster). | |
--theme |
Report theme: default or ydata-like. |
|
--format |
Force output format: html or json. |
|
--correlations |
Explicitly enable or disable correlations (--correlations / --no-correlations). |
|
--monotonicity |
Explicitly enable or disable monotonicity checks (--monotonicity / --no-monotonicity). |
|
--duplicates |
Explicitly enable or disable duplicate row checks (--duplicates / --no-duplicates). |
Quick Start (ydata-style API)
import ibis
from ibis_profiling import ProfileReport

# 1. Connect to any Ibis-supported backend
con = ibis.duckdb.connect()
table = con.read_parquet("large_dataset.parquet")

# 2. Generate the report with custom title
report = ProfileReport(table, title="Loan Analysis Report")

# 3. Export results
report.to_file("report.html")
⚙️ Advanced Configuration
Fine-tune the profiler's performance and behavior using additional parameters in ProfileReport():
| Parameter | Default | Description |
|---|---|---|
minimal |
False |
Enable faster profiling by skipping expensive metrics (correlations, interactions). |
parallel |
False |
Execute independent backend queries in parallel using a thread pool. (Experimental) |
pool_size |
4 |
Number of concurrent worker threads for parallel execution. |
max_interaction_pairs |
10 |
Limit pairwise scatter plots to the Top N most interactive numeric variables. |
correlations_sampling_threshold |
1,000,000 |
Row count threshold above which Spearman correlation uses sampling. |
correlations_sample_size |
1,000,000 |
Number of rows used when correlation sampling is active. |
correlations |
True |
Explicitly enable/disable all correlation matrices. |
monotonicity |
True |
Explicitly enable/disable monotonicity checks. |
compute_duplicates |
True |
Explicitly enable/disable duplicate row detection. |
🔍 Interaction Pruning & "Interactivity"
To maintain high performance and keep HTML reports lightweight, ibis-profiling uses an automated pruning strategy for pairwise scatter plots:
- Interactivity Definition: "Interactivity" is defined as the average absolute Pearson correlation of a column with all other numeric variables.
- Why are variables limited?: We determine the number of columns to include ($N$) by the requested
max_interaction_pairs(default 10). A limit of 10 variables results in up to 45 pairwise scatter plots ($10 \times 9 / 2 = 45$). - How are fields pruned?:
- Scoring: Every numeric column is assigned a score based on its average absolute correlation with others.
- Ranking: Columns are ranked by this score. High scores indicate variables that likely have the most meaningful relationships.
- Selection: Only the Top $N$ columns are kept. All other columns are pruned from the interactions pass to prevent massive HTML bloat and long compute times.
Excel Ingestion
from ibis_profiling import ProfileReport

# Directly profile Excel files with high-performance parsing
report = ProfileReport.from_excel("data.xlsx")
report.to_file("excel_report.html")
Advanced Usage
from ibis_profiling import profile

# Get the raw description dictionary
report = profile(table)
stats = report.to_dict()

print(f"Dataset Skewness: {stats['variables']['income']['skewness']}")
Minimal vs. Full Profiling
The ProfileReport supports a minimal flag (default False) to toggle between fast exploratory profiling and deep statistical analysis.
| Feature | Minimal Mode (minimal=True) |
Full Mode (minimal=False) |
|---|---|---|
| Core Stats | Count, Mean, Std, Min/Max, Zeros, Nullity. | All Minimal stats. |
| Table Metadata | Estimated Memory/Record Size. | Same as Minimal. |
| Advanced Moments | Skipped. | Skewness, Kurtosis, MAD. |
| Correlations | Skipped. | Pearson and Spearman matrices. |
| Advanced Analysis | Skipped. | Extreme Values, Monotonicity, Text Lengths. |
| Visualizations | Histograms (Numeric/DateTime), Summary only. | Nullity Matrix (SVG), Heatmap, Scatter Plots. |
| Duplicates | Skipped. | Dataset-wide duplicate row count. |
| Performance | Ultra-Fast. Recommended for datasets > 50M rows. | Detailed. Recommended for deep data quality audits. |
📦 Report Export & Layouts
By default, ibis-profiling minifies the generated HTML report to reduce file size (typically by 15-20%) without compromising functionality.
Custom Themes & Themes
The to_file method supports a theme parameter to choose between different report layouts:
# Modern React SPA (Default)
report.to_file("report.html", theme="default")

# Classic layout for ydata-profiling parity
report.to_file("report.html", theme="ydata-like")
Minification
To generate a human-readable (non-minified) report, set minify=False:
# Save as formatted HTML
report.to_file("report.html", minify=False)
🎨 Interactive React SPA
The default report is a fully interactive React Single Page Application (SPA) providing a modern user experience:
- Instant Search: Quickly filter variables by name or type.
- Theme Toggle: Switch between Dark, Light, and High Contrast modes with persistent settings.
- Alert Filtering: Interactive dashboard to filter data quality alerts by severity (Warning vs. Info).
- Responsive Charts: High-fidelity SVG and Canvas-based visualizations (Histograms, Heatmaps, Scatter Plots).
🏗 Architecture & Backend Support
The system is decoupled into five core modules designed for maximum backend compatibility:
- Dataset Inspector: Zero-execution schema analysis.
- Metric Registry: Declarative metric definitions as Ibis expressions.
- Query Planner: The "compiler" that batches compatible expressions into minimal execution plans.
- Execution Engine: Multi-pass dispatcher that handles simple vs. complex aggregations.
- Report Builder: Aggregates and formats raw backend results into high-fidelity JSON/HTML.
Supported Backends: 100% compatibility with all Ibis backends including DuckDB, Snowflake, BigQuery, ClickHouse, Postgres, Polars, and more.
📊 Missing Values Analysis
Move beyond simple counts with advanced pattern detection and visualization:
- Missing Matrix: A vertical sparkline grid (SVG) visualizing the exact location of missing values across rows, allowing you to spot temporal or structural gaps.
- Nullity Heatmap: Pearson correlation of "nullity" between variables, revealing structural dependencies (e.g., when Column A is missing, Column B is also 90% likely to be missing).
🔍 Pairwise Interactions
Explore dependencies between numeric variables with high-performance scatter plots:
- Automatic Selection: Intelligently samples the dataset to maintain 60FPS interactivity even with millions of rows.
- Correlation-Driven: Highlights pairs with high statistical significance to surface hidden patterns.
- Canvas-Optimized: Uses HTML5 Canvas for smooth rendering of thousands of data points directly in the browser.
📏 Metrics & Calculation Reference
1. Variable Calculations
The profiler uses a multi-pass execution engine to compute statistics efficiently across massive datasets while remaining compatible with SQL-based backends.
Core Statistics (Pass 1)
| Metric | Calculation | Type |
|---|---|---|
n |
Total number of observations (rows) in the table. | All |
n_missing |
Count of NULL or NaN values. |
All |
p_missing |
n_missing / n |
All |
n_distinct |
Count of unique values (excluding NULL). |
All |
mean |
sum(x) / count (NaNs treated as NULL) |
Numeric |
std |
Sample standard deviation (Bessel's correction). | Numeric |
min / max |
Minimum and maximum values. | Numeric, DateTime |
histogram |
Binned distribution (Numeric/DateTime) or Top Values (Categorical). | All |
Advanced Statistics (Pass 2)
To avoid "Nested Aggregation" errors in SQL backends, these are computed using values from Pass 1 as constants.
| Metric | Calculation | Logic |
|---|---|---|
skewness |
mean( ((x - μ) / σ)^3 ) |
Standardized 3rd moment. |
mad |
mean( abs(x - μ) ) |
Mean Absolute Deviation. |
n_duplicates |
n - count(distinct_rows) |
Dataset-wide duplicate row count. |
2. Alert Engine Logic
| Alert Type | Logic / Threshold | Severity |
|---|---|---|
| CONSTANT | n_distinct == 1 |
warning |
| UNIQUE | n_distinct == n |
warning |
| HIGH_CARDINALITY | p_distinct > 0.5 (Categorical only) |
warning |
| MISSING | p_missing > 0.05 |
info |
| ZEROS | p_zeros > 0.10 |
info |
| SKEWED | abs(skewness) > 10 |
info |
📄 License
Ibis Profiling is licensed under the MIT License. See LICENSE for details.
Project details
Verified details
These details have been verified by PyPIProject links
GitHub Statistics
Maintainers
Release history Release notifications | RSS feed


Download files
Download the file for your platform. If you're not sure which to choose, learn more about installing packages.
Source Distribution
Built Distribution
Filter files by name, interpreter, ABI, and platform.
If you're not sure about the file name format, learn more about wheel file names.
Copy a direct link to the current filters
File details
Details for the file ibis_profiling-0.1.7.tar.gz.
File metadata
- Download URL: ibis_profiling-0.1.7.tar.gz
- Upload date:
- Size: 802.6 kB
- Tags: Source
- Uploaded using Trusted Publishing? Yes
- Uploaded via: twine/6.1.0 CPython/3.13.7
File hashes
| Algorithm | Hash digest | |
|---|---|---|
| SHA256 |
ee67c83876babf618ba0832ee1fe400d9b135fea08fa8fb774d8fcdbe19034a7
|
|
| MD5 |
0c0b15fe65dc3c88fe867922432e6db9
|
|
| BLAKE2b-256 |
b58b1ad62d5edc92cfe85423fb9a39abd21c2d8b5077c1d4c96d315873ab9f14
|
Provenance
The following attestation bundles were made for ibis_profiling-0.1.7.tar.gz:
Publisher:
publish.yml on beallio/ibis-profiling
-
Statement:
-
Statement type:
https://in-toto.io/Statement/v1 -
Predicate type:
https://docs.pypi.org/attestations/publish/v1 -
Subject name:
ibis_profiling-0.1.7.tar.gz -
Subject digest:
ee67c83876babf618ba0832ee1fe400d9b135fea08fa8fb774d8fcdbe19034a7 - Sigstore transparency entry: 1156092597
- Sigstore integration time:
-
Permalink:
beallio/ibis-profiling@b476c37a20c6cdfbf4a6f22547f2a27a52696ce9 -
Branch / Tag:
refs/tags/v0.1.7 - Owner: https://github.com/beallio
-
Access:
public
-
Token Issuer:
https://token.actions.githubusercontent.com -
Runner Environment:
github-hosted -
Publication workflow:
publish.yml@b476c37a20c6cdfbf4a6f22547f2a27a52696ce9 -
Trigger Event:
push
-
Statement type:
File details
Details for the file ibis_profiling-0.1.7-py3-none-any.whl.
File metadata
- Download URL: ibis_profiling-0.1.7-py3-none-any.whl
- Upload date:
- Size: 808.0 kB
- Tags: Python 3
- Uploaded using Trusted Publishing? Yes
- Uploaded via: twine/6.1.0 CPython/3.13.7
File hashes
| Algorithm | Hash digest | |
|---|---|---|
| SHA256 |
e128c2172687db5faec9cad3790e0ec5a419d28fea0f01a849540b086005a50e
|
|
| MD5 |
1d3b3369ba958490cf1078087869bc7b
|
|
| BLAKE2b-256 |
52d67272f0e28a94d9ebcf9262d8f84c6f2d1cc15580675faa0d9599d45a2c53
|
Provenance
The following attestation bundles were made for ibis_profiling-0.1.7-py3-none-any.whl:
Publisher:
publish.yml on beallio/ibis-profiling
-
Statement:
-
Statement type:
https://in-toto.io/Statement/v1 -
Predicate type:
https://docs.pypi.org/attestations/publish/v1 -
Subject name:
ibis_profiling-0.1.7-py3-none-any.whl -
Subject digest:
e128c2172687db5faec9cad3790e0ec5a419d28fea0f01a849540b086005a50e - Sigstore transparency entry: 1156092631
- Sigstore integration time:
-
Permalink:
beallio/ibis-profiling@b476c37a20c6cdfbf4a6f22547f2a27a52696ce9 -
Branch / Tag:
refs/tags/v0.1.7 - Owner: https://github.com/beallio
-
Access:
public
-
Token Issuer:
https://token.actions.githubusercontent.com -
Runner Environment:
github-hosted -
Publication workflow:
publish.yml@b476c37a20c6cdfbf4a6f22547f2a27a52696ce9 -
Trigger Event:
push
-
Statement type:


