
icanexplain





Explain why metrics change by unpacking them
This library is here to help with the difficult task of explaining why a metric changes. It's particularly useful for analysts, data scientists, analytics engineers, and business intelligence professionals who need to understand the drivers of a metric's change.
This README provides a small introduction. For more information, please refer to the documentation.
Check out this blog post for some in-depth explanation.
Quickstart
Let's say you're an analyst at an Airbnb-like company. You're tasked with analyzing year-over-year revenue growth. You have obtained the following dataset:
>>> import pandas as pd
>>> fmt_currency = lambda x: '' if pd.isna(x) else '${:,.0f}'.format(x)

>>> revenue = pd.DataFrame.from_dict([
...     {'year': 2019, 'bookings': 1_000, 'revenue_per_booking': 200},
...     {'year': 2020, 'bookings': 1_000, 'revenue_per_booking': 220},
...     {'year': 2021, 'bookings': 1_500, 'revenue_per_booking': 220},
...     {'year': 2022, 'bookings': 1_700, 'revenue_per_booking': 225},
... ])
>>> (
...     revenue
...     .assign(bookings=revenue.bookings.apply('{:,d}'.format))
...     .assign(revenue_per_booking=revenue.revenue_per_booking.apply(fmt_currency))
...     .set_index('year')
... )
     bookings revenue_per_booking
year
2019    1,000                $200
2020    1,000                $220
2021    1,500                $220
2022    1,700                $225
It's quite straightforward to calculate the revenue for each year, and then to measure the year-over-year growth:
>>> (
...     revenue
...     .assign(revenue=revenue.eval('bookings * revenue_per_booking'))
...     .assign(growth=lambda x: x.revenue.diff())
...     .assign(bookings=revenue.bookings.apply('{:,d}'.format))
...     .assign(revenue_per_booking=revenue.revenue_per_booking.apply(fmt_currency))
...     .assign(revenue=lambda x: x.revenue.apply(fmt_currency))
...     .assign(growth=lambda x: x.growth.apply(fmt_currency))
...     .set_index('year')
... )
     bookings revenue_per_booking   revenue    growth
year
2019    1,000                $200  $200,000
2020    1,000                $220  $220,000   $20,000
2021    1,500                $220  $330,000  $110,000
2022    1,700                $225  $382,500   $52,500
Growth can be due to two factors: an increase in the number of bookings, or an increase in the revenue per booking. The icanexplain library to decompose the growth into these two factors. First, let's install the package:
pip install icanexplain
Then, we can use the SumExplainer to decompose the growth:
>>> import icanexplain as ice
>>> explainer = ice.SumExplainer(
...     fact='revenue_per_booking',
...     period='year',
...     count='bookings'
... )
>>> explanation = explainer(revenue)
>>> explanation.map(fmt_currency)
        inner       mix
year
2020  $20,000        $0
2021       $0  $110,000
2022   $7,500   $45,000
Here's how to interpret this explanation:
- From 2019 to 2020, the revenue growth was entirely due to an increase in the revenue per booking. The number of bookings was exactly the same. Therefore, the $20,000 is entirely due to the inner effect (increase in revenue per booking).
- From 2020 to 2021, the revenue growth was entirely due to an increase in the number of bookings. The revenue per booking was exactly the same. Therefore, the $110,000 is entirely due to the mix effect (increase in bookings).
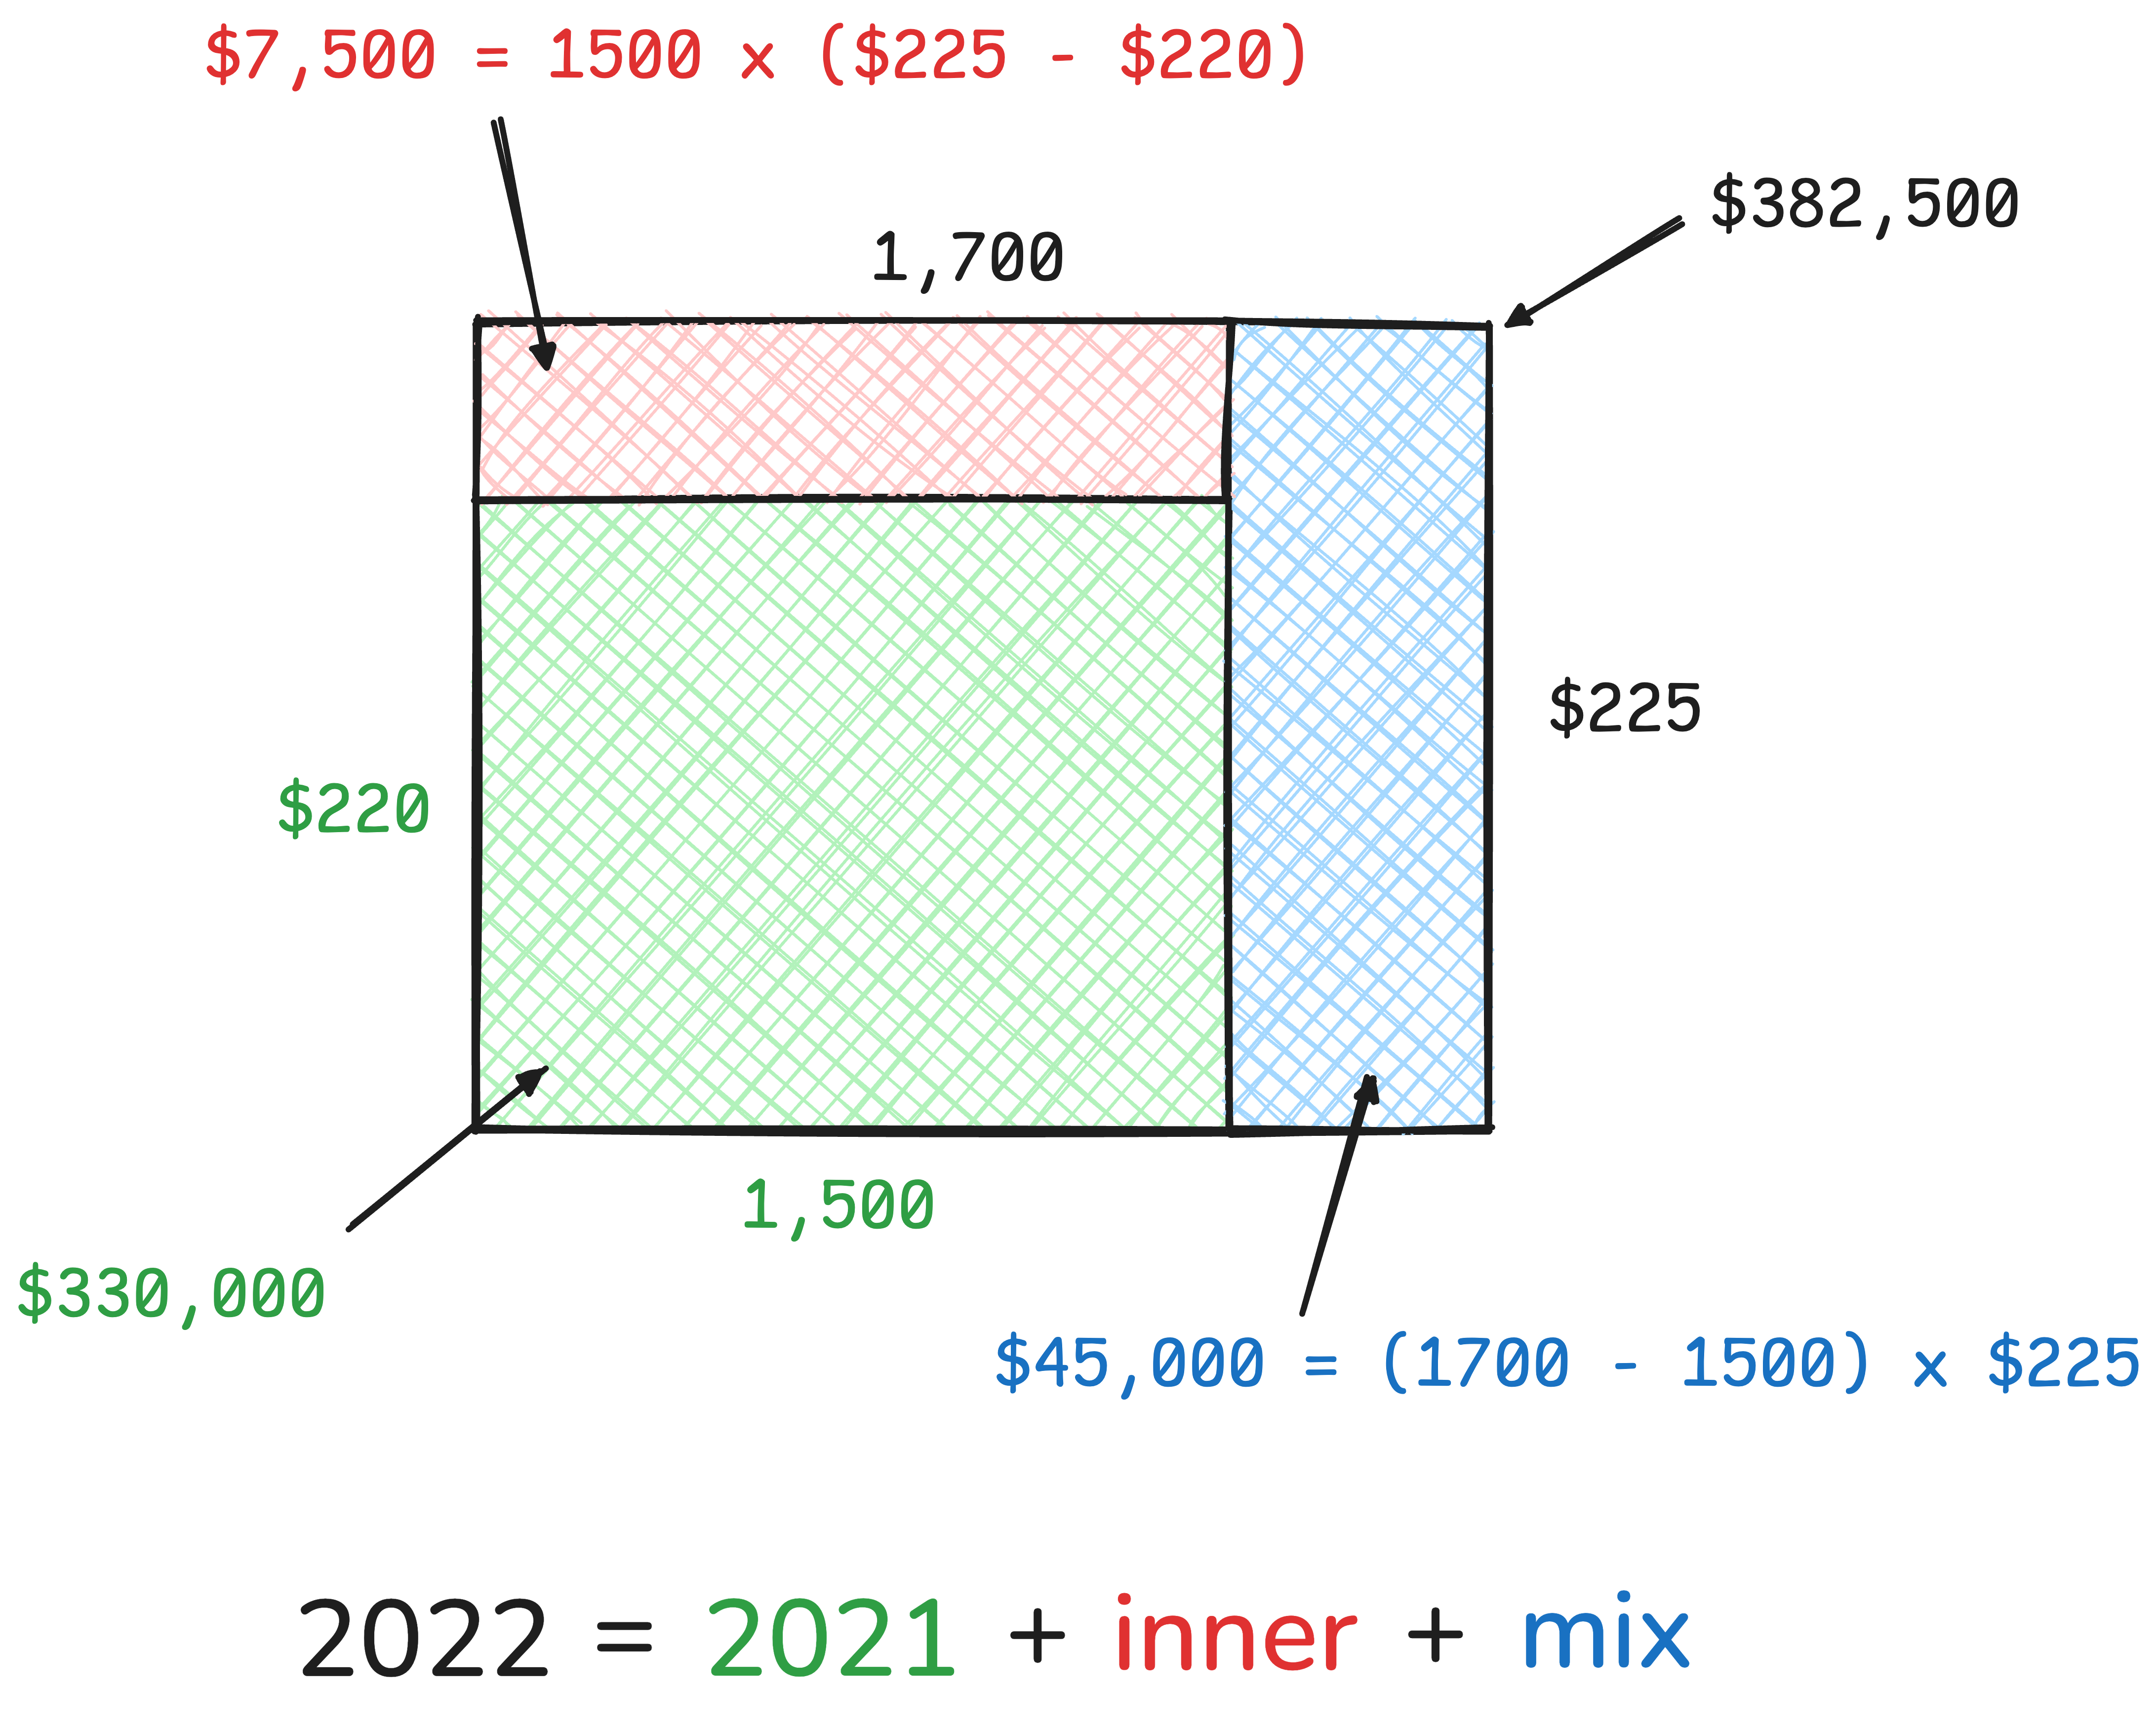
- From 2021 to 2022, there was a $52,500 revenue growth. However, the revenue per booking went down by $10, so the increase is due to the higher number of bookings. The inner effect is -$7,500 while the mix effect is $45,000.
Here's a visual representation of this last interpretation:
Contributing
Feel free to reach out to max@carbonfact.com if you want to know more and/or contribute 🤗
Check out the contribution guidelines to get started.
License
icanexplain is free and open-source software licensed under the Apache License, Version 2.0.
1 maintainer

Metadata
1 maintainer
Release files for icanexplain 0.3.0
For a detailed explanation of source distributions (sdists) and built distributions (wheels), please see the package formats documentation.
Source distribution (sdist)
| File | Size | Uploaded | |
|---|---|---|---|
| icanexplain-0.3.0.tar.gz | 2.4 MB | Details |
Built distribution (wheel)
| File | Interpreter | ABI | Platform | Reset |
|---|---|---|---|---|
| icanexplain-0.3.0-py3-none-any.whl | Python 3 | none | any | Details |
Total release size: 4.8 MB
Release files / icanexplain-0.3.0.tar.gz
| Download URL | icanexplain-0.3.0.tar.gz |
|---|---|
| Size | 2.4 MB |
| Tags | Source |
|
SHA-256 checksum How to use checksums |
1f6483b631cac9631b70738c2c80976e86422f5ddea0a8fad8207a503b4f3e72
|
|
BLAKE2b-256 checksum How to use checksums |
4fb2a9385967918b8f8db6c7c0643fbf10bbe599fa9e352d2c0fc96535bff010
|
| Upload date | |
|
Uploaded using Trusted Publishing? What is trusted publishing? |
No |
| Uploaded via |
poetry/1.8.3 CPython/3.11.4 Darwin/24.0.0
|
Release files / icanexplain-0.3.0-py3-none-any.whl
| Download URL | icanexplain-0.3.0-py3-none-any.whl |
|---|---|
| Size | 2.4 MB |
| Tags | Python 3 |
|
SHA-256 checksum How to use checksums |
18164992289c73fafcdbaa903f2b67c32826f8ae63bd34a29d8049b23713d58b
|
|
BLAKE2b-256 checksum How to use checksums |
ad923eee8b689f60a7c576ffa37ea9eb702fee94a57ff4a6b8f8f094f042ba96
|
| Upload date | |
|
Uploaded using Trusted Publishing? What is trusted publishing? |
No |
| Uploaded via |
poetry/1.8.3 CPython/3.11.4 Darwin/24.0.0
|














