Create interactive visualizations of model architectures for display in Jupyter notebooks

Project description
IDLMAV
Interactive deep learning model architecture visualization (IDLMAV) is a tool that creates interactive visualizations of model architectures for display in Jupyter notebooks.
- It does not require a successful forward pass: it can also visualize partial models
- It produces three outputs to allow a trade-off between portability and interactivity
- A portable figure that works on most environments and displays correctly without the need of a running backend/kernel, e.g. in nbviewer
- An interactive widget with synchronized scrolling and interactions between sub-plots
- Export to a standalone HTML file
Use cases
- Iteratively designing a model and viewing activations, parameter counts and FLOPS "so far" before the whole model has been defined
- Document a model in a notebook and generate the architecture in such a way that it is viewable on without a running kernel, e.g. in nbviewer
- Visualize 3rd party models when importing them into a notebook
- Scan a model for potential places to save parameters or FLOPS
Installation
pip install idlmav
Usage examples
Preparation
import torch, torchvision
from idlmav import MAV, plotly_renderer
device = 'cpu'
model = torchvision.models.resnet18().to(device)
x = torch.randn(16,3,160,160).to(device)
mav = MAV(model, x, device=device)
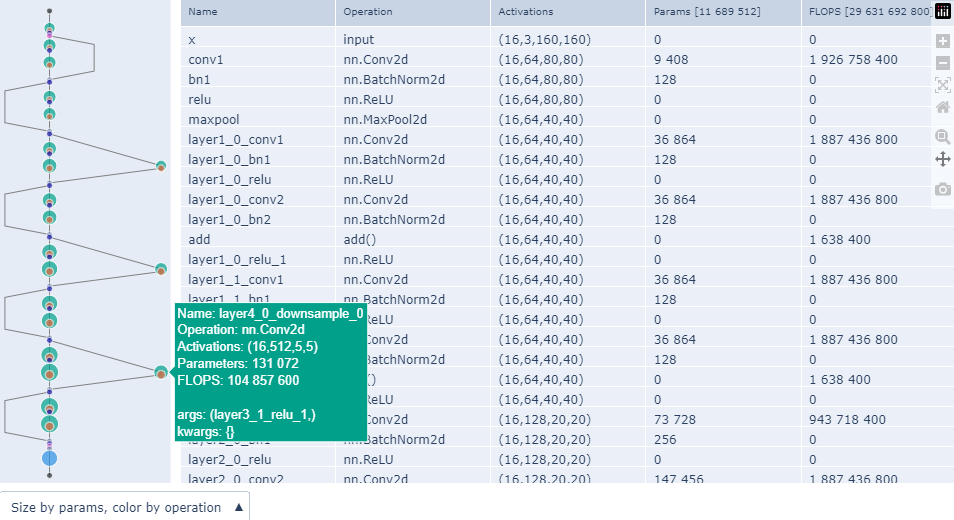
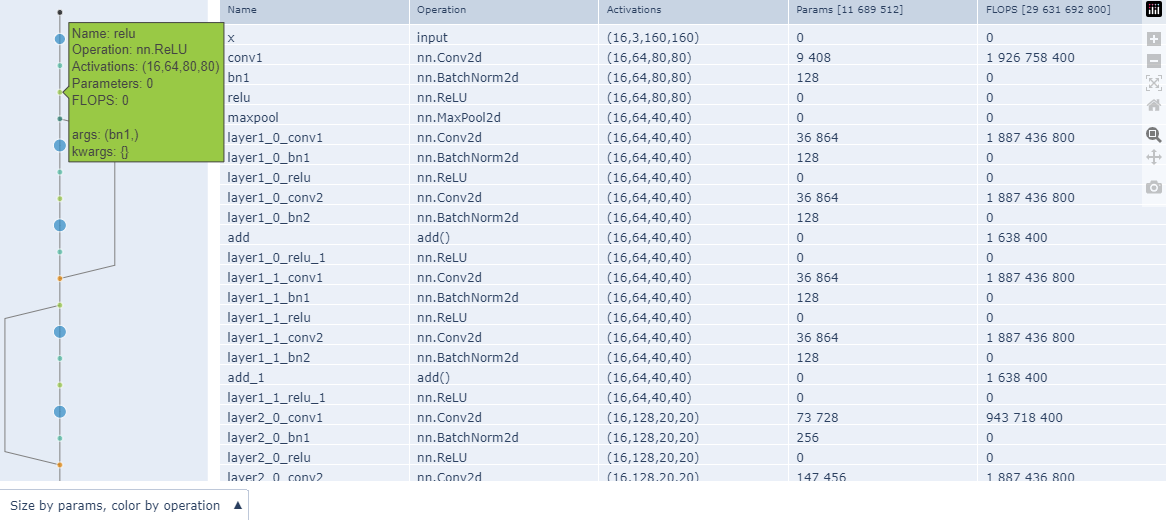
Portable figure
- Based on plotly.graph_objects.Figure
- No dependency on
ipywidgetsorplotly.graph_objects.FigureWidgetfor portability reasons - Displays correctly without the need of a running backend/kernel, e.g. in nbviewer
- Interactions limited to plotly's built-in hover, pan and zoom mechanisms
- No synchronization between graph and table
with plotly_renderer('notebook_connected'):
    mav.show_figure(add_slider=True)
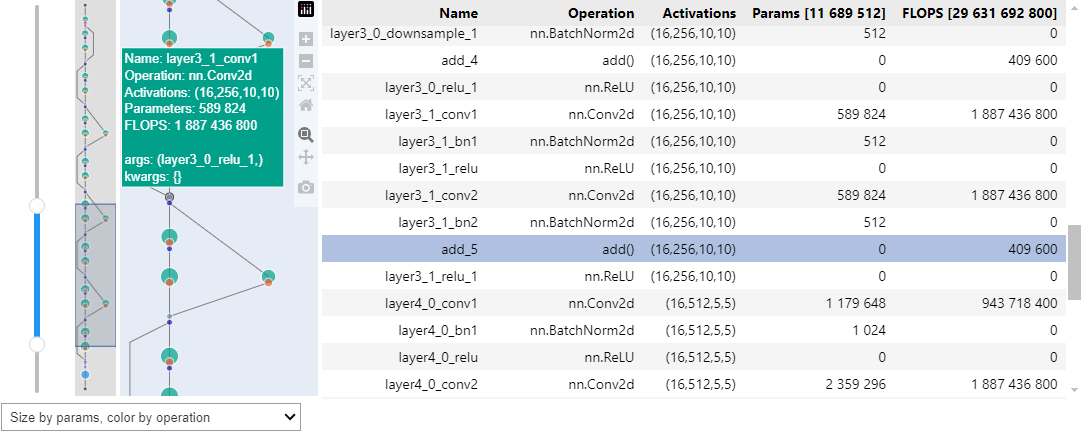
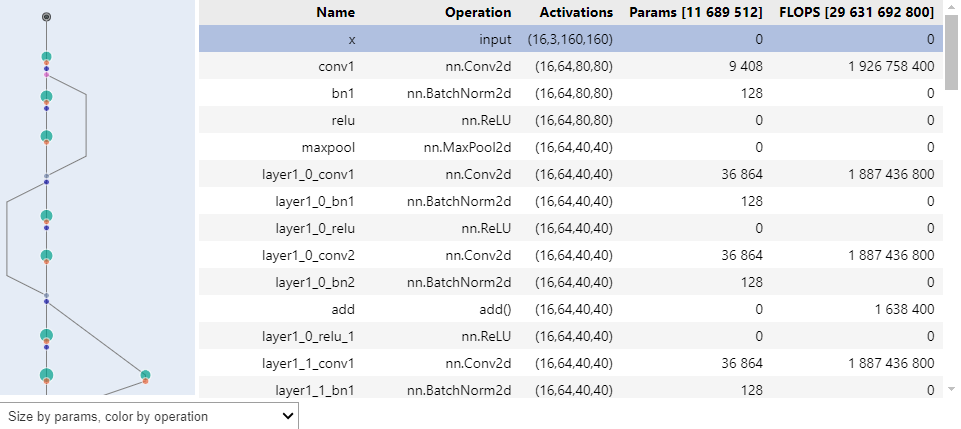
Interactive widget
- Based on ipywidgets and plotly.graph_objects.FigureWidget
- Synchronizaton between slider, overview panel, main graph and table
- Includes reactivity of other components to plotly's built-in pan and zoom actions
- Clicking a node in the main graph highlights it in the table
- Limited portability expected to fluctuate over time on different environments
with plotly_renderer('notebook_connected'):
    mav.show_widget(add_overview=True)
HTML export
- Most portable option
- Exports the same portable figure shown above to a standalone HTML file
- The
offlineparameter specifies how to include the plotly dependency in the exported HTMLFalse(default): The exported HTML is small, but requires a working internet connection to display correctlyTrue: The exported HTML is around 4MB in size and displays correctly without a working internet connection
mav.export_html('resnet18.html', offline=False)
Specifying colors
- Palettes from plotly discrete color sequences can be specified by name
- User-defined palettes can be specified as a list of
'#RRGGBB'formatted strings - The key to
fixed_color_mapmay be a string in the Operation column or a category as listed here
with plotly_renderer('notebook_connected'):
    mav.show_figure(
        palette='Vivid',
        avoid_palette_idxs=set([10]),
        fixed_color_map={'Convolution':7, 'add()':0, 'nn.MaxPool2d':5}
    )
Adding and removing panels
- This could help with portability or user experience on some environments, e.g.
- On Colab the slider gets more in the way rather than adding value
- The custom JS used for table synchronization may not be supported everywhere
with plotly_renderer('notebook_connected'):
    mav.show_widget(add_overview=False, add_slider=False, add_table=False)
Modifying merging behaviour
merge_threshold<0does not perform any mergingmerge_threshold==0only merges nodes that have zero parametersmerge_thresholdbetween 0 and 1 sorts nodes from the smallest to the largest by number of parameters and merges from the smallest node until just before the combined parameter count of merged nodes exceed the specified fraction of the total parameter count- The following nodes are never merged:
- Input and output nodes to the entire network
- Nodes with multiple input connections
- Nodes for which the input node has multiple output connections
- The default
merge_thresholdvalue normally results in nodes without parameters as well as normalization modules being merged
mav = MAV(model, x, device=device, merge_threshold=-1)
with plotly_renderer('notebook_connected'):
    mav.show_figure(
        palette='Vivid',
        avoid_palette_idxs=set([10]),
        fixed_color_map={'Convolution':7, 'add()':0, 'nn.MaxPool2d':5}
    )
Calling internal components directly
- For users that wish to replace or augment one or more components
- A typical example would be replacing or subclassing the renderer to work on a specific environment
from idlmav import MavTracer, merge_graph_nodes, layout_graph_nodes, color_graph_nodes, WidgetRenderer
from IPython.display import display

tracer = MavTracer(model, x, device)
merge_graph_nodes(tracer.g)
layout_graph_nodes(tracer.g)
color_graph_nodes(tracer.g)
renderer = WidgetRenderer(tracer.g)
display(renderer.render())
Features
- Works on incomplete models and models without a successful forward pass
- Can provide a portable figure with basic interactivity that does not require a running kernel
- Can provide an interactive widget with synchronization between panels
- Customizable color palette and node or category color mappings
- Customizable node merging behaviour
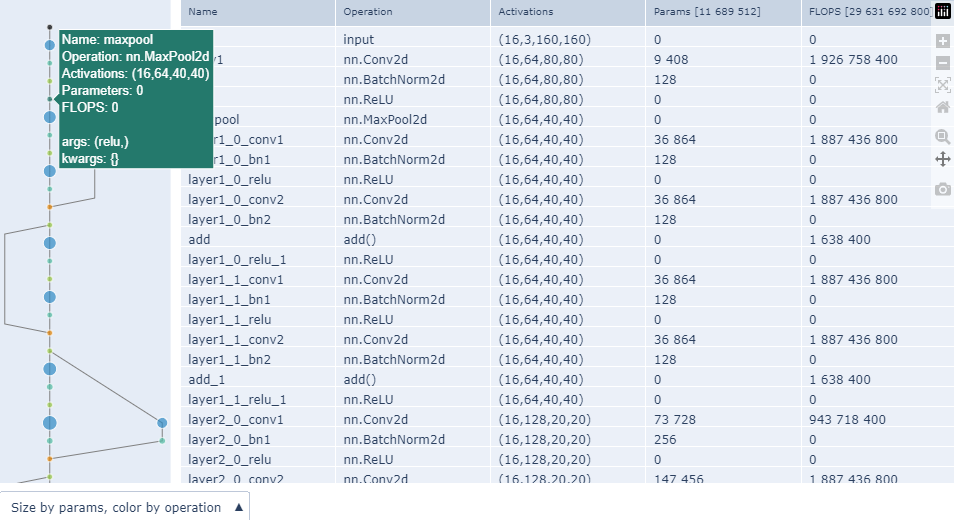
- Interactions (portable figure)
- Hover over modules to see activation sizes, number of parameters and FLOPS
- Scrollable table (not synchronized)
- Horizontal slider provided by Plotly (not synchronized)
- Pan and zoom provided by Plotly (not synchronized)
- Interactions (interactive widget)
- Hover over modules to see activation sizes, number of parameters and FLOPS
- Synchronized scrolling between table and graph
- Clicking on a module highlights that module in the table
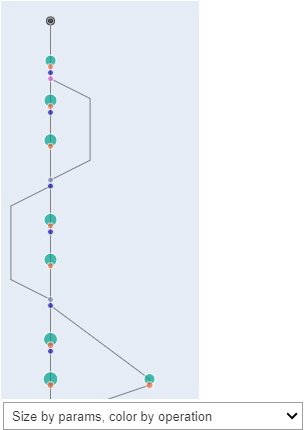
- Clickable overview window showing full model
- Range slider from ipywidgets with synchronized pan and zoom functionality
- Table and sliders synchronize with Plotly's built-in pan and zoom functionality
Limitations
- Inherited limitations of symbolic tracing from torch.fx
- Dynamic control flow
- Non-torch functions
- Inherited from ipywidgets:
- Interactive widget requires a running kernel to dynamically create DOM elements
- Portable figure has no synchronization between panels
- Inherited from plotly
- Portable figure can only support a horizontal slider
- Environment-specific limitations
- Kaggle currently (Dec 2024) seems to have trouble displaying
go.FigureWidget, so only the portable figure is available there
- Kaggle currently (Dec 2024) seems to have trouble displaying
Planned updates
- Make the primary direction (down/right/up/left) configurable
- Allow the user to specify a latent node at which the graph changes direction (e.g. for autoencoder / UNet architectures)
- Add drop-down boxes to dynamically toggle between coloring and sizing modes (e.g. color by node operation, number of parameters, FLOPS)
Contributing
Any contributions are welcome, but custom renderers to improve the user experience on specific platforms / environments will be especially appreciated!
- The development environment is described in setup_vscode_wsl.ipynb
- This should be easy to get going in native Linux as well, just skipping the WSL parts
- The build is described in and executed from build_steps.ipynb
- Unit tests still need to be developed. At the moment, the following notebooks are used for manual / visual testing:
License
This repository is released under the MIT license. See LICENSE for additional details.
Release history Release notifications | RSS feed


Download files
Download the file for your platform. If you're not sure which to choose, learn more about installing packages.
Source Distribution
Built Distribution
Filter files by name, interpreter, ABI, and platform.
If you're not sure about the file name format, learn more about wheel file names.
Copy a direct link to the current filters
File details
Details for the file idlmav-1.0.4.tar.gz.
File metadata
- Download URL: idlmav-1.0.4.tar.gz
- Upload date:
- Size: 34.5 kB
- Tags: Source
- Uploaded using Trusted Publishing? No
- Uploaded via: twine/6.0.1 CPython/3.10.12
File hashes
| Algorithm | Hash digest | |
|---|---|---|
| SHA256 |
ddc63a08493d4c758d2fc485d939c3a13c914ba9de26897c2298a8298884d234
|
|
| MD5 |
841d343a20f07d7c2a811245114798d2
|
|
| BLAKE2b-256 |
483708b58431e601b95865927db03832a1c572e71ac3da5e28b1b8dade76eaf1
|
File details
Details for the file idlmav-1.0.4-py3-none-any.whl.
File metadata
- Download URL: idlmav-1.0.4-py3-none-any.whl
- Upload date:
- Size: 36.6 kB
- Tags: Python 3
- Uploaded using Trusted Publishing? No
- Uploaded via: twine/6.0.1 CPython/3.10.12
File hashes
| Algorithm | Hash digest | |
|---|---|---|
| SHA256 |
456072e4b4f325b3129823b457c0343149132c0cc5339767d68752048e5d91a8
|
|
| MD5 |
fd4cd759e6e35c4e9f525ba37962faa1
|
|
| BLAKE2b-256 |
b5e1c453180da2e88df12cec7ee2c60f96c53e6b532544c6eba28a675bc3bbe3
|


