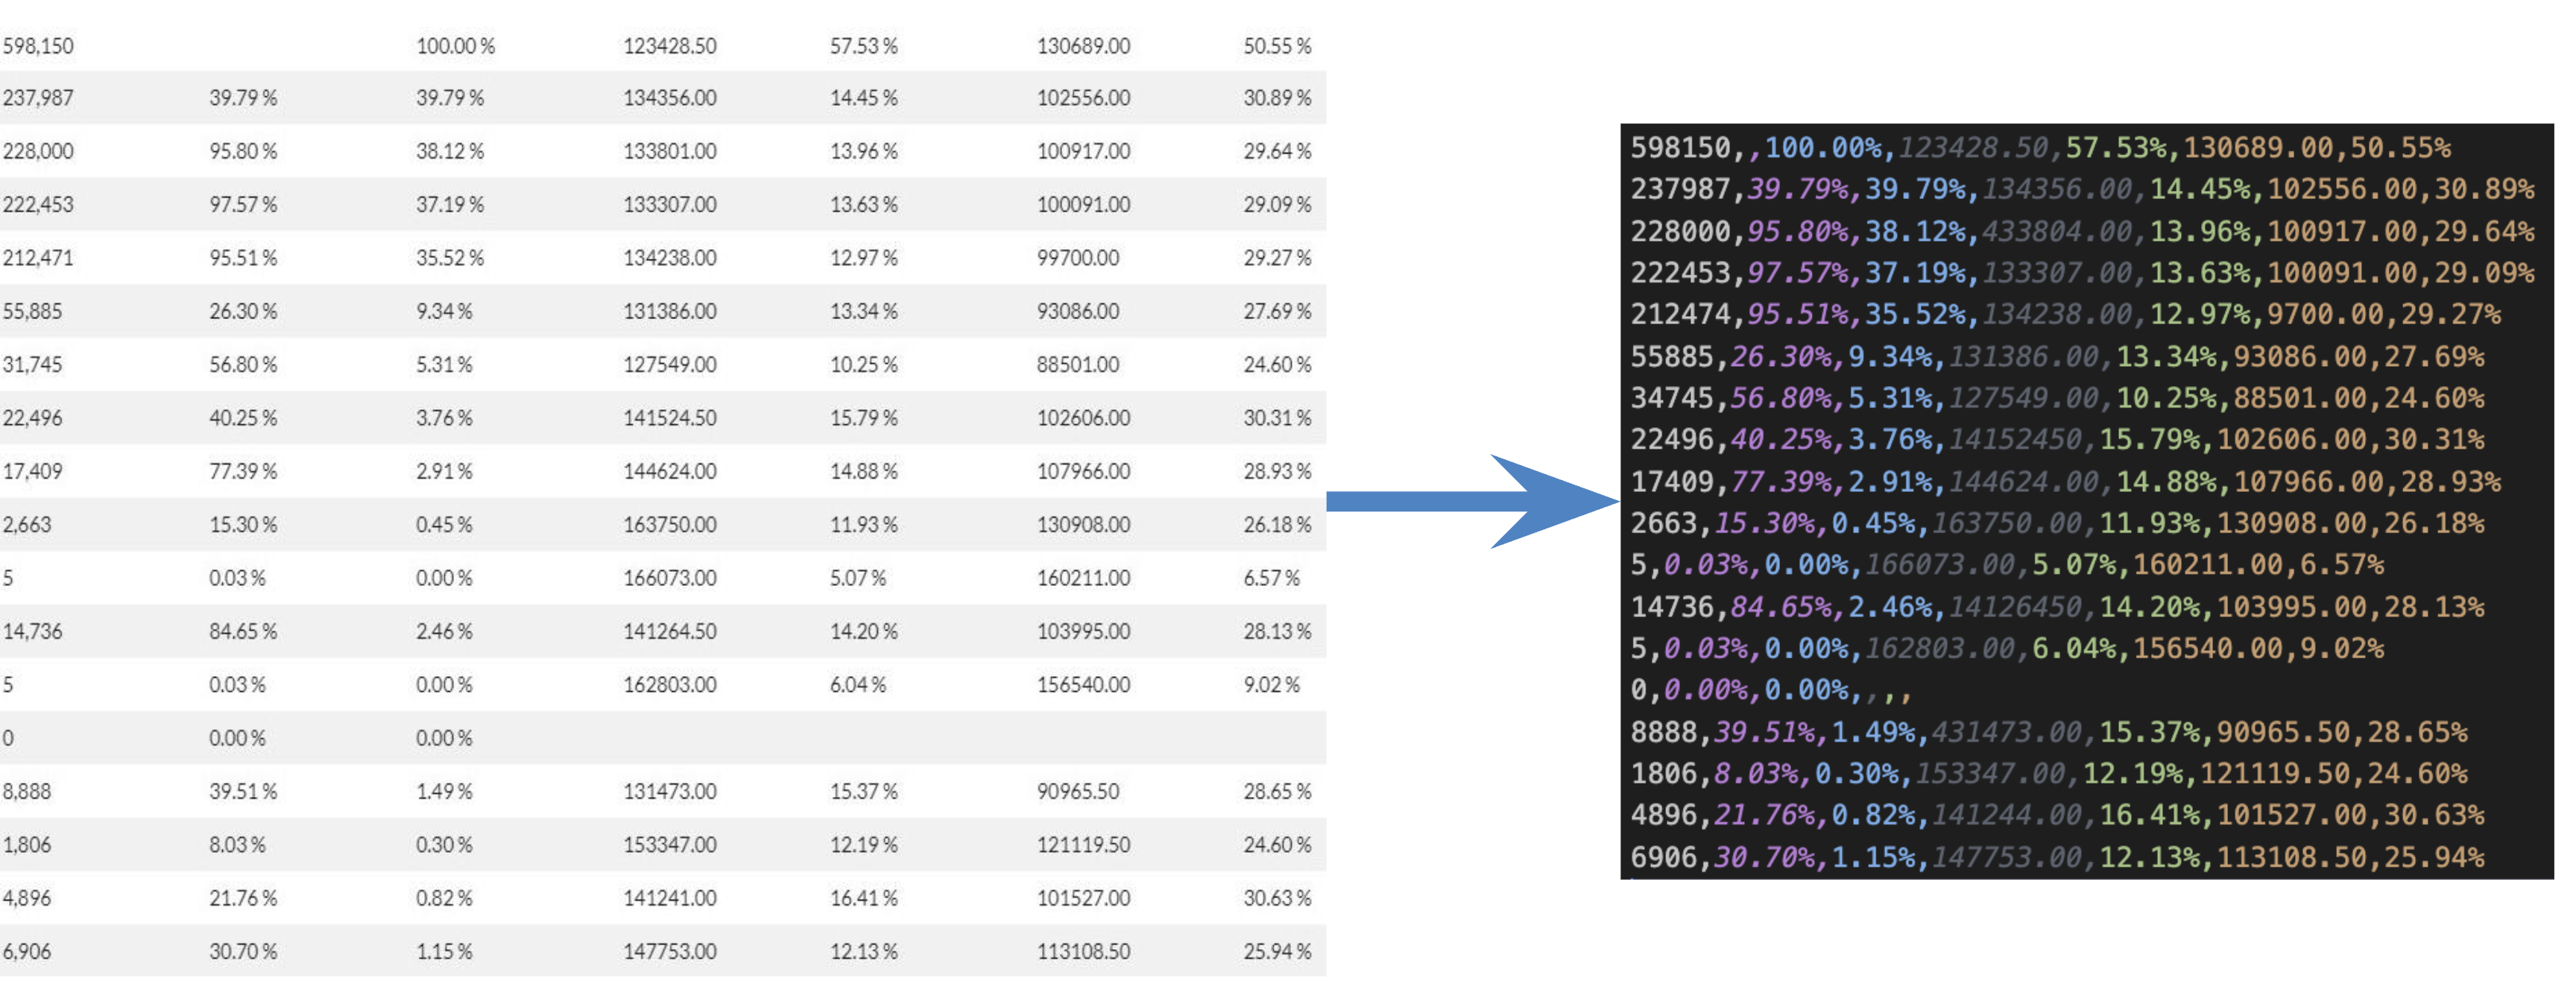
Converts An Image to a CSV. This exists because Chorus 3.0 are bat-shit and only show images for vital metadata.

Project description


About • Install • Terminal • Python • License
About
Converts an Image to a CSV. This exists because Chorus 3.0 is bat-shit and only shows images for vital metadata.
Prerequisites
Anaconda
I am partial towards miniforge, but you can replace these commands with your favorite conda distribution.
Windows Miniforge Installation
Special walkthrough for Windows users since Windows is awful.
curl -O https://github.com/conda-forge/miniforge/releases/latest/download/Miniforge3-Windows-x86_64.exe
start /wait "" Miniforge3-Windows-x86_64.exe /InstallationType=JustMe /RegisterPython=0 /S /D=%UserProfile%\Miniforge3
# Follow the prompts.
Bugs
Linux using Python 3.7
Conda does not install all needed packages for Python 3.7 so you need to install the following to get ImageToCSV to work properly.
sudo apt install --yes build-essential libpoppler-cpp-dev pkg-config tesseract-ocr libtesseract-dev
Installation
conda create -n imagetocsv -f environment.yml
conda activate imagetocsv
pip install imagetocsv
Development
Conda environment
conda create -n imagetocsv -f environment.yml
conda activate imagetocsv
pip install -e ".[dev]"
Testing
cd ImageToCSV
pytest -svvv tests
Preconfiguring Index/Column Names
If you have a lot of images to convert, you can preconfigure the index and column names to save time in the hardcoded_options.py file here. Each option will need a format of dict[str, tuple[str, list[str], list[str]]] aka slug -> (name, indexes, columns).
imagetocsv -p myslug myimage.png
Usage
Terminal Help Message
[CSV_PATH] means that it is a stdout (printed on the terminal) if output is not specified.
Usage: imagetocsv [OPTIONS] IMAGE_PATH [CSV_PATH]

  Console script for imagetocsv.

Options:
  --version                 Show the version and exit.
  -v, --verbose             Vebosity level, ex. -vvvvv for debug level logging
  -n, --index_name TEXT     Index Name for the CSV file
  -i, --index TEXT          Index for the CSV file
  -c, --column_header TEXT  Columns for the CSV file
  -p, --preconfigured-options TEXT

  --help                    Show this message and exit.
Terminal
# Convert an image to a CSV
imagetocsv myimage.png output.csv
# Convert an image to a stdout (printed on the terminal) TSV
imagetocsv myimage.png
| 0 | 1 | 2 | 3 | 4 | 5 | 6 | |
|---|---|---|---|---|---|---|---|
| 0 | 598150 | 100.00% | 123428.50 | 57.53% | 130689.00 | 50.55% | |
| 1 | 237987 | 39.79% | 39.79% | 134356.00 | 14.45% | 102556.00 | 30.89% |
| 2 | 228000 | 95.80% | 38.12% | 433804.00 | 13.96% | 100917.00 | 29.64% |
| 3 | 222453 | 97.57% | 37.19% | 133307.00 | 13.63% | 100091.00 | 29.09% |
| 4 | 212474 | 95.51% | 35.52% | 134238.00 | 12.97% | 9700.00 | 29.27% |
| 5 | 55885 | 26.30% | 9.34% | 131386.00 | 13.34% | 93086.00 | 27.69% |
| 6 | 34745 | 56.80% | 5.31% | 127549.00 | 10.25% | 88501.00 | 24.60% |
| 7 | 22496 | 40.25% | 3.76% | 14152450 | 15.79% | 102606.00 | 30.31% |
| 8 | 17409 | 77.39% | 2.91% | 144624.00 | 14.88% | 107966.00 | 28.93% |
| 9 | 2663 | 15.30% | 0.45% | 163750.00 | 11.93% | 130908.00 | 26.18% |
| 10 | 5 | 0.03% | 0.00% | 166073.00 | 5.07% | 160211.00 | 6.57% |
| 11 | 14736 | 84.65% | 2.46% | 14126450 | 14.20% | 103995.00 | 28.13% |
| 12 | 5 | 0.03% | 0.00% | 162803.00 | 6.04% | 156540.00 | 9.02% |
| 13 | 0 | 0.00% | 0.00% | ||||
| 14 | 8888 | 39.51% | 1.49% | 431473.00 | 15.37% | 90965.50 | 28.65% |
| 15 | 1806 | 8.03% | 0.30% | 153347.00 | 12.19% | 121119.50 | 24.60% |
| 16 | 4896 | 21.76% | 0.82% | 141244.00 | 16.41% | 101527.00 | 30.63% |
| 17 | 6906 | 30.70% | 1.15% | 147753.00 | 12.13% | 113108.50 | 25.94% |
# Used for Chorus 3.0 to auto header and index names.
imagetocsv -p chorus myimage.png
| Population | Events | % Parent | % Total | FSC-A Median | FSC-A %rCV | SSC-A Median | SSC-A %rCV |
|---|---|---|---|---|---|---|---|
| All Events | 598,150 | 100.00% | 123428.50 | 57.53% | 130689.00 | 50.55% | |
| Lymphocytes | 237,987 | 39.79% | 39.79% | 134356.00 | 14.45% | 102556.00 | 30.89% |
| Single cells... | 228,000 | 95.80% | 38.12% | 433804.00 | 13.96% | 100917.00 | 29.64% |
| Single cells... | 222,453 | 97.57% | 37.19% | 133307.00 | 13.63% | 100091.00 | 29.09% |
| Live/Dead | 212,474 | 95.51% | 35.52% | 134238.00 | 12.97% | 9700.00 | 29.27% |
| CD19+ Dump- | 55,885 | 26.30% | 9.34% | 131386.00 | 13.34% | 93086.00 | 27.69% |
| Naive gD+ | 34,745 | 56.80% | 5.31% | 127549.00 | 10.25% | 88501.00 | 24.60% |
| Memory IgD- | 22,496 | 40.25% | 3.76% | 14152450 | 15.79% | 102606.00 | 30.31% |
| IgD- KO- | 17,409 | 77.39% | 2.91% | 144624.00 | 14.88% | 107966.00 | 28.93% |
| P15-1 | 2,663 | 15.30% | 0.45% | 163750.00 | 11.93% | 130908.00 | 26.18% |
| P15-2 | 5 | 0.03% | 0.00% | 166073.00 | 5.07% | 160211.00 | 6.57% |
| P15-3 | 14,736 | 84.65% | 2.46% | 14126450 | 14.20% | 103995.00 | 28.13% |
| P15-4 | 5 | 0.03% | 0.00% | 162803.00 | 6.04% | 156540.00 | 9.02% |
| MARIO WT++ | 0 | 0.00% | 0.00% | ||||
| P14-1 | 8,888 | 39.51% | 1.49% | 431473.00 | 15.37% | 90965.50 | 28.65% |
| P14-2 | 1,806 | 8.03% | 0.30% | 153347.00 | 12.19% | 121119.50 | 24.60% |
| P14-3 | 4896 | 21.76% | 0.82% | 141244.00 | 16.41% | 101527.00 | 30.63% |
| P14-4 | 6,906 | 30.70% | 1.15% | 147753.00 | 12.13% | 113108.50 | 25.94% |
Terminal Advanced
Adding Index Name, Index, and Column Header. They need to match the deminsions of the matrix! This may be more trouble than its worth so, this is just to show you can do it. No pressure.
imagetocsv myimage.jpg \
  --index_name "Population" \
  --index "All Events,Lymphocytes,Single cells...,Single cells...,Live/Dead,CD19+ Dump-,Naive gD+,Memory IgD-,IgD- KO-,P15-1,P15-2,P15-3,P15-4,MARIO WT++,P14-1,P14-2,P14-3,P14-4" \
  --column_header "Events,%Parent,%Total,FSC-A Median,FSC-A %rCV,SSC-A Median,SSC-A %rCV"
| Population | Events | % Parent | % Total | FSC-A Median | FSC-A %rCV | SSC-A Median | SSC-A %rCV |
|---|---|---|---|---|---|---|---|
| All Events | 598,150 | 100.00% | 123428.50 | 57.53% | 130689.00 | 50.55% | |
| Lymphocytes | 237,987 | 39.79% | 39.79% | 134356.00 | 14.45% | 102556.00 | 30.89% |
| Single cells... | 228,000 | 95.80% | 38.12% | 433804.00 | 13.96% | 100917.00 | 29.64% |
| Single cells... | 222,453 | 97.57% | 37.19% | 133307.00 | 13.63% | 100091.00 | 29.09% |
| Live/Dead | 212,474 | 95.51% | 35.52% | 134238.00 | 12.97% | 9700.00 | 29.27% |
| CD19+ Dump- | 55,885 | 26.30% | 9.34% | 131386.00 | 13.34% | 93086.00 | 27.69% |
| Naive gD+ | 34,745 | 56.80% | 5.31% | 127549.00 | 10.25% | 88501.00 | 24.60% |
| Memory IgD- | 22,496 | 40.25% | 3.76% | 14152450 | 15.79% | 102606.00 | 30.31% |
| IgD- KO- | 17,409 | 77.39% | 2.91% | 144624.00 | 14.88% | 107966.00 | 28.93% |
| P15-1 | 2,663 | 15.30% | 0.45% | 163750.00 | 11.93% | 130908.00 | 26.18% |
| P15-2 | 5 | 0.03% | 0.00% | 166073.00 | 5.07% | 160211.00 | 6.57% |
| P15-3 | 14,736 | 84.65% | 2.46% | 14126450 | 14.20% | 103995.00 | 28.13% |
| P15-4 | 5 | 0.03% | 0.00% | 162803.00 | 6.04% | 156540.00 | 9.02% |
| MARIO WT++ | 0 | 0.00% | 0.00% | ||||
| P14-1 | 8,888 | 39.51% | 1.49% | 431473.00 | 15.37% | 90965.50 | 28.65% |
| P14-2 | 1,806 | 8.03% | 0.30% | 153347.00 | 12.19% | 121119.50 | 24.60% |
| P14-3 | 4896 | 21.76% | 0.82% | 141244.00 | 16.41% | 101527.00 | 30.63% |
| P14-4 | 6,906 | 30.70% | 1.15% | 147753.00 | 12.13% | 113108.50 | 25.94% |
Python
from imagetocsv import imagetocsv
from imagetocsv.examples import no_grid_example


df = imagetocsv(no_grid_example)
print(df.to_markdown())
| 0 | 1 | 2 | 3 | 4 | 5 | 6 | |
|---|---|---|---|---|---|---|---|
| 0 | 598150 | 100.00% | 123428.50 | 57.53% | 130689.00 | 50.55% | |
| 1 | 237987 | 39.79% | 39.79% | 134356.00 | 14.45% | 102556.00 | 30.89% |
| 2 | 228000 | 95.80% | 38.12% | 433804.00 | 13.96% | 100917.00 | 29.64% |
| 3 | 222453 | 97.57% | 37.19% | 133307.00 | 13.63% | 100091.00 | 29.09% |
| 4 | 212474 | 95.51% | 35.52% | 134238.00 | 12.97% | 9700.00 | 29.27% |
| 5 | 55885 | 26.30% | 9.34% | 131386.00 | 13.34% | 93086.00 | 27.69% |
| 6 | 34745 | 56.80% | 5.31% | 127549.00 | 10.25% | 88501.00 | 24.60% |
| 7 | 22496 | 40.25% | 3.76% | 14152450 | 15.79% | 102606.00 | 30.31% |
| 8 | 17409 | 77.39% | 2.91% | 144624.00 | 14.88% | 107966.00 | 28.93% |
| 9 | 2663 | 15.30% | 0.45% | 163750.00 | 11.93% | 130908.00 | 26.18% |
| 10 | 5 | 0.03% | 0.00% | 166073.00 | 5.07% | 160211.00 | 6.57% |
| 11 | 14736 | 84.65% | 2.46% | 14126450 | 14.20% | 103995.00 | 28.13% |
| 12 | 5 | 0.03% | 0.00% | 162803.00 | 6.04% | 156540.00 | 9.02% |
| 13 | 0 | 0.00% | 0.00% | ||||
| 14 | 8888 | 39.51% | 1.49% | 431473.00 | 15.37% | 90965.50 | 28.65% |
| 15 | 1806 | 8.03% | 0.30% | 153347.00 | 12.19% | 121119.50 | 24.60% |
| 16 | 4896 | 21.76% | 0.82% | 141244.00 | 16.41% | 101527.00 | 30.63% |
| 17 | 6906 | 30.70% | 1.15% | 147753.00 | 12.13% | 113108.50 | 25.94% |
Python Advanced
from imagetocsv import imagetocsv
from imagetocsv.examples import no_grid_example


df = imagetocsv(
        no_grid_example,
        index_name="Population",
        index=[
                "All Events",
                "Lymphocytes",
                "Single cells...",
                "Single cells...",
                "Live/Dead",
                "CD19+ Dump-",
                "Naive gD+",
                "Memory IgD-",
                "IgD- KO-",
                "P15-1",
                "P15-2",
                "P15-3",
                "P15-4",
                "MARIO WT++",
                "P14-1",
                "P14-2",
                "P14-3",
                "P14-4",
        ],
        column_header=["Events", "% Parent", "% Total", "FSC-A Median", "FSC-A %rCV", "SSC-A Median", "SSC-A %rCV"],
)
print(df.to_markdown())
| Population | Events | % Parent | % Total | FSC-A Median | FSC-A %rCV | SSC-A Median | SSC-A %rCV |
|---|---|---|---|---|---|---|---|
| All Events | 598,150 | 100.00% | 123428.50 | 57.53% | 130689.00 | 50.55% | |
| Lymphocytes | 237,987 | 39.79% | 39.79% | 134356.00 | 14.45% | 102556.00 | 30.89% |
| Single cells... | 228,000 | 95.80% | 38.12% | 433804.00 | 13.96% | 100917.00 | 29.64% |
| Single cells... | 222,453 | 97.57% | 37.19% | 133307.00 | 13.63% | 100091.00 | 29.09% |
| Live/Dead | 212,474 | 95.51% | 35.52% | 134238.00 | 12.97% | 9700.00 | 29.27% |
| CD19+ Dump- | 55,885 | 26.30% | 9.34% | 131386.00 | 13.34% | 93086.00 | 27.69% |
| Naive gD+ | 34,745 | 56.80% | 5.31% | 127549.00 | 10.25% | 88501.00 | 24.60% |
| Memory IgD- | 22,496 | 40.25% | 3.76% | 14152450 | 15.79% | 102606.00 | 30.31% |
| IgD- KO- | 17,409 | 77.39% | 2.91% | 144624.00 | 14.88% | 107966.00 | 28.93% |
| P15-1 | 2,663 | 15.30% | 0.45% | 163750.00 | 11.93% | 130908.00 | 26.18% |
| P15-2 | 5 | 0.03% | 0.00% | 166073.00 | 5.07% | 160211.00 | 6.57% |
| P15-3 | 14,736 | 84.65% | 2.46% | 14126450 | 14.20% | 103995.00 | 28.13% |
| P15-4 | 5 | 0.03% | 0.00% | 162803.00 | 6.04% | 156540.00 | 9.02% |
| MARIO WT++ | 0 | 0.00% | 0.00% | ||||
| P14-1 | 8,888 | 39.51% | 1.49% | 431473.00 | 15.37% | 90965.50 | 28.65% |
| P14-2 | 1,806 | 8.03% | 0.30% | 153347.00 | 12.19% | 121119.50 | 24.60% |
| P14-3 | 4896 | 21.76% | 0.82% | 141244.00 | 16.41% | 101527.00 | 30.63% |
| P14-4 | 6,906 | 30.70% | 1.15% | 147753.00 | 12.13% | 113108.50 | 25.94% |
License

- Copyright © Troy M. Sincomb


Download files
Download the file for your platform. If you're not sure which to choose, learn more about installing packages.
Source Distributions
Built Distribution
Filter files by name, interpreter, ABI, and platform.
If you're not sure about the file name format, learn more about wheel file names.
Copy a direct link to the current filters
File details
Details for the file imagetocsv-1.0.0-py3-none-any.whl.
File metadata
- Download URL: imagetocsv-1.0.0-py3-none-any.whl
- Upload date:
- Size: 12.6 kB
- Tags: Python 3
- Uploaded using Trusted Publishing? No
- Uploaded via: twine/4.0.2 CPython/3.11.4
File hashes
| Algorithm | Hash digest | |
|---|---|---|
| SHA256 |
6b9036adc59592843919e2d0f234a02a4cdd77da99e4fcb6be675c019b10b49f
|
|
| MD5 |
8f8b9133630fc82279533236e12d3f47
|
|
| BLAKE2b-256 |
7f2426b04485ec74f102d33c98f553e6697375d984c3e5175819f81e34a42071
|


