Manage your investments like a data scientist

Project description
Personal Investments Dashboard
Personal web application to manage a diverse investment portfolio in multiple currencies, including crypto and market indexes. Delivered as a Streamlit app. Includes also a module to hack your investments in Jupyter notebooks.

Dashboards reads your ledger and balances from an online Google Spreadsheet (see example), gets historical benchmarks and currency convertion tables from multiple configurabe internet sources, and created a rich explorable dashboard.
All or some or each of your investments are internally normalized into a single “fund” with number of shares and share value. From there, multiple visualizations are possible.
Install and Run
Runs on macOS, Windows, Linux or anywhere Python, Pandas and Streamlit can be installed. Here is a video I put in place that shows Investorzilla getting installed on a Mac and run for the first time with its example portfolio file.
Install
After getting Python 3 installed, install Investorzilla with pip:
pip install investorzilla --user
Configure
Create a folder and then build your investorzilla.yaml file with information about data sources, benchmarks and currencies.
Start with the examples from https://github.com/avibrazil/investorzilla/blob/main/config_examples/
Run
After installing your API keys (in case of using CryptoCompare data), run it like the following from the same folder containing investorzilla.yaml:
investorzilla
Access the dashboard on http://localhost:8501 (or remotelly if your browser is in a different machine)
Features
Virtual Funds
Create a unified virtual fund with only some of the investments found in your portfolio spreadsheet.

Your whole porfolio will be used if left balnk. Then you might exclude some to match the particular visualization you are trying to attain.
Currency and Benchmarks
You may track your investments using multiple currencies, inluding crypto. I have investments in USD and BRL. You can create virtual funds that mix different currencies, in this case you must select a currency under which you’ll view that (virtual) fund. Values from your spreadsheet will be converted to the target currency on a daily basis.
Also, you might compare your investment performance with market benchmarks as S&P 500, NASDAQ index etc. Just remember to use a benchmark that matches the current currency, otherwise comparisons won’t make sense.

Period Selector

If you have enough or high frequency data, you can divide time in more granular regular periods. Default is monthy view with an anual summary.
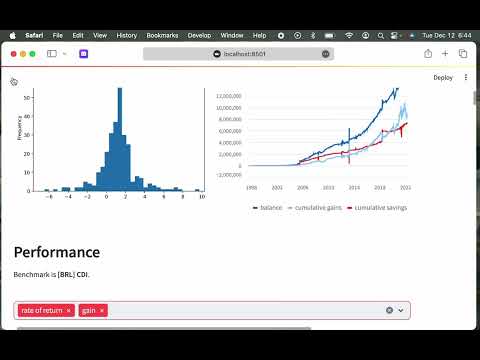
Graphs and Reports

Currently supports 4 graphs, from left to right, top to bottom:
- Virtual share value performance compared to a selected benchmark
- Periodic (monthly, weekly) gain, along with 12M moving average and moving median
- Frequency histogram of percent return rate per period (default is per month)
- Fund savings, balance and gains (which is pure balance minus savings)
There is also numerical reports showing:
- Performance
- Periodic (monthly) rate of return with an macro-period (yearly) accumulated value
- Same for selecte benchmark
- Excess return over benchmark
- Periodic and accumulated gain
- Wealth Evolution
- Current balance
- Balance over savings
- Cumulated gains
- Cumulated savings
- Movements on the periods, which is the sum of money added to and removed from virtual fund

Usage Tips
- Select a custom period on the slider
- View your main metrics on top of report
- To optimize screen usage, on the the top right menu, select Settings and then Wide mode
- Hide the left panel to gain even more screen real estate
- Use Refresh data buttons to update local cache with latest info from your porfolio spreadsheet, market data or both.
Release history Release notifications | RSS feed


Download files
Download the file for your platform. If you're not sure which to choose, learn more about installing packages.
Source Distribution
Built Distribution
Filter files by name, interpreter, ABI, and platform.
If you're not sure about the file name format, learn more about wheel file names.
Copy a direct link to the current filters
File details
Details for the file investorzilla-2.4.8.tar.gz.
File metadata
- Download URL: investorzilla-2.4.8.tar.gz
- Upload date:
- Size: 80.7 kB
- Tags: Source
- Uploaded using Trusted Publishing? No
- Uploaded via: twine/4.0.2 CPython/3.11.6
File hashes
| Algorithm | Hash digest | |
|---|---|---|
| SHA256 |
c46d00ca018eda0d4d817f6653523039b0c28a9397f4423545b89dcd94c9e20a
|
|
| MD5 |
94a3215b3c0a43222985a35fbac0d7ce
|
|
| BLAKE2b-256 |
adc8c649a17d523080fd67520f802382b8c9ce0e363284e4f89d82c65c27fce8
|
File details
Details for the file investorzilla-2.4.8-py3-none-any.whl.
File metadata
- Download URL: investorzilla-2.4.8-py3-none-any.whl
- Upload date:
- Size: 74.6 kB
- Tags: Python 3
- Uploaded using Trusted Publishing? No
- Uploaded via: twine/4.0.2 CPython/3.11.6
File hashes
| Algorithm | Hash digest | |
|---|---|---|
| SHA256 |
4cc8d25234b7fc253f1489c4731a810e69d443d4e4dc1c5dfa54467db195fd1b
|
|
| MD5 |
69267fe944ea51bee902afcc6f01715e
|
|
| BLAKE2b-256 |
6827d647d4192694c64bc708ba5b61f5bacffb1254c10799a78f9e297b1f7593
|


