Interactive Terminal Utilities

Project description


Interactive Terminal Utilities
import itrm
This library offers several functions for visualizing data within the terminal. This project does not exist just because it is cool. It exists because it fills some needs which few other tools do. For many developers, engineers, and scientists, the terminal is where much of their time is spent. Having to switch contexts every time a plot is generated can be time consuming and annoying. Furthermore, most plotting tools have fairly limited analysis capabilities. They are great for generating final, beautiful figures, but not great at quickly inspecting and understanding the data. Also, if you are working with a remote server through SSH, visualizing the data with conventional tools can be very tedious: save the data to a file, transfer the data to a local machine, write a script just to read and plot the data, plot the data, repeat. This library lets you directly visualize and interact with the data, skipping all the tedium.
Example scripts using this library can be found here. If you would like to contribute, please submit an issue here.
Configuration
This library uses the following default configuration settings:
| Setting | Default | Description |
|---|---|---|
uni |
True |
flag to use Unicode characters |
ar |
0.5 |
aspect ratio of characters |
cmap |
spectrum |
color map |
bold |
True |
flag to use bold plot characters |
A configuration file called config.ini can be used to override those defaults in the following locations:
| Platform | Location |
|---|---|
| Windows | C:\Users\{username}\AppData\Local\itrm\config.ini |
| macOS | ~/.config/itrm/config.ini |
| (or) | ~/Library/Application Support/itrm/config.ini |
| Linux | ~/.config/itrm/config.ini |
The config file should have the following format:
[render]
uni = True
ar = 0.5
cmap = spectrum
bold = True
You can also define an environment variable called ITRM_CONFIG_PATH to
redirect itrm to look for a configration file there. Finally, you can also
directly modify the configuration parameters in your Python script (e.g.,
itrm.Config.uni = False).
Unicode
Much of the plotting in the terminal performed by itrm relies on Unicode
characters. However, properly displaying those characters requires having a
monospace font with those specific glyphs defined. In fact, the default plotting
mode relies on braille characters, and relatively few fonts define those. If you
are looking for a good terminal font which supports all the Unicode used by this
library, try out JuliaMono. However, you might not be interested in
downloading fonts, so this library can also forego all Unicode characters and
only rely on ASCII characters. This is the purpose of the uni configuration.
Aspect Ratio
Because all the plotting by this library uses text, the aspect ratio (ratio of
width to height) of the characters affects the apparent aspect ratio of curves.
So, a circle might look perfectly round or squashed depending on the font
chosen. This does not mean you need a new font, you just need to adjust the
aspect ratio, ar, configuration setting.
Color Map
By default, the color map used is spectrum. Setting the cmap parameter, you
can pick any of the following color maps:
| Name | Description |
|---|---|
| spectrum | rainbow colors from blue to magenta |
| viridis | yellow to green to violet |
| grays | shades of gray from light to dark |
| reds | shades of red from light to dark |
| greens | shades of green from light to dark |
| blues | shades of blue from light to dark |
| 4bit | terminal-defined blue to magenta |
All but the last color map use platform-independent, 8-bit colors. The last
color map, 4bit, lets you control the colors with your terminal settings
instead. Each color map is a set of six distinct colors. When more than six
curves are shown in one plot, the colors will recycle.
Interactive Plots
itrm.iplot(x, y=None, label=None, rows=1, cols=1,
        lg=None, overlay=False, cmap=None, uni=None)
This function will create an interactive plot with a cursor. The cursor is used to pan, zoom, and identify values in the plot.
Parameters
X and Y Data
The iplot function will render all the data points defined by x and y to
the terminal. The inputs x and y can be vectors, matrices, or lists of such
arrays. Each row of a matrix is treated as a separate curve. Note, this is
different from MatPlotLib, in which each column is treated as a separate row.
(This difference is intentional, as in the author's opinion varying time along
columns means each column in a matrix can be treated as a vector. This
arrangement works very well in linear algebra, especially matrix multiplication
with a "set" of vectors over time.)
The shapes of x and y do not have to be the same, but they must be
compatible. So, x could be a vector and y could be a matrix as long as the
length of x equals the number of columns of y.
If only x is given, it will be interpreted as the y values, and the x
values will be an array of indices equal in length to y.
Labels
If a label is given, this will be printed in the bottom right of the plot box.
It can also be a list of strings. If the length of the list is the same as the
number of data sets (each row of a matrix is a different data set), then each
string in the list will be displayed with the respective data set. If the length
of the list is one greater, the first string will be displayed for the whole
plot.
Size
The rows and cols parameters let you specify the number of terminal text
rows and columns to use for the plot, respectively. For each of these, if the
value is less than or equal to 1, it represents a portion of the available space
to use. For example, if rows is 0.5, then half the number of rows of the
current terminal window will be used for the plot. If the value is greater than
1, it represents the absolute number of rows or columns to use. Also, if the
size of the current terminal cannot be obtained, the available space will
default to predefined, fixed values: 60 columns by 20 rows.
Log Scale
You can set the x or y axes to logarithmic scaling by setting the lg parameter
to one of "x", "y", or "xy". Note that the values reported for the view
and the cursor will be in the original scaling, not logarithmic.
Overlay
To prevent your terminal history from extending each time a new plot is
rendered, you can print a new plot over a previous plot by setting the overlay
parameter to True. This can be especially useful when there are multiple plots
to render (like for an animation) but you do not want your terminal history to
fill up quickly.
Color Map
For an individual plot, you can override the color map defined in
itrm.Config.cmap by setting the cmap parameter in the function call.
Unicode
For an individual plot, you can override the setting to use or not use Unicode
characters defined in itrm.Config.uni by setting the uni parameter in the
function call.
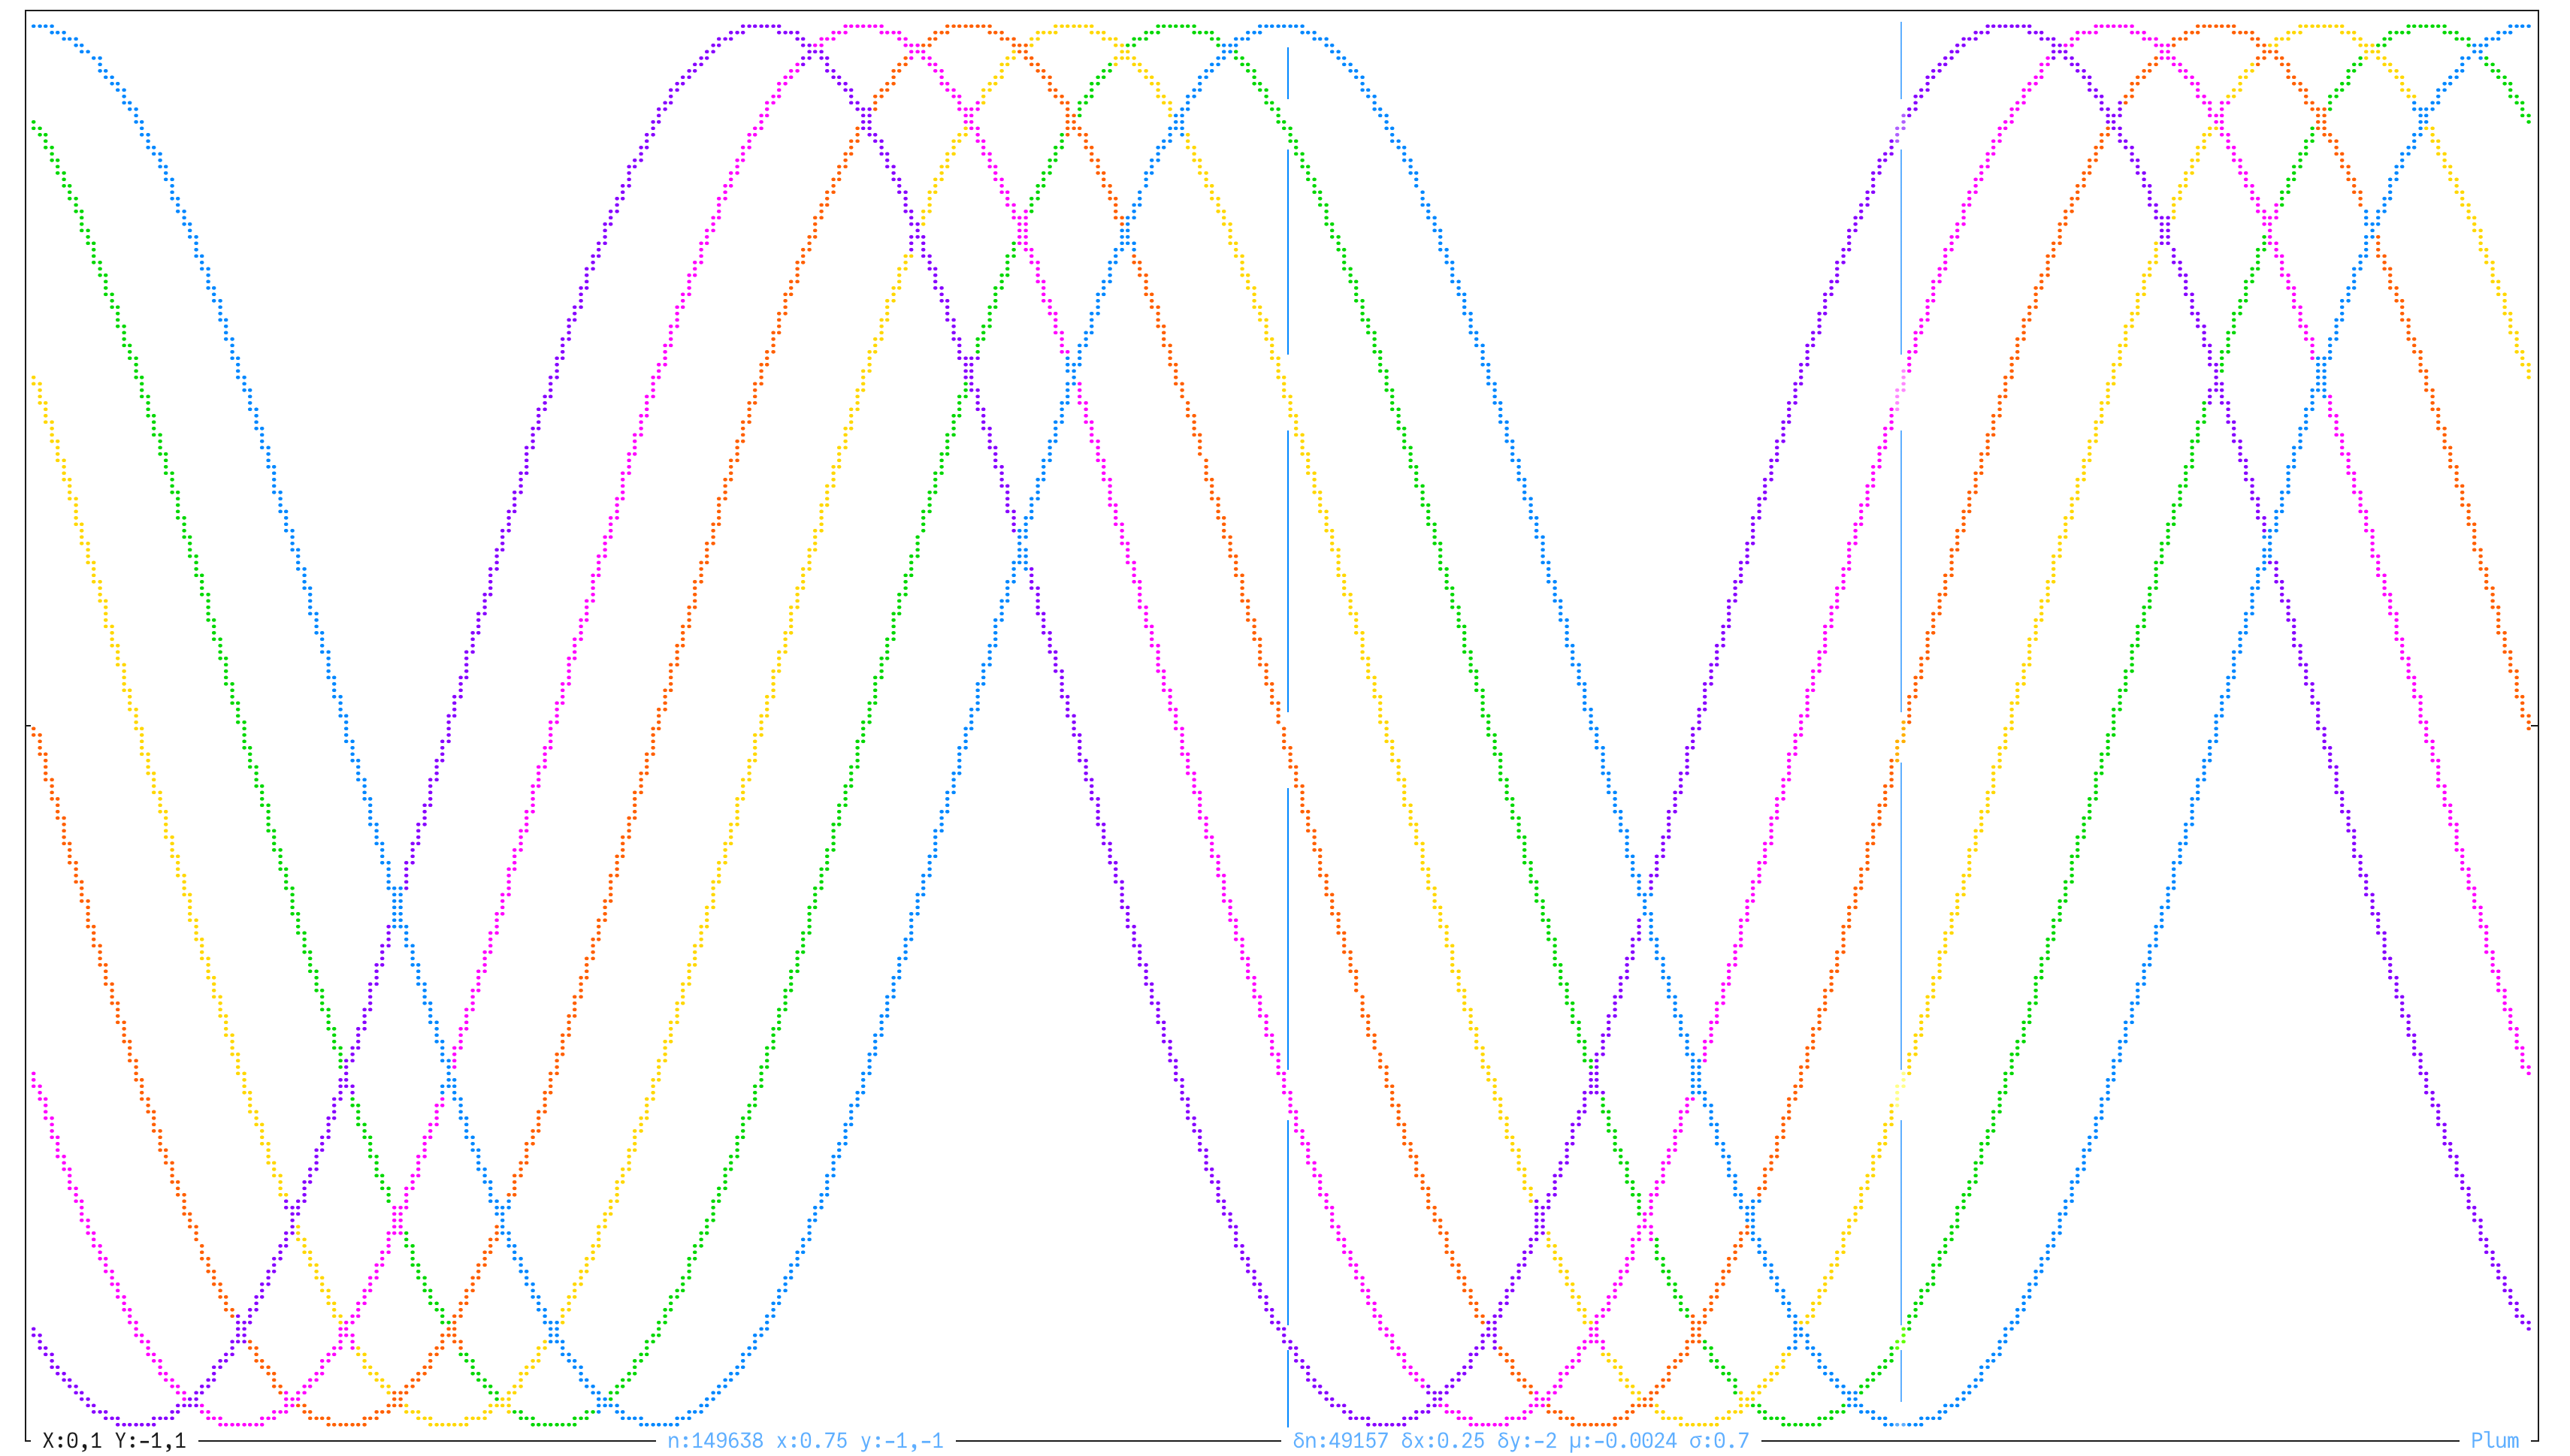
Information Bar
At the bottom of the plot, as part of the border, various information sets are listed:
- View
X:range of the x axis within viewY:range of the y axis within view
- Cursor
n:index of the value the cursor is currently centered on. This is visible only when a specific data set is selected.x:x-axis value corresponding to the current location of the cursor.y:y-axis value or range of values corresponding to the current location of the cursor.
- Metrics (only visible when a ghost cursor exists)
Δn:difference of indices between ghost cursor and current cursor. This is visible only when a specific data set is selected.Δx:difference of x values between ghost cursor and current cursor.Δy:difference of y values between ghost cursor and current cursor. This is visible only when a specific data set is selected.μ:mean of y values from ghost cursor to current cursor. This is visible only when a specific data set is selected.σ:standard deviation of y values from ghost cursor to current cursor. This is visible only when a specific data set is selected.
- Label
When not all of these information sets will fit in the currently available width
of the plot, they will be separated into different groups. You can cycle through
these groups by pressing the m or M key.
Keybindings
The iplot function provides interactivity through a vertical cursor. You can
move the cursor left and right, at normal speed or fast speed. You can zoom in
and out. And, you can cycle through which rows of the x and y data to focus
on. Note, iplot is designed for monotonically-increasing x values, and,
consequently, does not support equal axis scaling.
The following table details the shortcut keys:
| Keys | Function | Keys | Function | |
|---|---|---|---|---|
q, ⌫, ↵ |
exit interactive plot | j, s, ↓ |
zoom in | |
h, a, ← |
move cursor left | k, w, ↑ |
zoom out | |
l, d, → |
move cursor right | J, S, ⇧↓ |
zoom in fast | |
H, A, ⇧← |
move cursor left fast | K, W, ⇧↑ |
zoom out fast | |
L, D, ⇧→ |
move cursor right fast | n |
select next data set | |
g |
move cursor to start | N, p |
select previous data set | |
G |
move cursor to end | m |
next info set | |
c, z |
center view on cursor | M |
previous info set | |
x |
toggle x log scaling | v |
toggle ghost cursor | |
y |
toggle y log scaling | f |
start function | |
i |
toggle individual view | F |
restore original data |
Note that in Windows terminal emulators, there is no support for shift-arrow keys. Instead, use alt-arrow keys.
Individual Data Sets
When many data sets are being plotted simultaneously, it can be helpful to hide
all other data sets with the i key in order to isolate just the selected data
set.
Ghost Cursor
If you want to make a comparison between two points, you can use the ghost
cursor. First, position the cursor at the start position. Then, press the v
key. Immediately, you should see in the information bar at the bottom several
metrics (only the Δx metric if the cursor is white and there are multiple data
sets). These metrics are detailed in the Information Bar section above. Moving
the cursor will leave behind a ghost. As the cursor moves, the metrics will
update to reflect the range of values from the ghost cursor to the current
cursor.
Functions
Without writing any code, you can run a number of functions on the data and see
the results. First, press the f key. Then, follow that with other keys to get
the specific function applied to the data. The following table shows the full
key sequences:
| Keys | Description |
|---|---|
fab |
Get the absolute value of y-axis values |
fac |
Get the autocorrelation of the data |
fav |
Get the Allan variance of the data |
fd |
Differentiate data |
ff |
Get the FFT of the data |
fi |
Integrate data |
fn |
Show data as finite or non-finite |
ftl |
Trim left |
ftr |
Trim right |
fu |
Show only unique points (to 9th decimal place) |
fp |
Get the power spectral density |
f#a |
Apply weighted moving average of width # |
f#d |
De-trend data with polynomial of degree # |
f#l |
Apply 2nd-order, low-pass filter at frequency # |
f#p |
Get the y-axis value to the power of # |
f#s |
Apply simple moving average of width # |
f#u |
Show only unique points (to #th decimal place) |
(Other functions are planned for the future.) When one of the functions has been
applied, the sides of the plotting box will turn gray to signal that the data
has been altered. You can restore the original data by pressing the F key.
Plots
itrm.plot(x, y=None, label=None, rows=1, cols=1,
        ea=False, lg=None, overlay=False, cmap=None, uni=None)
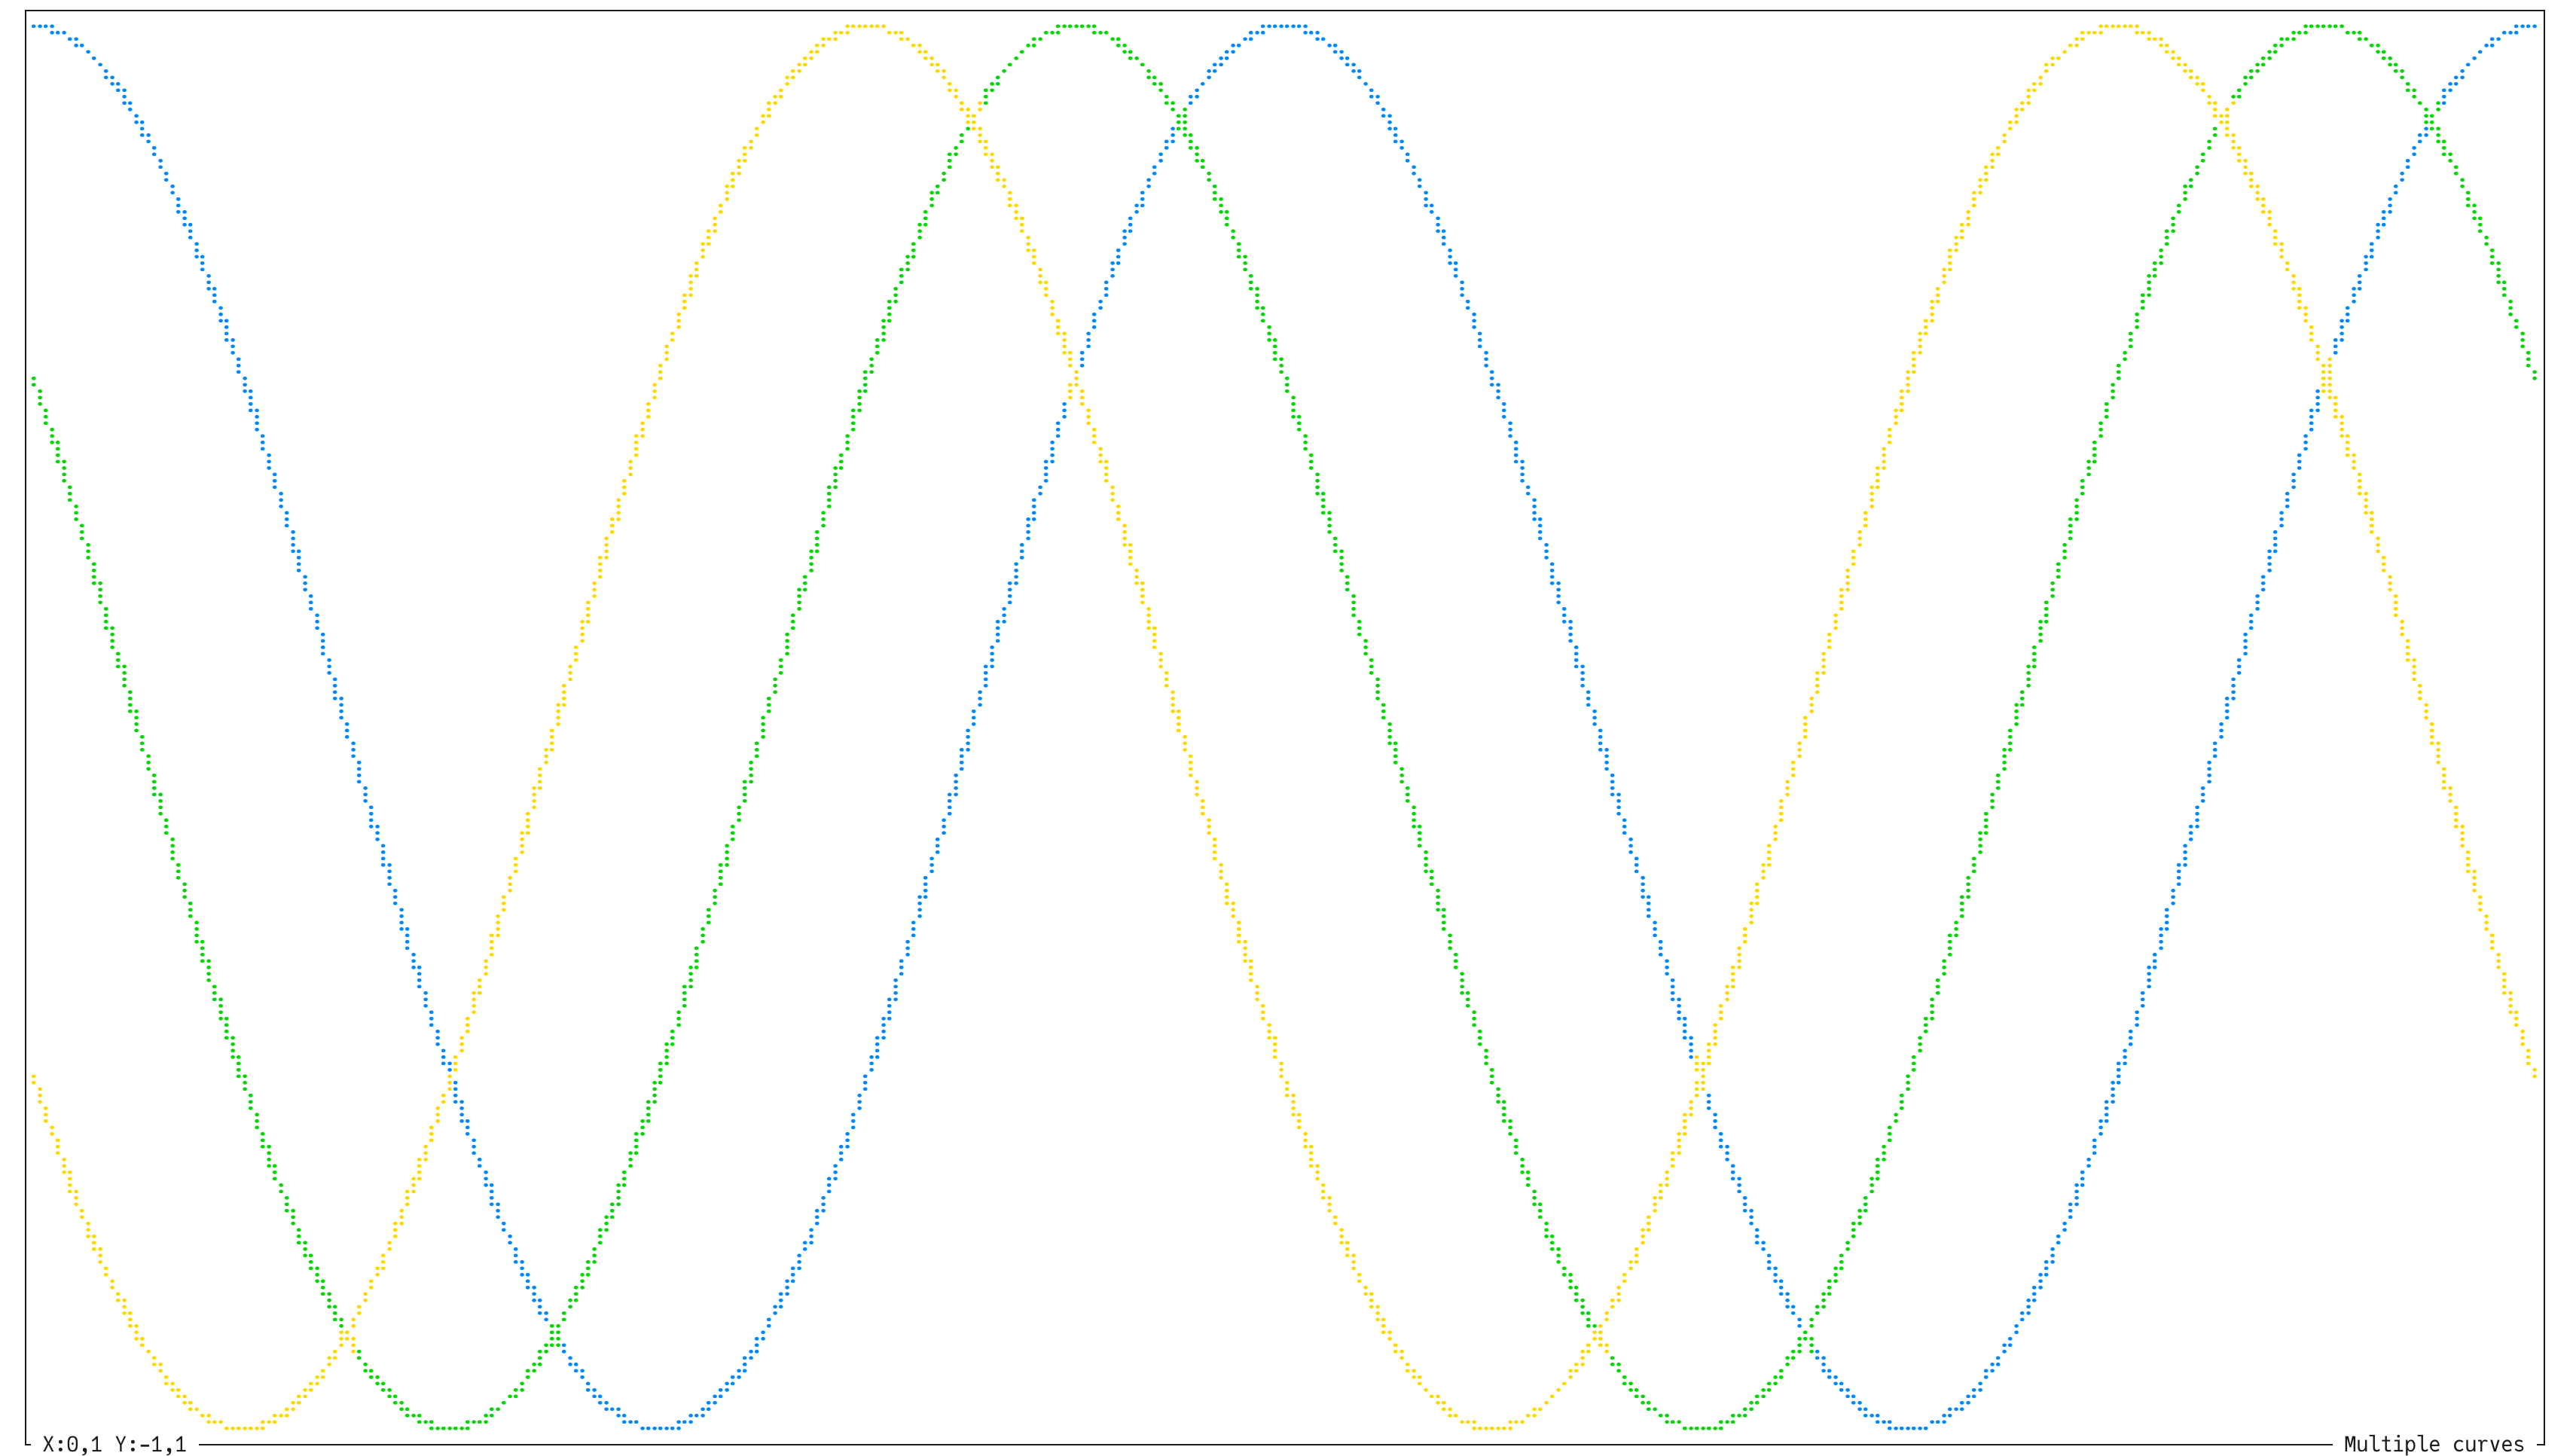
The plot function is a non-interactive version of the iplot function. All of
the same parameters are provided, with the addition of the equal-axes (ea)
parameter, which enables plotting things like circles without them rendering as
ellipses. This function does not require monotonicity of the x-axis data.
| Single curve | Multiple curves |
|---|---|
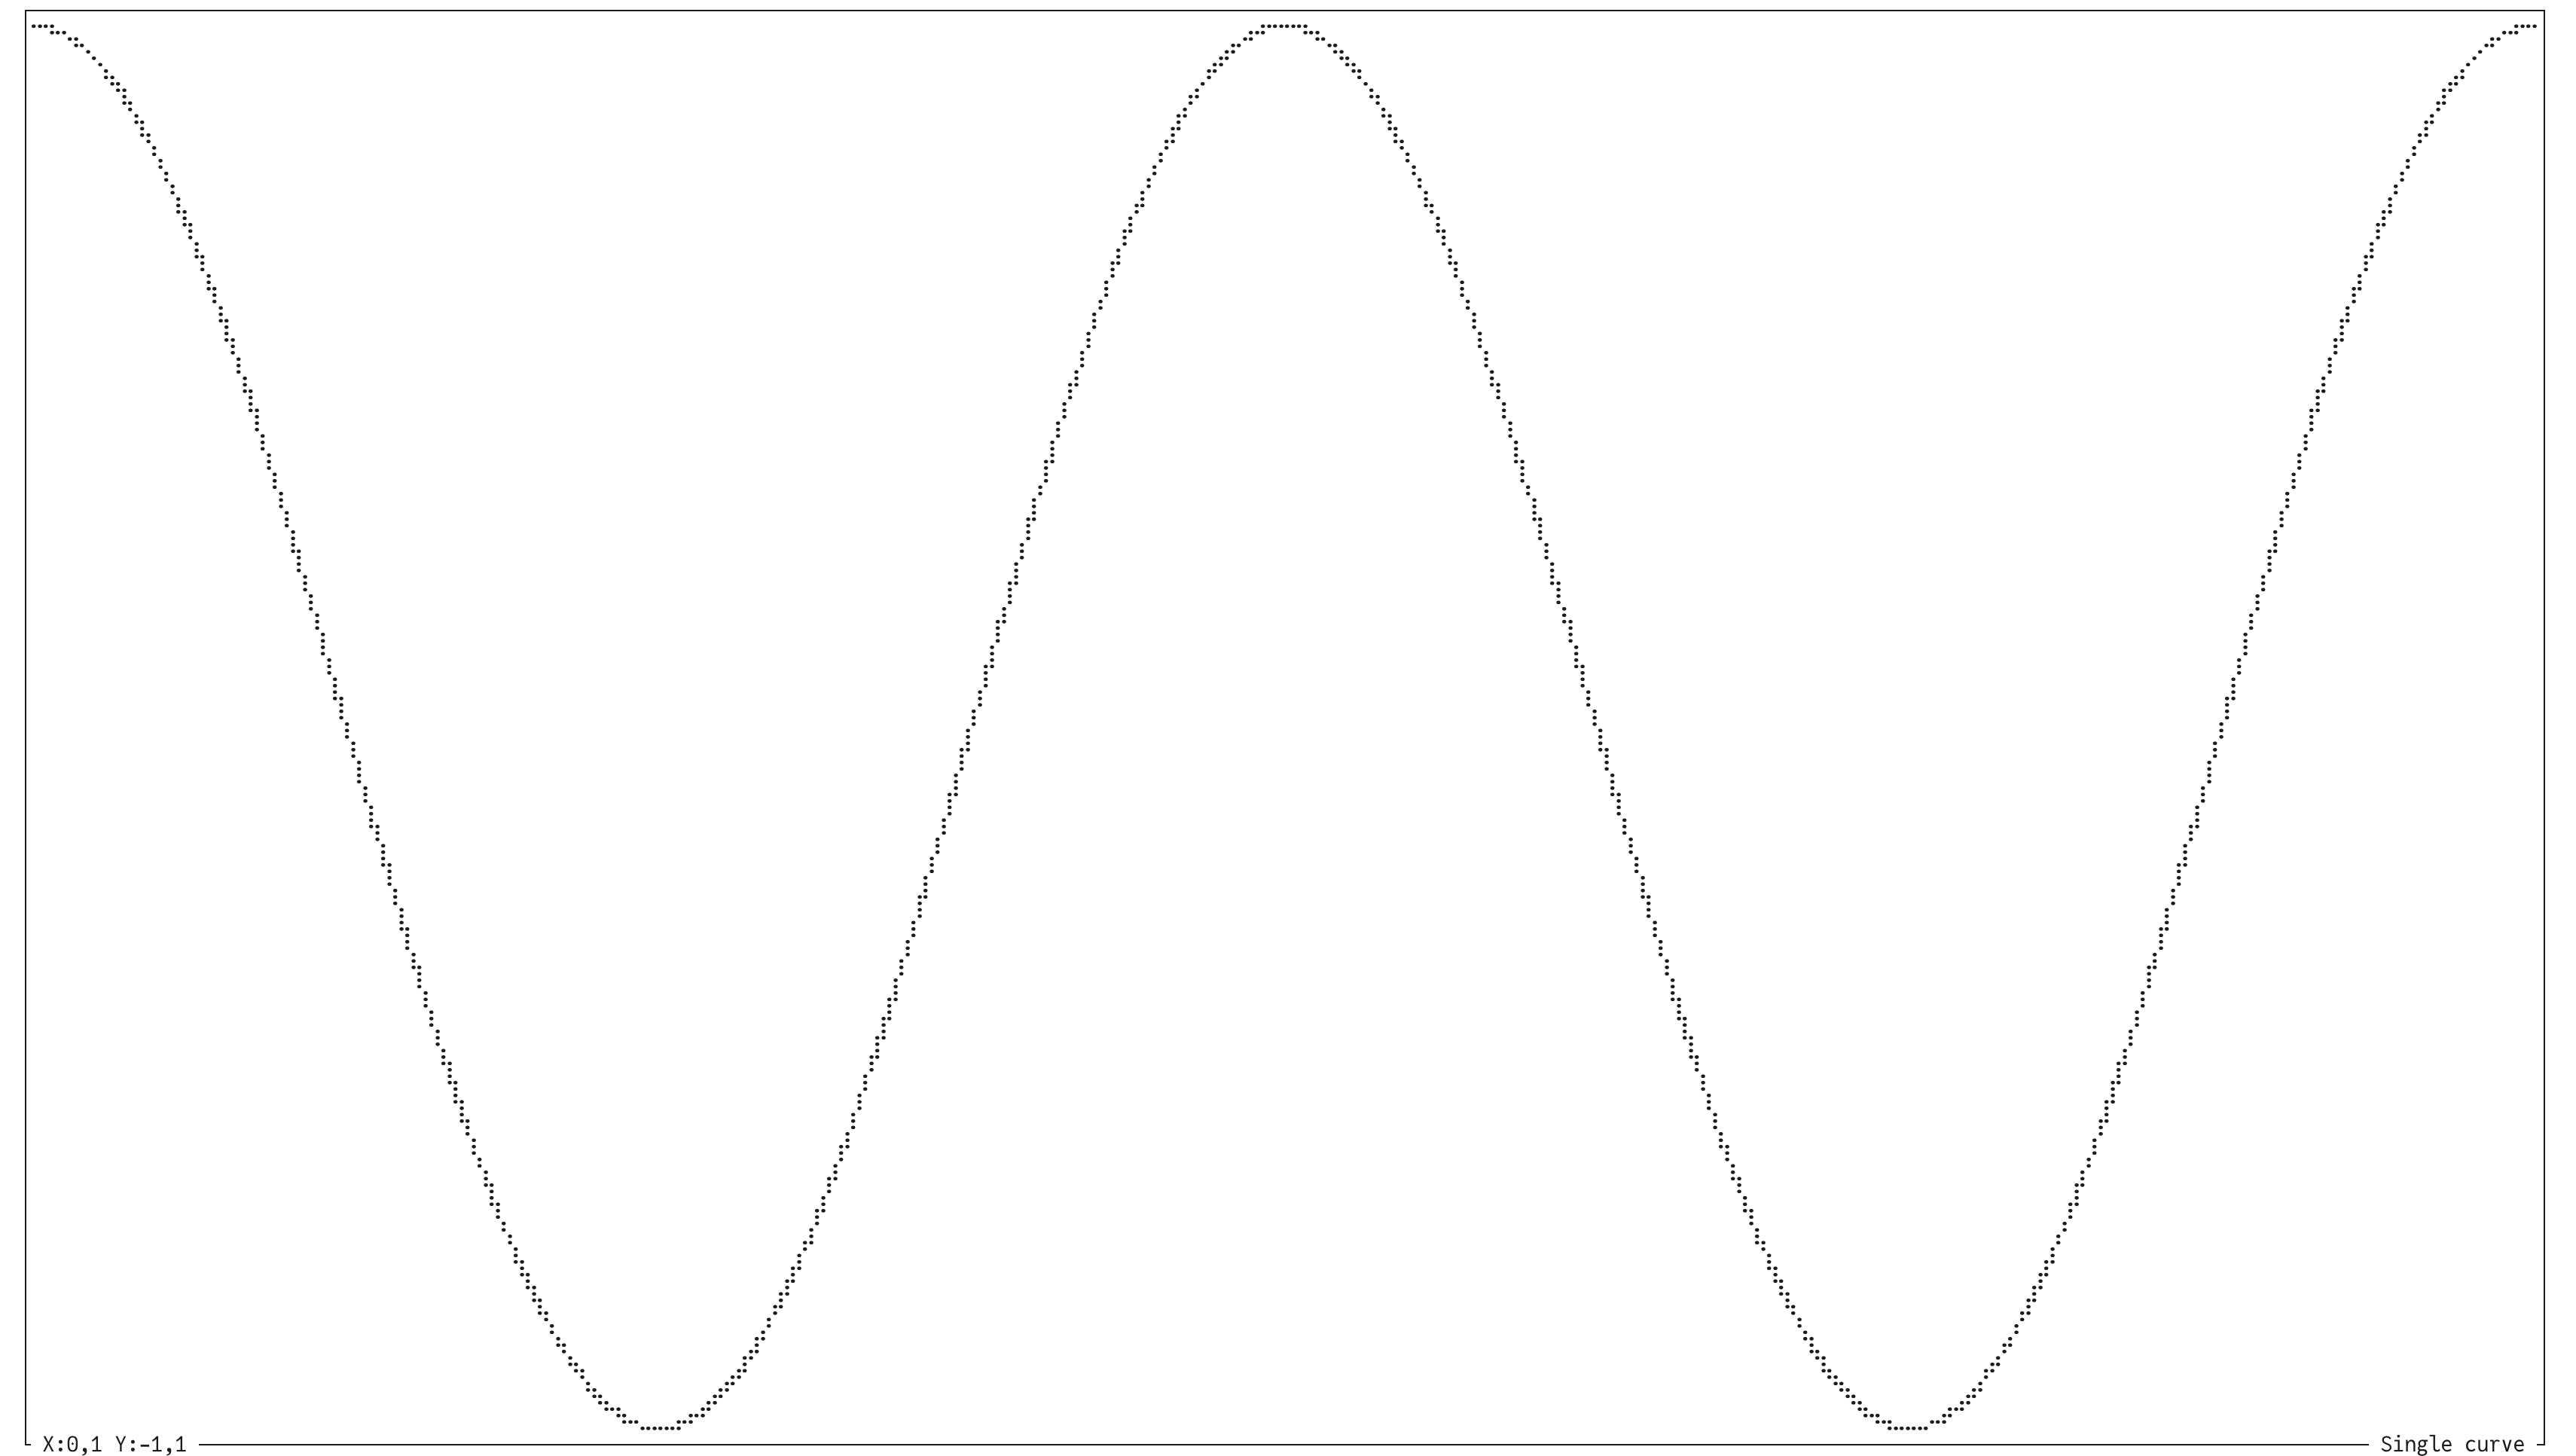 |
 |
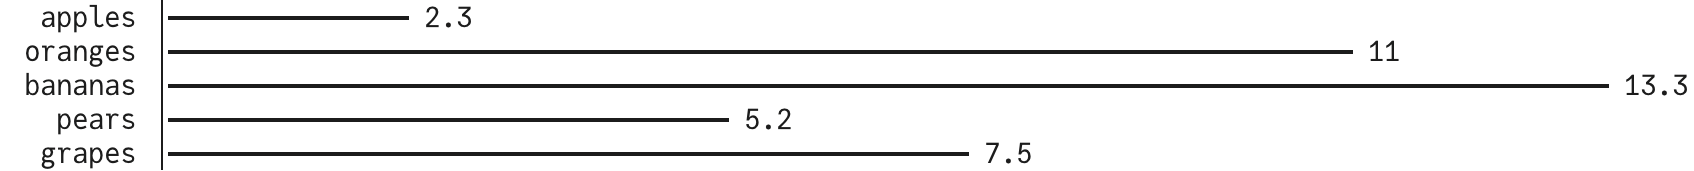
Bars
itrm.bars(x, labels=None, cols=1, uni=None)
It can be convenient to plot a simple bar graph. The x input is the vector of
values. The labels input is a list of strings corresponding to the labels to
print before the bar of each value in x. If the cols input is greater than
1, it is the total width of characters including the labels. If it is less than
or equal to 1, it is the portion of the terminal window width which will be used
for the graph. The uni parameter allows you to override the default
configuration setting for using Unicode characters.
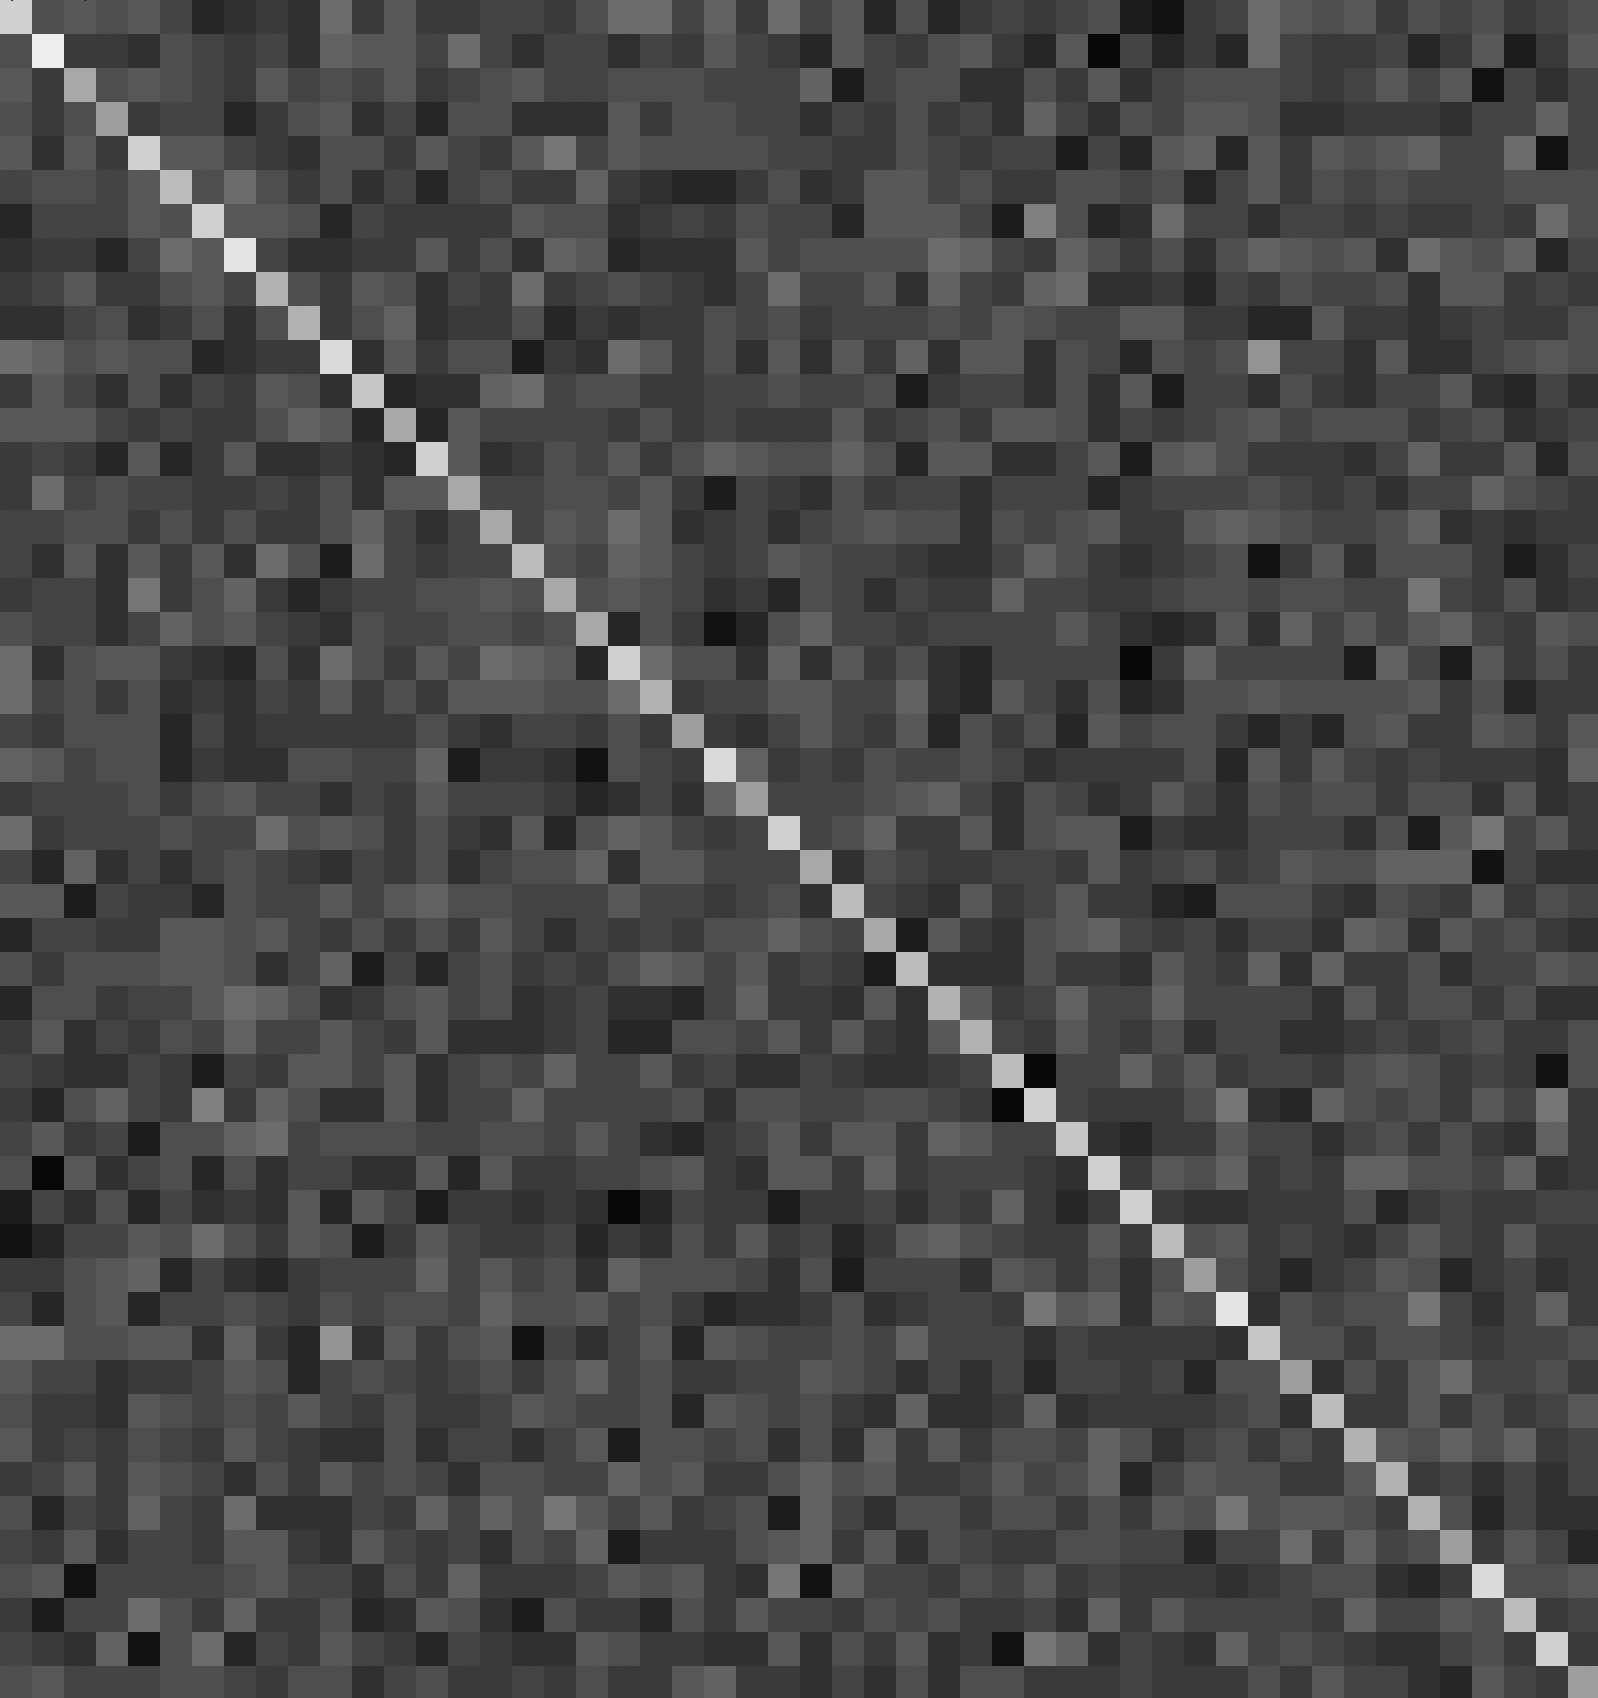
Heat maps
itrm.heat(matrix, uni=None)
The heat function will generate a heat map of the matrix input using 24
shades of gray. Black is used for the lowest value and white for the highest
value. The uni parameter allows you to override the default setting for using
Unicode characters. If uni is True, half-block characters from the Unicode
table will be used. If it is False, two spaces per element of the matrix will
be used (unless that would not fit the available width of the terminal window).
| With Unicode | Without Unicode |
|---|---|
 |
 |
Tables
itrm.table(matrix, head=None, left=None, fmt=10, uni=None)
You can print a nicely spaced table of the matrix data. The head and left
inputs are lists of header and left-most column labels, respectively, to print
above and to the left of, respectively, the matrix. If the fmt parameter is
an integer, the table will be formatted for the terminal and fmt will specify
the width of each matrix field in characters. Otherwise, fmt can be "csv" or
"tex". If it is "csv", the table will print as a csv file. If it is "tex", the
table will print as the body of a LaTeX-formatted table. The uni parameter
allows you to override the default setting for using Unicode characters.

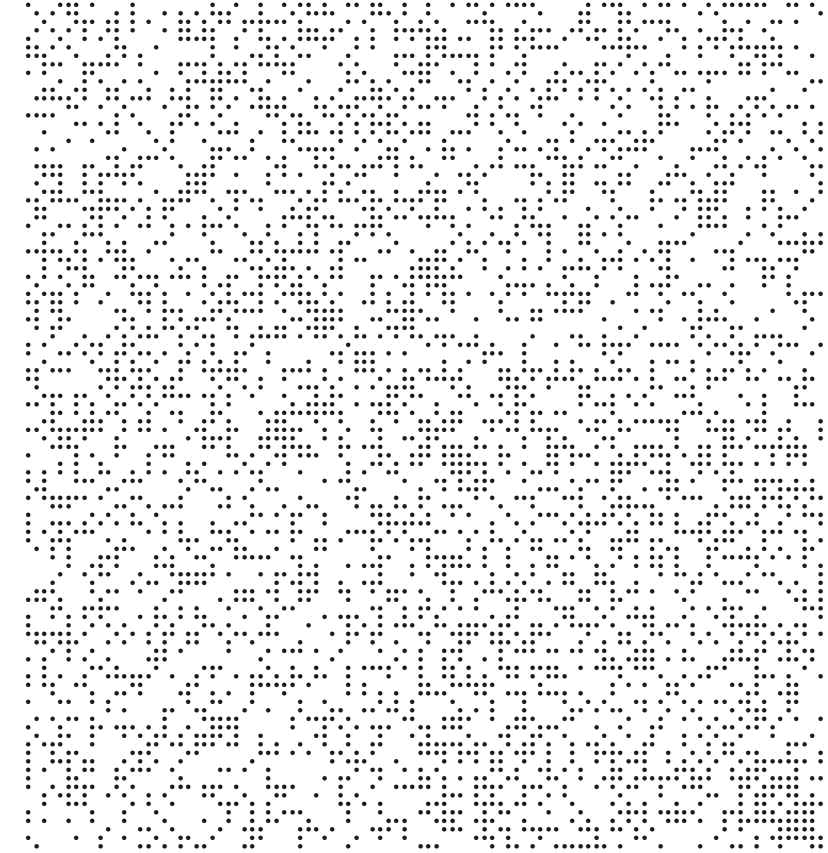
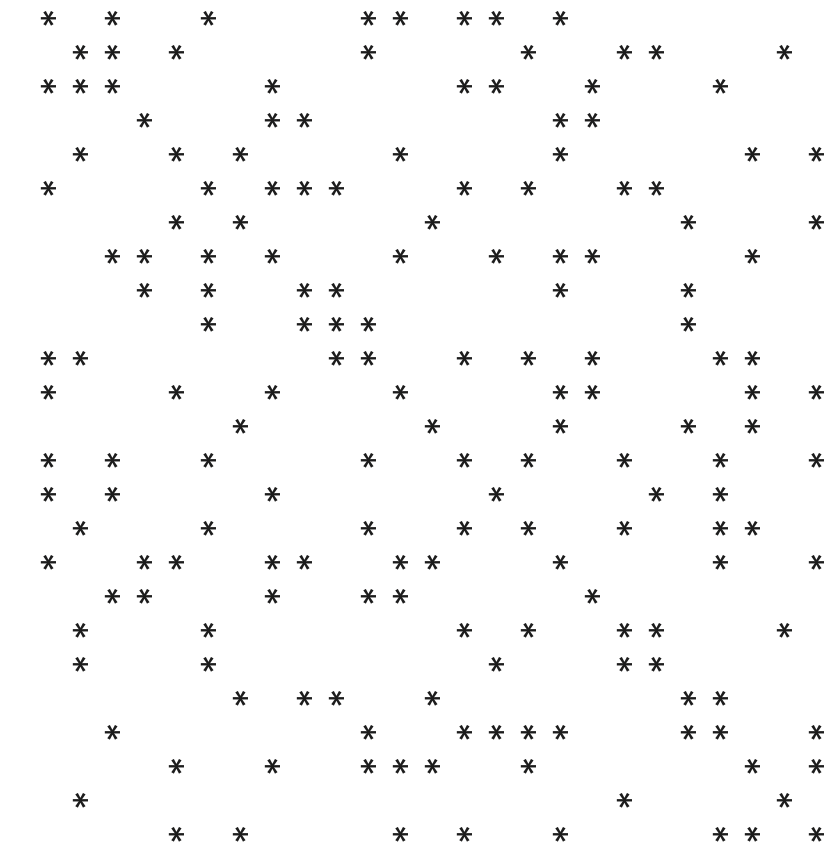
Sparsity
itrm.spy(matrix, uni=None)
To view the sparsity of a matrix, use the spy function. The uni parameter
allows you to override the default setting for using Unicode characters.
| With Unicode | Without Unicode |
|---|---|
 |
 |
Progress bars
bar = itrm.Progress(K, cols=1, uni=None)
bar.update(k)
There are many progress bar libraries available for Python. But, many of them
seem to be extremely over-complicated. TQDM, for example, includes over 20
source files. The implementation of a progress bar in itrm is a single class.
The k input is the counter of whatever for loop the progress bar is reporting
on. The K input is one greater than the largest possible value of k, as in
for k in range(K). When the process is completed, the total elapsed time will
be displayed. If cols is not provided, the full width of the current terminal
window will be used. The uni parameter allows you to override the default
configuration setting for using Unicode characters.


8-bit Color Map
itrm.colors():
This function will print all 256 of the 8-bit colors. The first 16 are terminal-specific.
Command-line Interface
You can directly call some of the library functions without even writing a Python script or using the REPL.
python -m itrm [OPTIONS] [file]
Positional Argument
file(optional): The name of the data file to read. Does not apply tocolorsfunction.
Options
--func,-f(optional): Specifies the function to use.- Choices:
iplot(default),heat,spy,colors. - Example:
-f heat
- Choices:
--type,-t(optional): Specifies the file type of the data file. Does not apply tocolorsfunction.- Choices:
txt,csv,bin, orNone(default). - Example:
-t csv
- Choices:
--columns,-c(optional): Number of columns in the data file. Does not apply tocolorsfunction.- Default:
0(auto-detect). - Example:
-c 5
- Default:
--xcolumns,-x(optional): Number of columns belonging to the x-axis. Does not apply tocolorsfunction.- Default:
1. - Example:
-x 2
- Default:
For the iplot, heat, and spy functions, if the number of columns in a
binary file is not provided, itrm will attempt to automatically determine the
number of columns. Binary files are expected to be in double-precision,
row-major format. For the iplot function, each column of the data file is
treated as a separate x or y array.
Installation
For instructions on using pip, visit https://pip.pypa.io/en/stable/getting-started/.
pip install itrm
Release history Release notifications | RSS feed


Download files
Download the file for your platform. If you're not sure which to choose, learn more about installing packages.
Source Distribution
Built Distribution
Filter files by name, interpreter, ABI, and platform.
If you're not sure about the file name format, learn more about wheel file names.
Copy a direct link to the current filters
File details
Details for the file itrm-1.4.23.tar.gz.
File metadata
- Download URL: itrm-1.4.23.tar.gz
- Upload date:
- Size: 49.2 kB
- Tags: Source
- Uploaded using Trusted Publishing? No
- Uploaded via: twine/6.2.0 CPython/3.13.7
File hashes
| Algorithm | Hash digest | |
|---|---|---|
| SHA256 |
0c31854290ddce271d43b1e45f49bb7bc395cde5b634e72a566f15e75247a95d
|
|
| MD5 |
e17938c0279dc2323897fbe3e162b367
|
|
| BLAKE2b-256 |
25e6c65b8b8cec0d5a1af16b171d7838da1b68cc280ff9c4b2e8e2b6d3ee6fc3
|
File details
Details for the file itrm-1.4.23-py3-none-any.whl.
File metadata
- Download URL: itrm-1.4.23-py3-none-any.whl
- Upload date:
- Size: 49.7 kB
- Tags: Python 3
- Uploaded using Trusted Publishing? No
- Uploaded via: twine/6.2.0 CPython/3.13.7
File hashes
| Algorithm | Hash digest | |
|---|---|---|
| SHA256 |
c37145bb12091fc0ae8b6f36dd787a3937843ca16559a2963b1c55e39bbe4d42
|
|
| MD5 |
e4e1f3cc7a8cb443063c8027dffb9931
|
|
| BLAKE2b-256 |
a54c72033a9f27abb552c1690bde30fe2460cf0a3580e7a3eca38c304bd4d1c4
|


