
jobscope
jobscope reports the efficiency of completed Slurm jobs. It decodes the
utilization data Slurm already stores in each job's sacct AdminComment
(CPU / memory / GPU / GPU-memory), enriches GPU jobs with DCGM profiling metrics
pulled from Prometheus, and can render any view as a terminal chart.
For completed jobs the CPU/MEM/GPU/GMEM numbers match jobstats, because
jobscope decodes the same stored blob, but in one bulk sacct query, with no
per-job calls and no job-count cap.
Screenshots
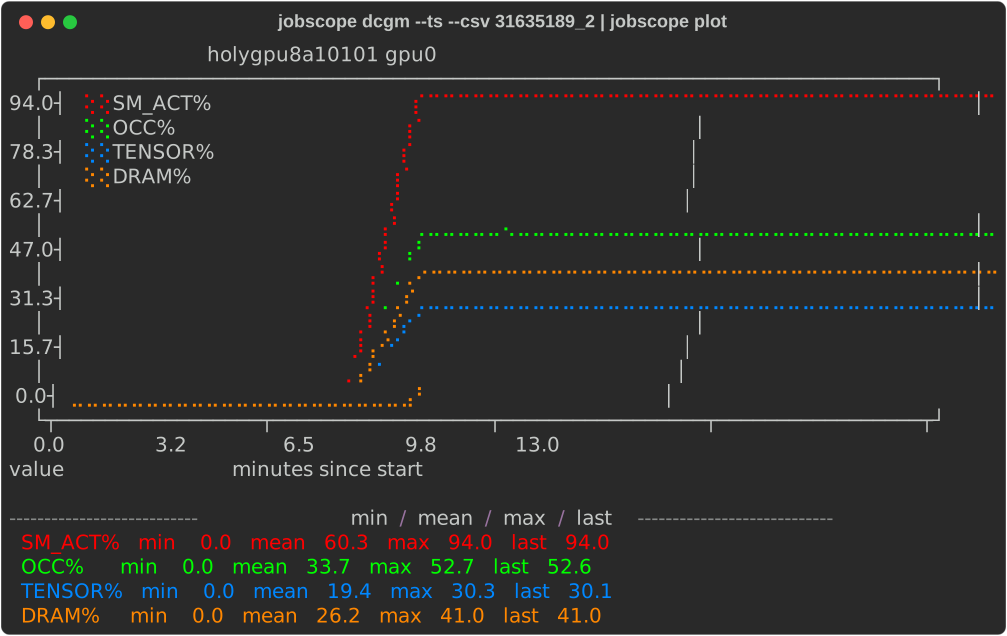
| Per-job DCGM time series |
 |
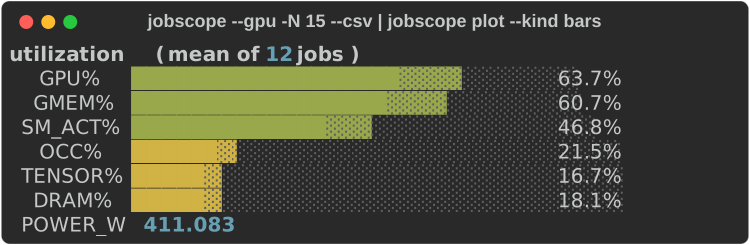
| Aggregated utilization across jobs |
 |
$ jobscope -S 2026-06-01 -E 2026-06-02
  User:      bdesinghu
  Select:    2026-06-01 .. 2026-06-02
JOBID        STATE     GPUS GPU%   GMEM%   SM_ACT%  OCC%    TENSOR%  DRAM%   POWER_W  RUNTIME      NAME
-------------------------------------------------------------------------------------------------------
17752673     COMPLETED 1    92     6       77.1     24.9    1.5      15.0    452      02:58:26     combo-pile
18074321     COMPLETED 1    98     8       49.3     5.8     1.0      6.6     181      01:37:53     vae-wt103
18074326     COMPLETED 1    93     6       76.7     24.8    1.5      14.8    455      09:28:41     combo-wt103
-------------------------------------------------------------------------------------------------------
Mean:                       94     7       67.7     18.5    1.3      12.1    363
Requirements
- Python 3.9+
- Slurm with
sacct, where the jobstats-style AdminComment blob is populated (needed by every view). - For the GPU and DCGM views only: a Prometheus endpoint serving the DCGM
(
DCGM_FI_*) andnvidia_gpu_*series that jobstats scrapes. The offline--cpu/--cgpuviews never contact it.
Install
jobscope is a command-line tool, so install it with
uv. uv provisions its own Python and puts the
jobscope executable on your PATH; there is no virtualenv to create or
activate, and it never touches the system Python (which on clusters like
FASRC/RHEL8 is too old to build pyproject.toml projects anyway).
Install uv once, if you don't already have it:
curl -LsSf https://astral.sh/uv/install.sh | sh
Then restart your shell so uv is on your PATH. (Alternatives: wget -qO- https://astral.sh/uv/install.sh | sh, pipx install uv, or brew install uv;
see the uv install docs.)
Now install jobscope:
uv tool install jobscope      # from PyPI
uv tool install .             # from a source checkout
Upgrade or remove it later with uv tool upgrade jobscope or uv tool uninstall jobscope.
For development from a checkout there's nothing to install; uv runs
everything straight from the source tree, creating the environment on demand:
uv run jobscope -D 3          # run the CLI from source
uv run --extra dev pytest     # run the test suite
Configuration
The GPU and DCGM views need a Prometheus endpoint serving the DCGM and
nvidia_gpu_* series. (The offline --cpu / --cgpu views, and everything under
describe and config, need nothing.) Provide the endpoint one of these ways.
# Preferred: environment variable (keeps a credential out of any file)
export JOBSCOPE_PROM_URL="https://USER:TOKEN@prometheus.example.net/api/prom"
Kempner AI Cluster users: the jobstats config.py sits beside the jobstats
binary on your PATH, and jobscope auto-discovers it when nothing else is
configured, so you need no config file and never handle the URL or token. Just
run jobscope. (This works at any jobstats site; to point at a different install,
set site_jobstats_config_path in the config file below.)
On any other cluster, put your settings in that same config file
(~/.config/jobscope/config.toml, or wherever $JOBSCOPE_CONFIG points):
jobscope config --example > ~/.config/jobscope/config.toml   # then edit it
jobscope config                                              # show the path in use
The config file also sets the DCGM sampling period, plot color thresholds, and
default timeout / worker counts; see jobscope config --example for the full,
commented template.
The Prometheus URL commonly embeds a credential: jobscope never prints it, and a
config.toml in a repo checkout is git-ignored. On sites already running
jobstats, site_jobstats_config_path reuses that install's PROM_SERVER, so the
secret is never copied.
Quick start
jobscope -D 3                     # summary of your jobs over the last 3 days
jobscope --cgpu -D 2              # CPU + GPU summary, fully offline (no Prometheus)
jobscope --diagnose -D 5          # add an advisory GPU diagnosis column
jobscope detail JOBID             # per-node / per-GPU breakdown
jobscope dcgm --ext JOBID         # full per-GPU DCGM profiling table
jobscope dcgm --ts --csv JOBID | jobscope plot --compact   # time-series chart
jobscope alone is shorthand for jobscope summary, so the selectors below work
with or without a subcommand. Flags and JOBIDs may be given in any order
(jobscope 12345 -D 3 and jobscope -D 3 12345 are equivalent), and
-j/--jobid is an explicit alternative to the positional JOBID.
Subcommands
| Command | Purpose |
|---|---|
jobscope summary |
one row per job (the default) |
jobscope detail |
per-node / per-GPU breakdown |
jobscope dcgm |
per-GPU DCGM profiling table (--ext for all 28 metrics, --ts for raw time series) |
jobscope plot |
render --csv output as a terminal chart |
jobscope describe |
plain-English column and metric reference (--dcgm for the catalog) |
jobscope config |
show the config path or print an example |
Selectors shared by summary, detail, and dcgm: -N (last N jobs), -D
(last N days), -S/-E (explicit window), -u/-A/-p/-t (user / account /
partition / state), --csv, and explicit JOBIDs. With no scope at all, the
last day is used.
Views
--gpu(default) shows GPU blob columns plus time-averaged DCGM profiling (SM_ACT%/OCC%/TENSOR%/DRAM%/POWER_W) pulled from Prometheus.--cgpuand--cpuare offline views based only on the stored blob.--diagnoseadds a short advisory GPU diagnosis label.
Run jobscope describe for column definitions and jobscope describe --dcgm --ext for the full metric catalog.
Plotting
jobscope plot renders jobscope <view> --csv output as terminal bar gauges,
histograms, heatmaps, and time-series line charts. The chart kind is
auto-detected from the CSV columns; override with --kind.
jobscope --gpu  --csv JOBID      | jobscope plot                 # bar gauges (one job)
jobscope --gpu  --csv -D 7       | jobscope plot --kind hist      # distribution (many jobs)
jobscope dcgm   --csv -D 7       | jobscope plot                 # heatmap (jobs/GPUs x metrics)
jobscope dcgm --ts --csv JOBID   | jobscope plot --compact        # time series
jobscope plot reads summary, dcgm, and dcgm --ts CSV; the detail CSV is
for machine consumption, not charts. Do not pass -n when piping to jobscope plot: the plot needs the CSV header row.
Contrib
contrib/jobstats_extended.py is a site-specific prototype that folds DCGM
metrics into the jobstats blob itself. It depends on an upstream jobstats install
and is not part of the package; see contrib/README.md.
References
- FASRC jobstats documentation
- Princeton jobstats
- For live monitoring, use KempnerPulse
1 maintainer

Metadata
1 maintainer
Release files for jobscope 0.1.1
For a detailed explanation of source distributions (sdists) and built distributions (wheels), please see the package formats documentation.
Source distribution (sdist)
| File | Size | Uploaded | |
|---|---|---|---|
| jobscope-0.1.1.tar.gz | 55.8 kB | Details |
Built distribution (wheel)
| File | Interpreter | ABI | Platform | Reset |
|---|---|---|---|---|
| jobscope-0.1.1-py3-none-any.whl | Python 3 | none | any | Details |
Total release size: 99.3 kB
Release files / jobscope-0.1.1.tar.gz
| Download URL | jobscope-0.1.1.tar.gz |
|---|---|
| Size | 55.8 kB |
| Tags | Source |
|
SHA-256 checksum How to use checksums |
9136bc178e2b54edd2600202d7794ddc86c5a80e4cf4a784a026c61eea78b151
|
|
BLAKE2b-256 checksum How to use checksums |
7326ef6b10e9fc9125a3ee50612b87aaf5aa1326d2832a29f6ec00d06a78bb3a
|
| Upload date | |
|
Uploaded using Trusted Publishing? What is trusted publishing? |
No |
| Uploaded via |
uv/0.8.19
|
Release files / jobscope-0.1.1-py3-none-any.whl
| Download URL | jobscope-0.1.1-py3-none-any.whl |
|---|---|
| Size | 43.5 kB |
| Tags | Python 3 |
|
SHA-256 checksum How to use checksums |
222ae187f66e716a986d1d07d57d4d7b530bcbe0655fea2f9de9112f80a7e430
|
|
BLAKE2b-256 checksum How to use checksums |
191c86b4fb9432b860c6cb54df1322a239e154db2c60c7cdeb53808f2c2496ae
|
| Upload date | |
|
Uploaded using Trusted Publishing? What is trusted publishing? |
No |
| Uploaded via |
uv/0.8.19
|














