
A modernized backtest report module powered by Polars
Verified details
These details have been verified by PyPIProject links
GitHub Statistics
Maintainers

Project description
Katsustats



katsustats is a Polars-powered analytics and reporting library for daily return series, inspired by quantstats.
Pass a DataFrame with date and pnl, and get summary metrics, drawdown analysis, key metrics with visualizations, and a self-contained HTML report.
Highlights:
- Polars-first API with pandas input support
- Benchmark-aware performance comparison
- Self-contained offline HTML reports
- Functional modules for
stats,plots, andreports
Preview
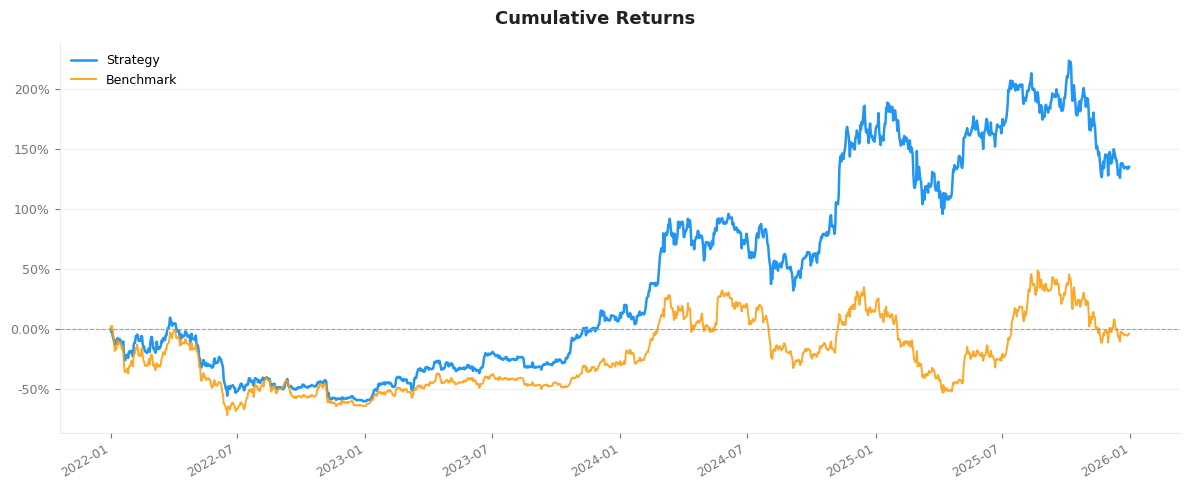
Cumulative returns
Additional charts
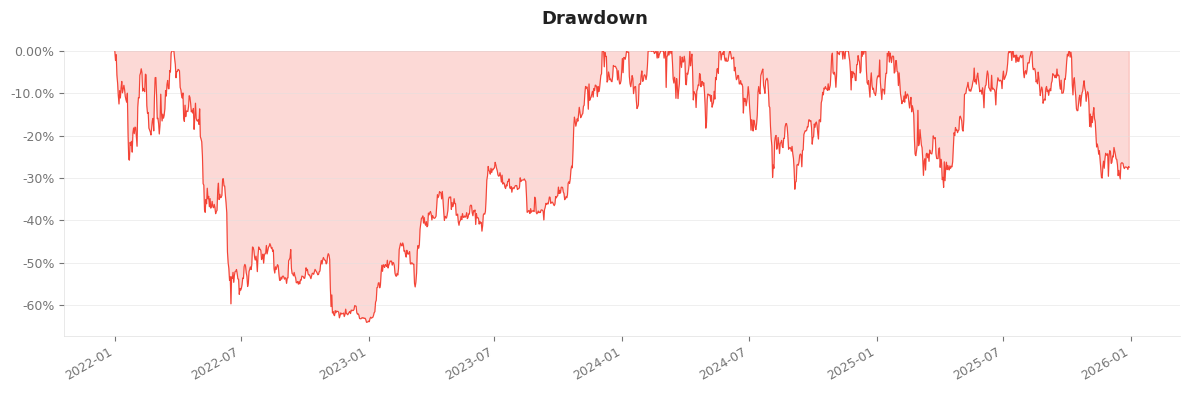
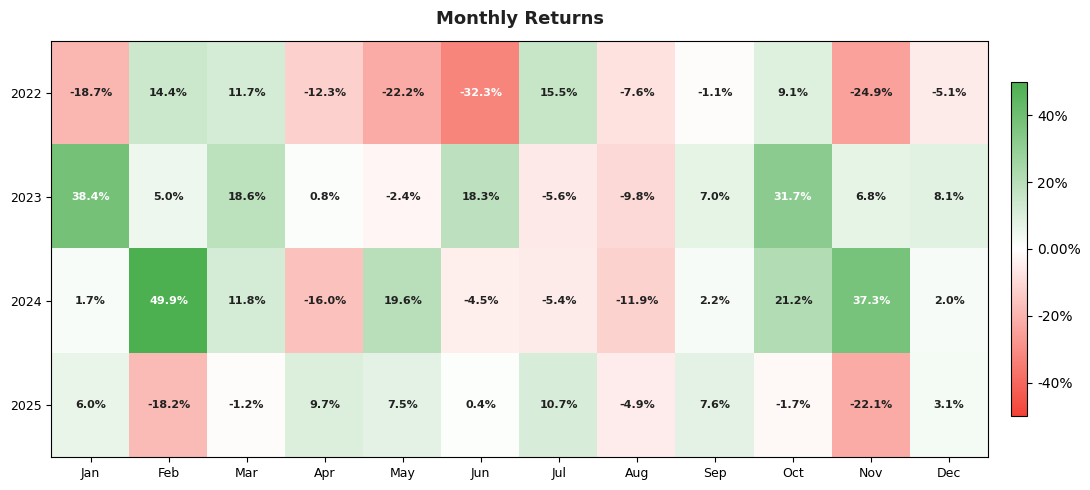
| Drawdowns | Monthly returns |
|---|---|
 |
 |
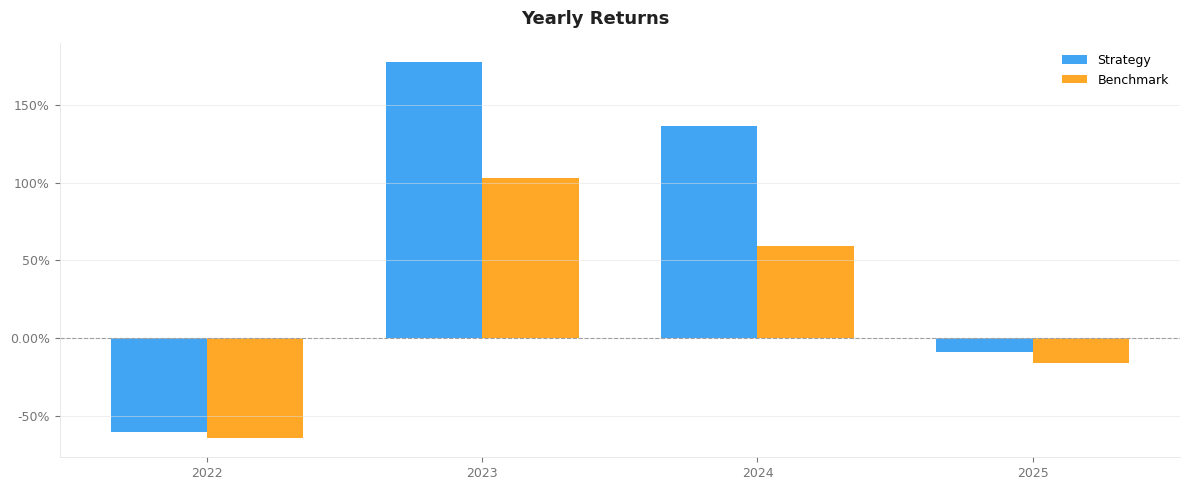
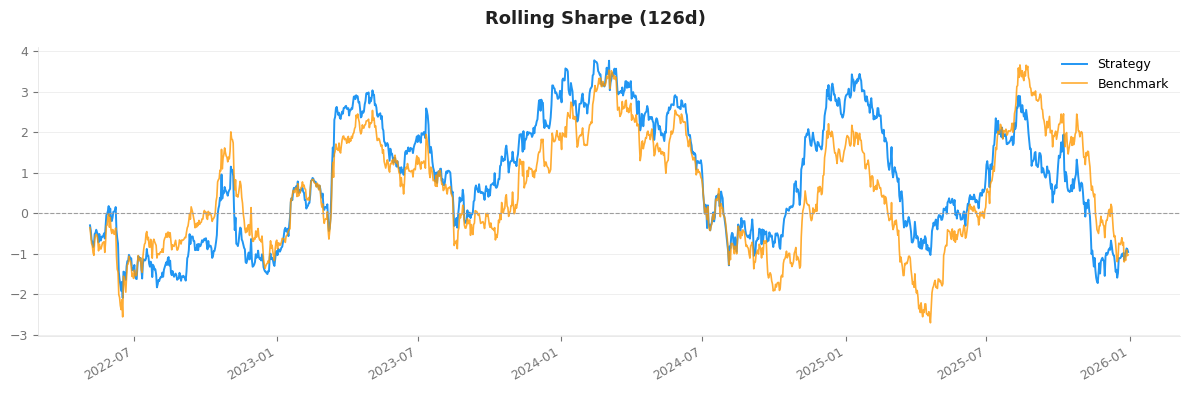
| Yearly returns | Rolling Sharpe |
|---|---|
 |
 |
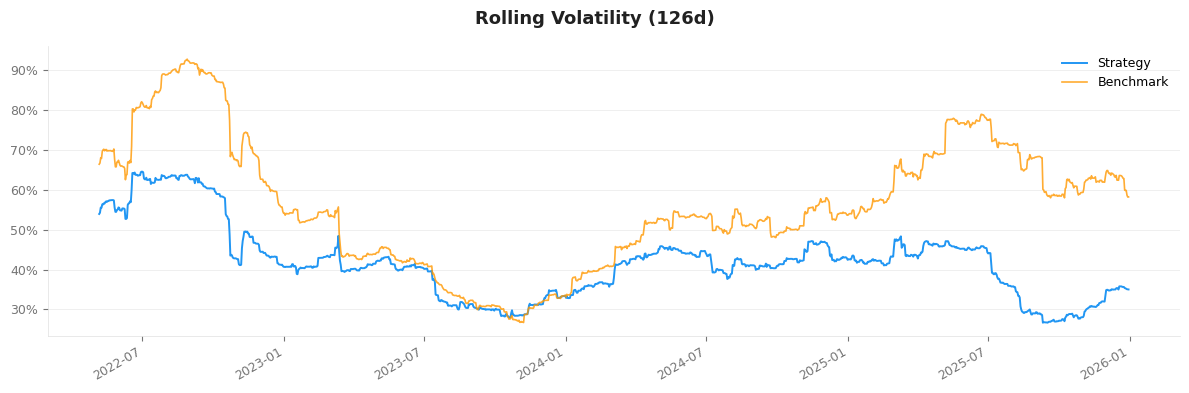
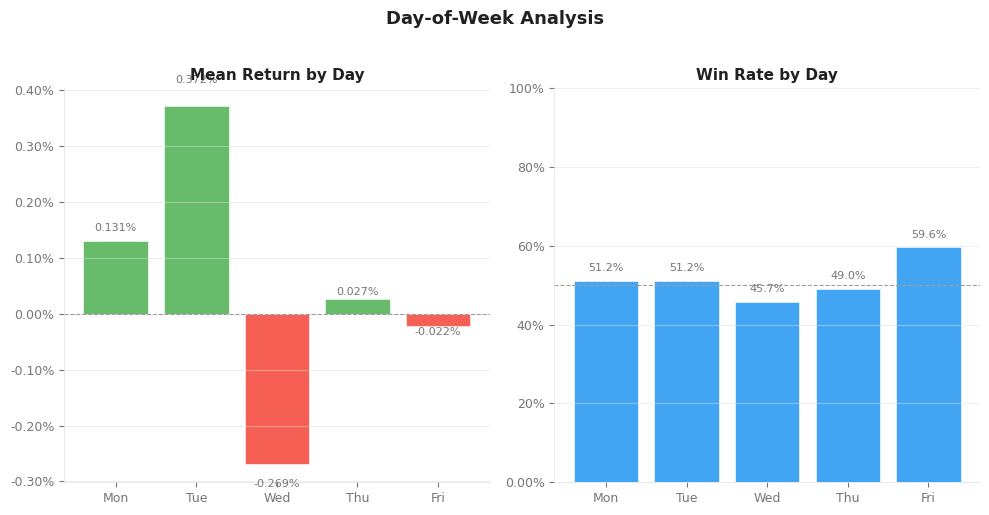
| Rolling volatility | Day-of-week returns |
|---|---|
 |
 |
How to use
Installation
pip install katsustats
Or with uv:
uv add katsustats
Try it online
Data format
katsustats accepts either a Polars or pandas DataFrame
with two required columns:
| column | type | description |
|---|---|---|
date |
date-like | Trading date |
pnl |
float-like | Daily return (e.g. 0.01 = +1%) |
When a pandas DataFrame is passed, katsustats converts it to Polars at the
start of processing.
If date is datetime-like, it is normalized to pl.Date before analysis.
If multiple rows share the same date, katsustats compounds those same-day
pnl values into one daily return, emits a warning, and continues.
Basic usage
import polars as pl
import katsustats

# Build your return series
pnl = pl.DataFrame({
    "date": pl.date_range(pl.date(2020, 1, 1), pl.date(2023, 12, 31), "1d", eager=True),
    "pnl": your_daily_returns,   # list / numpy array of floats
})

# Generate the full report (prints metrics + shows all plots)
results = katsustats.reports.full(pnl)
Pandas inputs work too:
import pandas as pd

pnl = pd.DataFrame({
    "date": dates,
    "pnl": your_daily_returns,
})

results = katsustats.reports.full(pnl)
See also the runnable examples in examples/quickstart.py, examples/with_benchmark.py, and examples/html_report.py.
results is a dict with the following keys:
| key | type | description |
|---|---|---|
summary |
dict[str, float] |
Raw numeric summary values |
metrics |
pl.DataFrame |
Summary metrics table |
drawdowns |
pl.DataFrame |
Top-5 drawdown periods |
dow_stats |
pl.DataFrame |
Day-of-week statistics |
figures |
dict[str, Figure] |
All 8 matplotlib figures |
With a benchmark
benchmark = pl.DataFrame({
    "date": pl.date_range(pl.date(2020, 1, 1), pl.date(2023, 12, 31), "1d", eager=True),
    "pnl": benchmark_daily_returns,
})

results = katsustats.reports.full(pnl, base_pnl=benchmark)
When a benchmark is provided, the metrics table also includes Alpha, Beta, Correlation, Information Ratio, and Excess Return.
Advanced options
results = katsustats.reports.full(
    pnl,
    base_pnl=benchmark,
    rf=0.04,          # annualized risk-free rate (default 0.0)
    periods=252,      # trading days per year (default 252)
    show=False,       # suppress inline plot display
)
HTML report
Generate a self-contained HTML report (similar to qs.reports.html()):
# Save to file
katsustats.reports.html(pnl, base_pnl=benchmark, title="My Strategy", output="report.html")

# Or get HTML string
html_str = katsustats.reports.html(pnl, title="My Strategy")
The report includes headline metric cards, performance tables, period performance, drawdown analysis, day-of-week statistics, and all 8 charts embedded as images — all in a single .html file that works offline.
When a benchmark is provided, the HTML report also includes regime analysis.
Using individual modules
You can also call the lower-level APIs directly:
import katsustats

# --- Stats ---
katsustats.stats.total_return(pnl)
katsustats.stats.cagr(pnl)
katsustats.stats.sharpe(pnl, rf=0.0)
katsustats.stats.sortino(pnl)
katsustats.stats.max_drawdown(pnl)
katsustats.stats.calmar(pnl)
katsustats.stats.volatility(pnl)
katsustats.stats.win_rate(pnl)
katsustats.stats.profit_factor(pnl)
katsustats.stats.value_at_risk(pnl, alpha=0.05)

katsustats.stats.drawdown_details(pnl, top_n=5)      # pl.DataFrame
katsustats.stats.day_of_week_stats(pnl)              # pl.DataFrame
katsustats.stats.summary_metrics(pnl, base_pnl)     # pl.DataFrame

# --- Plots ---
katsustats.plots.plot_cumulative_returns(pnl, base_pnl)
katsustats.plots.plot_drawdown(pnl)
katsustats.plots.plot_monthly_heatmap(pnl)
katsustats.plots.plot_yearly_returns(pnl, base_pnl)
katsustats.plots.plot_return_distribution(pnl, base_pnl)
katsustats.plots.plot_rolling_sharpe(pnl, base_pnl)
katsustats.plots.plot_rolling_volatility(pnl, base_pnl)
katsustats.plots.plot_dow_returns(pnl)
Metrics produced
| metric | description |
|---|---|
| Total Return | Compounded return over the full period |
| CAGR | Compound Annual Growth Rate |
| Sharpe Ratio | Annualized risk-adjusted return |
| Sortino Ratio | Sharpe using only downside deviation |
| Max Drawdown | Largest peak-to-trough decline |
| Calmar Ratio | CAGR / |Max Drawdown| |
| Volatility (ann.) | Annualized standard deviation |
| Win Rate | % of days with positive returns |
| Profit Factor | Gross profit / gross loss |
| Best / Worst Day | Largest single-day gain / loss |
| Avg Win / Avg Loss | Mean return on winning / losing days |
| Daily VaR (95%) | 5th-percentile daily return |
| CVaR (95%) | Mean return in the worst 5% tail |
| Recovery Factor | Total return / |Max Drawdown| |
| Skewness / Kurtosis | Distribution shape statistics |
| Best / Worst Month | Largest / smallest monthly return |
| Best / Worst Year | Largest / smallest yearly return |
| Positive Months / Years | Share of profitable months / years |
When a benchmark is provided, katsustats also reports Alpha, Beta, Correlation, Information Ratio, and Excess Return.
Project details
Verified details
These details have been verified by PyPIProject links
GitHub Statistics
Maintainers
Release history Release notifications | RSS feed


Download files
Download the file for your platform. If you're not sure which to choose, learn more about installing packages.
Source Distribution
Built Distribution
Filter files by name, interpreter, ABI, and platform.
If you're not sure about the file name format, learn more about wheel file names.
Copy a direct link to the current filters
File details
Details for the file katsustats-0.2.4.tar.gz.
File metadata
- Download URL: katsustats-0.2.4.tar.gz
- Upload date:
- Size: 167.2 kB
- Tags: Source
- Uploaded using Trusted Publishing? Yes
- Uploaded via: twine/6.1.0 CPython/3.13.12
File hashes
| Algorithm | Hash digest | |
|---|---|---|
| SHA256 |
b33c4cd04bcc7535bf1aeccccd5f042de6218921150821d4398b862743b07df4
|
|
| MD5 |
04134c0ad3d51b83cc62acc3b708ff3f
|
|
| BLAKE2b-256 |
2305e6e152392c7f372bd7a101be8a04dea9329f6e802996d368ba77f34c5e4d
|
Provenance
The following attestation bundles were made for katsustats-0.2.4.tar.gz:
Publisher:
publish.yml on katsu1110/katsustats
-
Statement:
-
Statement type:
https://in-toto.io/Statement/v1 -
Predicate type:
https://docs.pypi.org/attestations/publish/v1 -
Subject name:
katsustats-0.2.4.tar.gz -
Subject digest:
b33c4cd04bcc7535bf1aeccccd5f042de6218921150821d4398b862743b07df4 - Sigstore transparency entry: 1390659114
- Sigstore integration time:
-
Permalink:
katsu1110/katsustats@acb332534f3d9b87d44d000db0df5e8c2c4c0b37 -
Branch / Tag:
refs/tags/v0.2.4 - Owner: https://github.com/katsu1110
-
Access:
public
-
Token Issuer:
https://token.actions.githubusercontent.com -
Runner Environment:
github-hosted -
Publication workflow:
publish.yml@acb332534f3d9b87d44d000db0df5e8c2c4c0b37 -
Trigger Event:
release
-
Statement type:
File details
Details for the file katsustats-0.2.4-py3-none-any.whl.
File metadata
- Download URL: katsustats-0.2.4-py3-none-any.whl
- Upload date:
- Size: 28.6 kB
- Tags: Python 3
- Uploaded using Trusted Publishing? Yes
- Uploaded via: twine/6.1.0 CPython/3.13.12
File hashes
| Algorithm | Hash digest | |
|---|---|---|
| SHA256 |
b641a95e939fb83cae110d4dc60647e5c60949e192a06c96026959b1d1a1c360
|
|
| MD5 |
9e0e1ebc97bc7aef52a0b5a8030c1a01
|
|
| BLAKE2b-256 |
8301ca5e8fda272904f4d16242da1fd26779aaff42ecbc665821d8bc1b2b8e5a
|
Provenance
The following attestation bundles were made for katsustats-0.2.4-py3-none-any.whl:
Publisher:
publish.yml on katsu1110/katsustats
-
Statement:
-
Statement type:
https://in-toto.io/Statement/v1 -
Predicate type:
https://docs.pypi.org/attestations/publish/v1 -
Subject name:
katsustats-0.2.4-py3-none-any.whl -
Subject digest:
b641a95e939fb83cae110d4dc60647e5c60949e192a06c96026959b1d1a1c360 - Sigstore transparency entry: 1390659126
- Sigstore integration time:
-
Permalink:
katsu1110/katsustats@acb332534f3d9b87d44d000db0df5e8c2c4c0b37 -
Branch / Tag:
refs/tags/v0.2.4 - Owner: https://github.com/katsu1110
-
Access:
public
-
Token Issuer:
https://token.actions.githubusercontent.com -
Runner Environment:
github-hosted -
Publication workflow:
publish.yml@acb332534f3d9b87d44d000db0df5e8c2c4c0b37 -
Trigger Event:
release
-
Statement type:






