
A modernized backtest report module powered by Polars
Verified details
These details have been verified by PyPIProject links
GitHub Statistics
Maintainers

Project description
Katsustats



katsustats is a Polars-powered analytics and reporting library for daily return series, inspired by quantstats.
Pass a DataFrame with date and returns, and get summary metrics, drawdown analysis, key metrics with visualizations, and a self-contained HTML report.
Highlights:
- Polars-first API with pandas input support
- Benchmark-aware performance comparison
- Self-contained offline HTML reports
- AI-friendly structured JSON reports
- Readable Markdown summaries for humans and agents
- Functional modules for
stats,plots, andreports
Preview
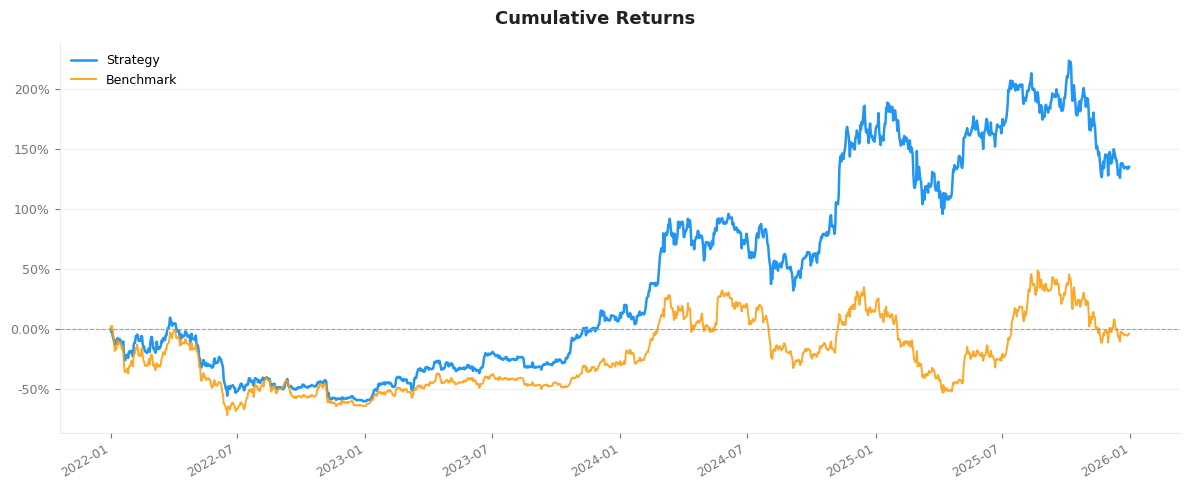
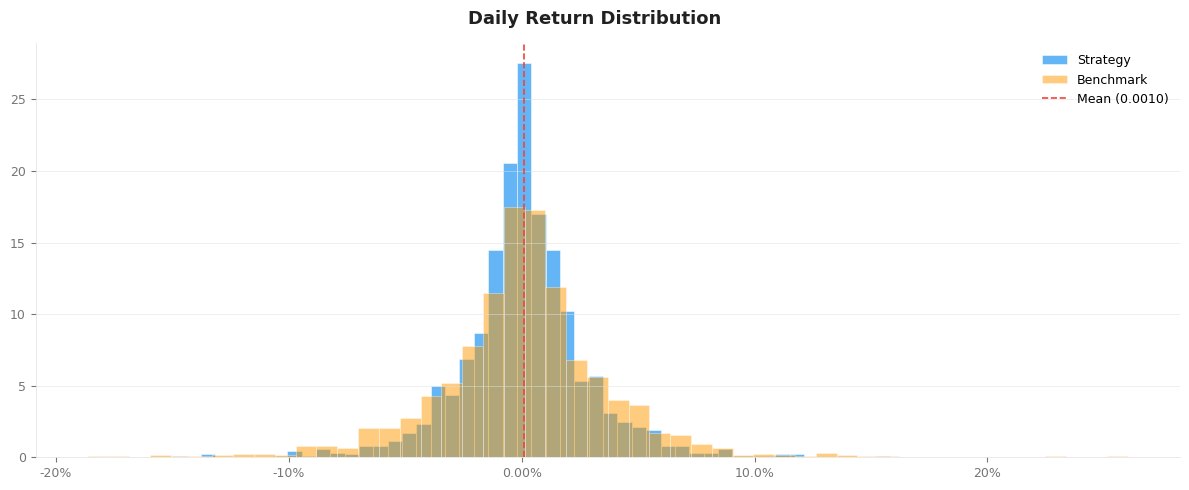
| Cumulative returns | Daily returns |
|---|---|
 |
 |
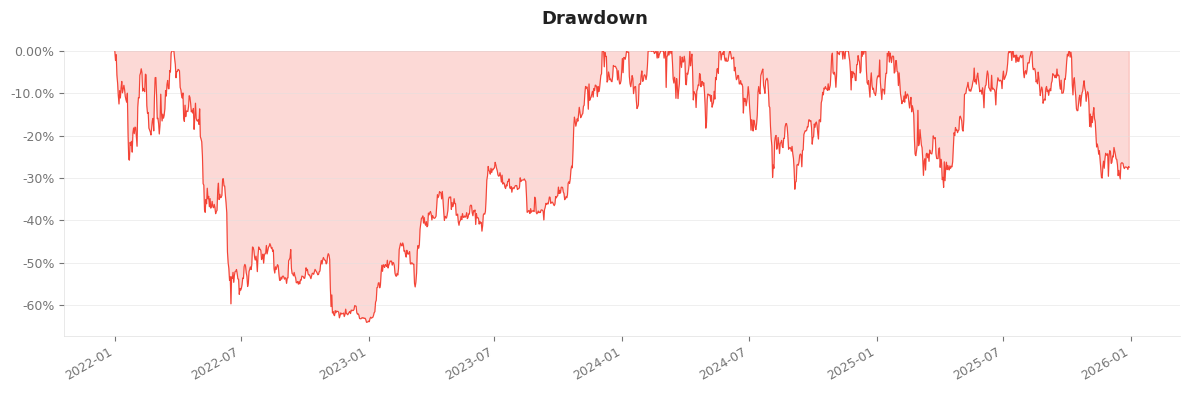
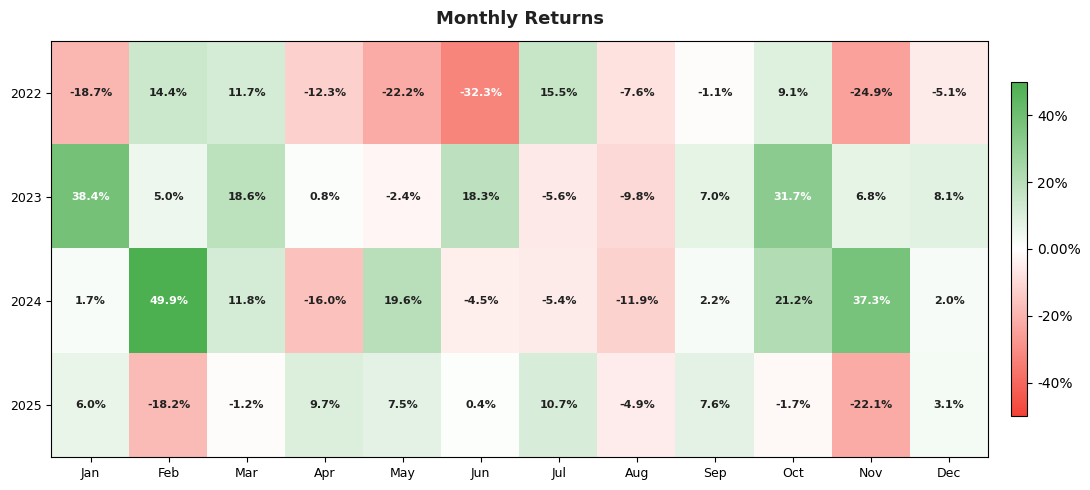
| Drawdowns | Monthly returns |
|---|---|
 |
 |
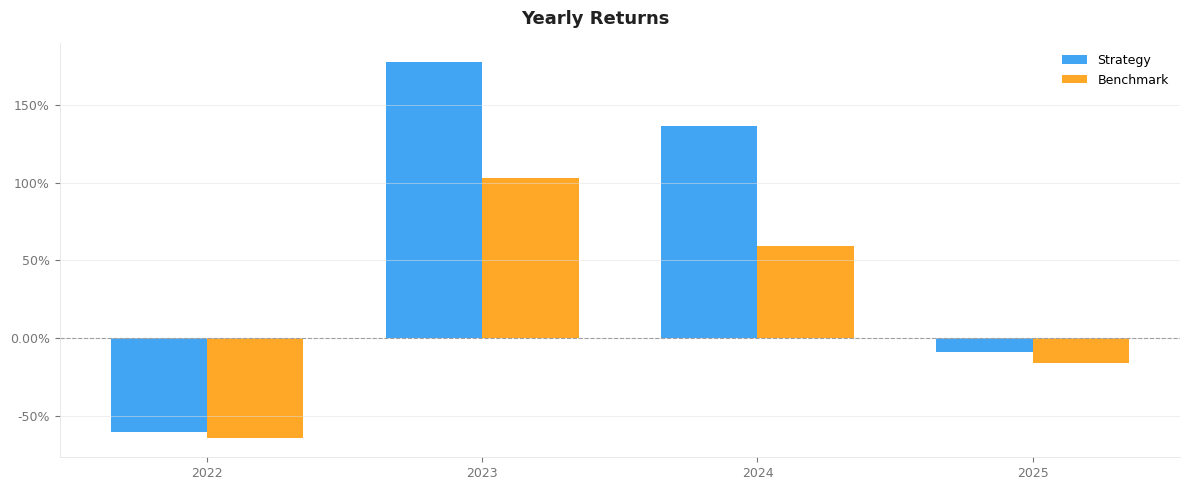
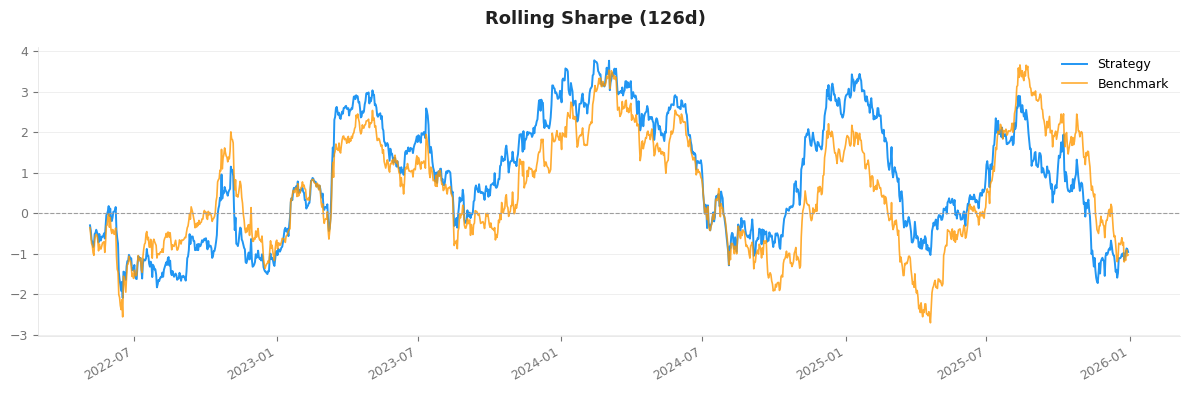
| Yearly returns | Rolling Sharpe |
|---|---|
 |
 |
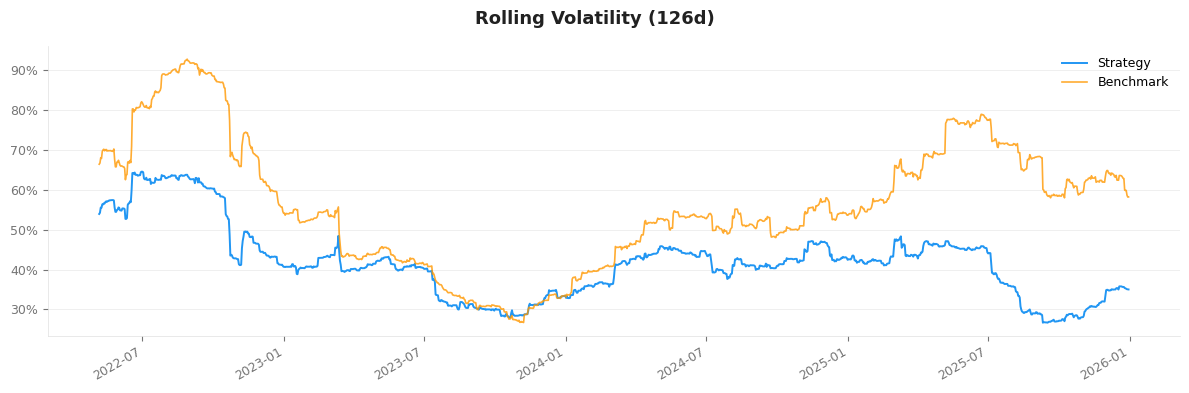
| Rolling volatility | Day-of-week returns |
|---|---|
 |
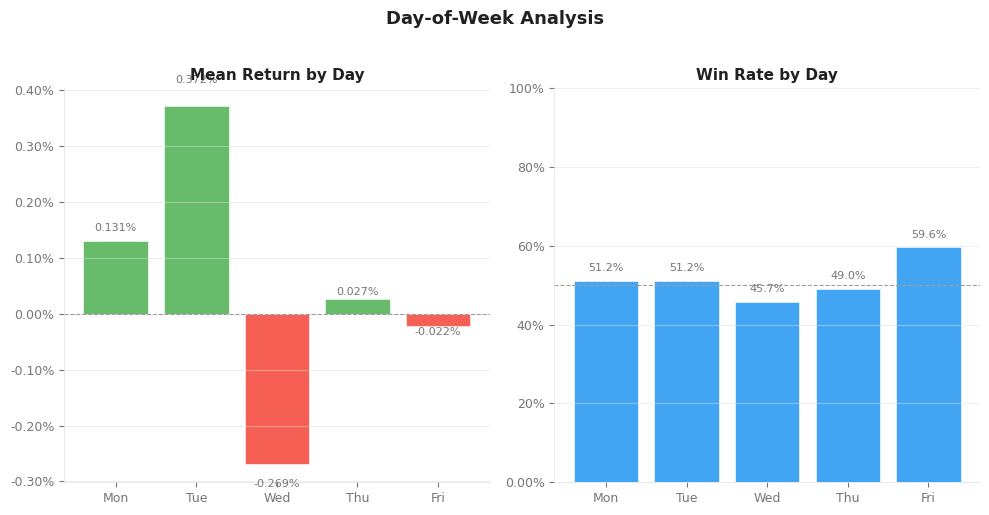 |
Those figures are also available in an HTML report generated by katsustats.reports.html().
How to use
Installation
As a Python library:
pip install katsustats
# or
uv add katsustats
As a standalone CLI (no script needed — just install and run):
pipx install katsustats   # recommended for CLI-only use
# or
uv tool install katsustats
Standalone binary (no Python needed at all):
Download a pre-built binary for your platform from the GitHub Releases page, make it executable, and run it directly:
# macOS / Linux
chmod +x katsustats-linux-x86_64
./katsustats-linux-x86_64 report trades.csv -o report.html
Try it online
Data format
katsustats accepts either a Polars or pandas DataFrame
with two required columns:
| column | type | description |
|---|---|---|
date |
date-like | Trading date |
returns |
float-like | Daily return (e.g. 0.01 = +1%) |
When a pandas DataFrame or Series is passed, katsustats converts it to
Polars at the start of processing.
If date is datetime-like, it is normalized to pl.Date before analysis.
If multiple rows share the same date, katsustats compounds those same-day
returns values into one daily return, emits a warning, and continues.
Quantstats-style inputs (pd.Series with a DatetimeIndex, or a
pd.DataFrame with a DatetimeIndex and a returns column) are
accepted automatically — the index is promoted to the date column.
Basic usage
import polars as pl
import katsustats

# Build your return series
returns = pl.DataFrame({
    "date": pl.date_range(pl.date(2020, 1, 1), pl.date(2023, 12, 31), "1d", eager=True),
    "returns": your_daily_returns,   # list / numpy array of floats
})

# Generate the full report (prints metrics + shows all plots)
results = katsustats.reports.full(returns)
Pandas inputs work too:
import pandas as pd

returns = pd.DataFrame({
    "date": dates,
    "returns": your_daily_returns,
})

results = katsustats.reports.full(returns)
Migrating from quantstats
If your existing code passes a pd.Series or a pd.DataFrame with a
DatetimeIndex (the quantstats convention), both work without modification:
import pandas as pd

# pd.Series with DatetimeIndex
returns = pd.Series(your_daily_returns, index=date_index, name="returns")
results = katsustats.reports.full(returns)

# pd.DataFrame with DatetimeIndex
returns = pd.DataFrame({"returns": your_daily_returns}, index=date_index)
results = katsustats.reports.full(returns)
See also the runnable examples in examples/quickstart.py, examples/with_benchmark.py, and examples/html_report.py.
results is a dict with the following keys:
| key | type | description |
|---|---|---|
summary |
dict[str, float] |
Raw numeric summary values |
metrics |
pl.DataFrame |
Summary metrics table |
drawdowns |
pl.DataFrame |
Top-5 drawdown periods |
dow_stats |
pl.DataFrame |
Day-of-week statistics |
figures |
dict[str, Figure] |
All 8 matplotlib figures |
With a benchmark
benchmark = pl.DataFrame({
    "date": pl.date_range(pl.date(2020, 1, 1), pl.date(2023, 12, 31), "1d", eager=True),
    "returns": benchmark_daily_returns,
})

results = katsustats.reports.full(returns, benchmark=benchmark)
When a benchmark is provided, the metrics table also includes Alpha, Beta, Correlation, Information Ratio, and Excess Return.
Advanced options
results = katsustats.reports.full(
    returns,
    benchmark=benchmark,
    rf=0.04,          # annualized risk-free rate (default 0.0)
    periods=252,      # trading days per year (default 252)
    show=False,       # suppress inline plot display
)
CLI
Generate an HTML tearsheet directly from a CSV or Parquet file — no script needed:
# From a CSV file (date and returns columns)
katsustats report trades.csv -o report.html

# Structured JSON for AI agents / downstream tooling
katsustats report trades.csv --format json -o report.json

# Markdown summary for humans and agents
katsustats report trades.csv --format markdown -o report.md

# Custom column names
katsustats report trades.csv --date-col day --returns-col pnl -o report.html

# With a benchmark and a custom title
katsustats report trades.csv --benchmark benchmark.csv --title "My Strategy" -o report.html

# From a Parquet file with a custom risk-free rate
katsustats report trades.parquet --rf 0.04 -o report.html

# Crypto data (365 days/year) with Monte Carlo
katsustats report crypto.csv --periods 365 --monte-carlo --mc-method bootstrap -o report.html
If -o is omitted the report is written alongside the input file (for example trades.html, trades.json, or trades.md).
HTML report
Generate a self-contained HTML report (similar to qs.reports.html()):
# Save to file
katsustats.reports.html(returns, benchmark=benchmark, title="My Strategy", output="report.html")

# Or get HTML string
html_str = katsustats.reports.html(returns, title="My Strategy")
The report includes headline metric cards, performance tables, period performance, drawdown analysis, day-of-week statistics, and all 8 charts embedded as images — all in a single .html file that works offline.
When a benchmark is provided, the HTML report also includes regime analysis.
View a BTC vs ETH backtest report.
JSON report
Generate an AI-friendly structured JSON report (see example):
# Save to file
katsustats.reports.json(returns, benchmark=benchmark, title="My Strategy", output="report.json")

# Or get JSON string
json_str = katsustats.reports.json(returns, title="My Strategy")
The JSON output is optimized for LLMs, agents, and other automation tools. It includes raw numeric metrics, structured period performance, top drawdowns, day-of-week statistics, and regime analysis when a benchmark is provided.
Markdown report
Generate a Markdown backtest summary (see example):
# Save to file
katsustats.reports.markdown(returns, benchmark=benchmark, title="My Strategy", output="report.md")

# Or get Markdown string
md_str = katsustats.reports.markdown(returns, title="My Strategy")
The Markdown output is designed to be readable in editors, GitHub, chat tools, and agent workflows. It includes an overview, headline metrics, performance tables, period performance, top drawdowns, day-of-week statistics, and optional regime analysis.
Monte Carlo simulation
Enable Monte Carlo analysis by passing monte_carlo=True to reports.html() or reports.full(). The simulation resamples your historical returns thousands of times (bootstrap by default) to show the range of outcomes that luck alone could have produced — keeping the same return distribution while breaking the original time order.
katsustats.reports.html(
    returns,
    output="report.html",
    monte_carlo=True,
    mc_sims=1000,       # number of simulated paths (default 1000)
    mc_bust=-0.20,      # optional: probability of hitting this drawdown
    mc_goal=0.50,       # optional: probability of reaching this return
    mc_seed=42,         # optional: reproducibility seed
    mc_method="bootstrap",  # "bootstrap" (default) or "shuffle"
)
The default bootstrap method samples returns with replacement, producing genuine variation in terminal return, Sharpe, and CAGR across paths. Use mc_method="shuffle" for the classic permutation approach (sampling without replacement), where terminal return is identical across all paths but max drawdown still varies due to path-dependent ordering.
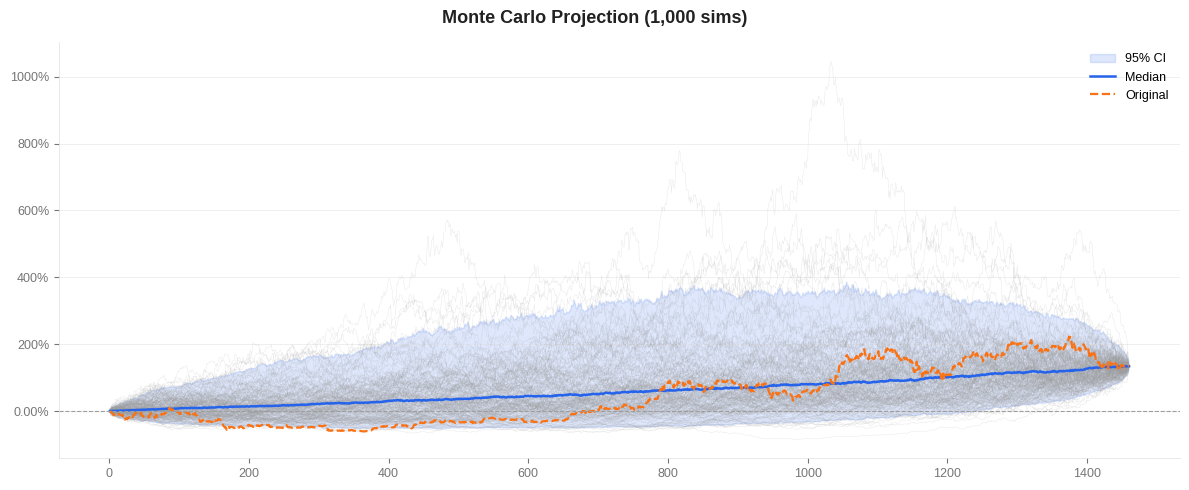
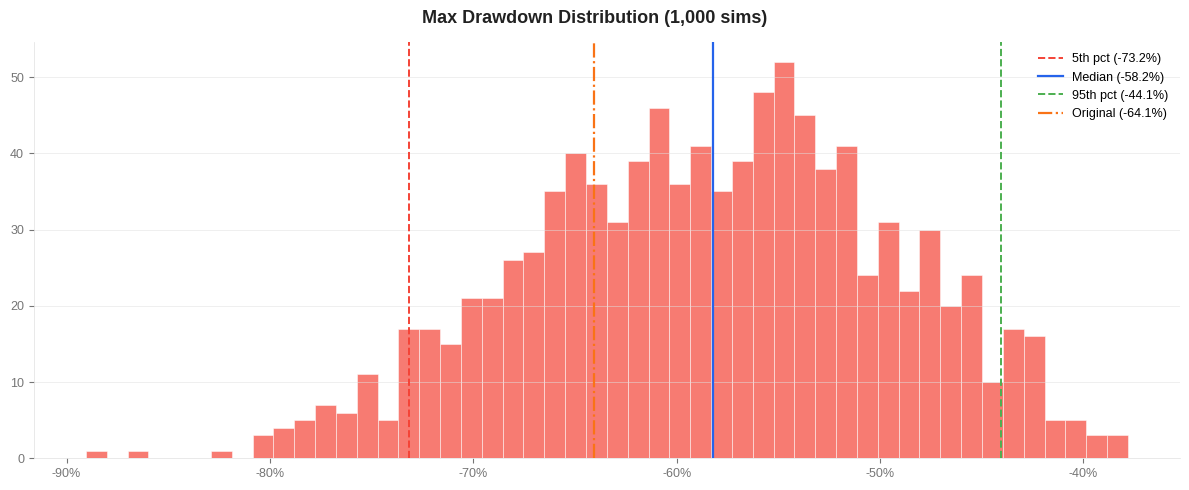
The HTML report adds two panels to the Monte Carlo section:
| Simulated paths | Max drawdown distribution |
|---|---|
 |
 |
- Simulated paths — fan of simulated cumulative return paths with the original path highlighted. Shows how differently the same returns could have played out under alternative orderings.
- Max drawdown distribution — histogram of the worst drawdown across each simulated path. Because drawdown is path-dependent (a run of losses early hurts far more than the same losses late), this distribution has genuine spread and tells you how lucky or unlucky your drawdown sequence was.
You can also call the underlying stats directly:
# Raw simulation paths as a wide Polars DataFrame
paths = katsustats.stats.monte_carlo_paths(returns, sims=1000, seed=42, method="bootstrap")

# Probabilistic summary: terminal return, max drawdown, Sharpe, CAGR distributions
summary = katsustats.stats.monte_carlo_summary(
    returns,
    sims=1000,
    bust=-0.20,   # drawdown threshold for bust probability
    goal=0.50,    # return threshold for goal probability
    seed=42,
    method="bootstrap",
)
Snapshot report
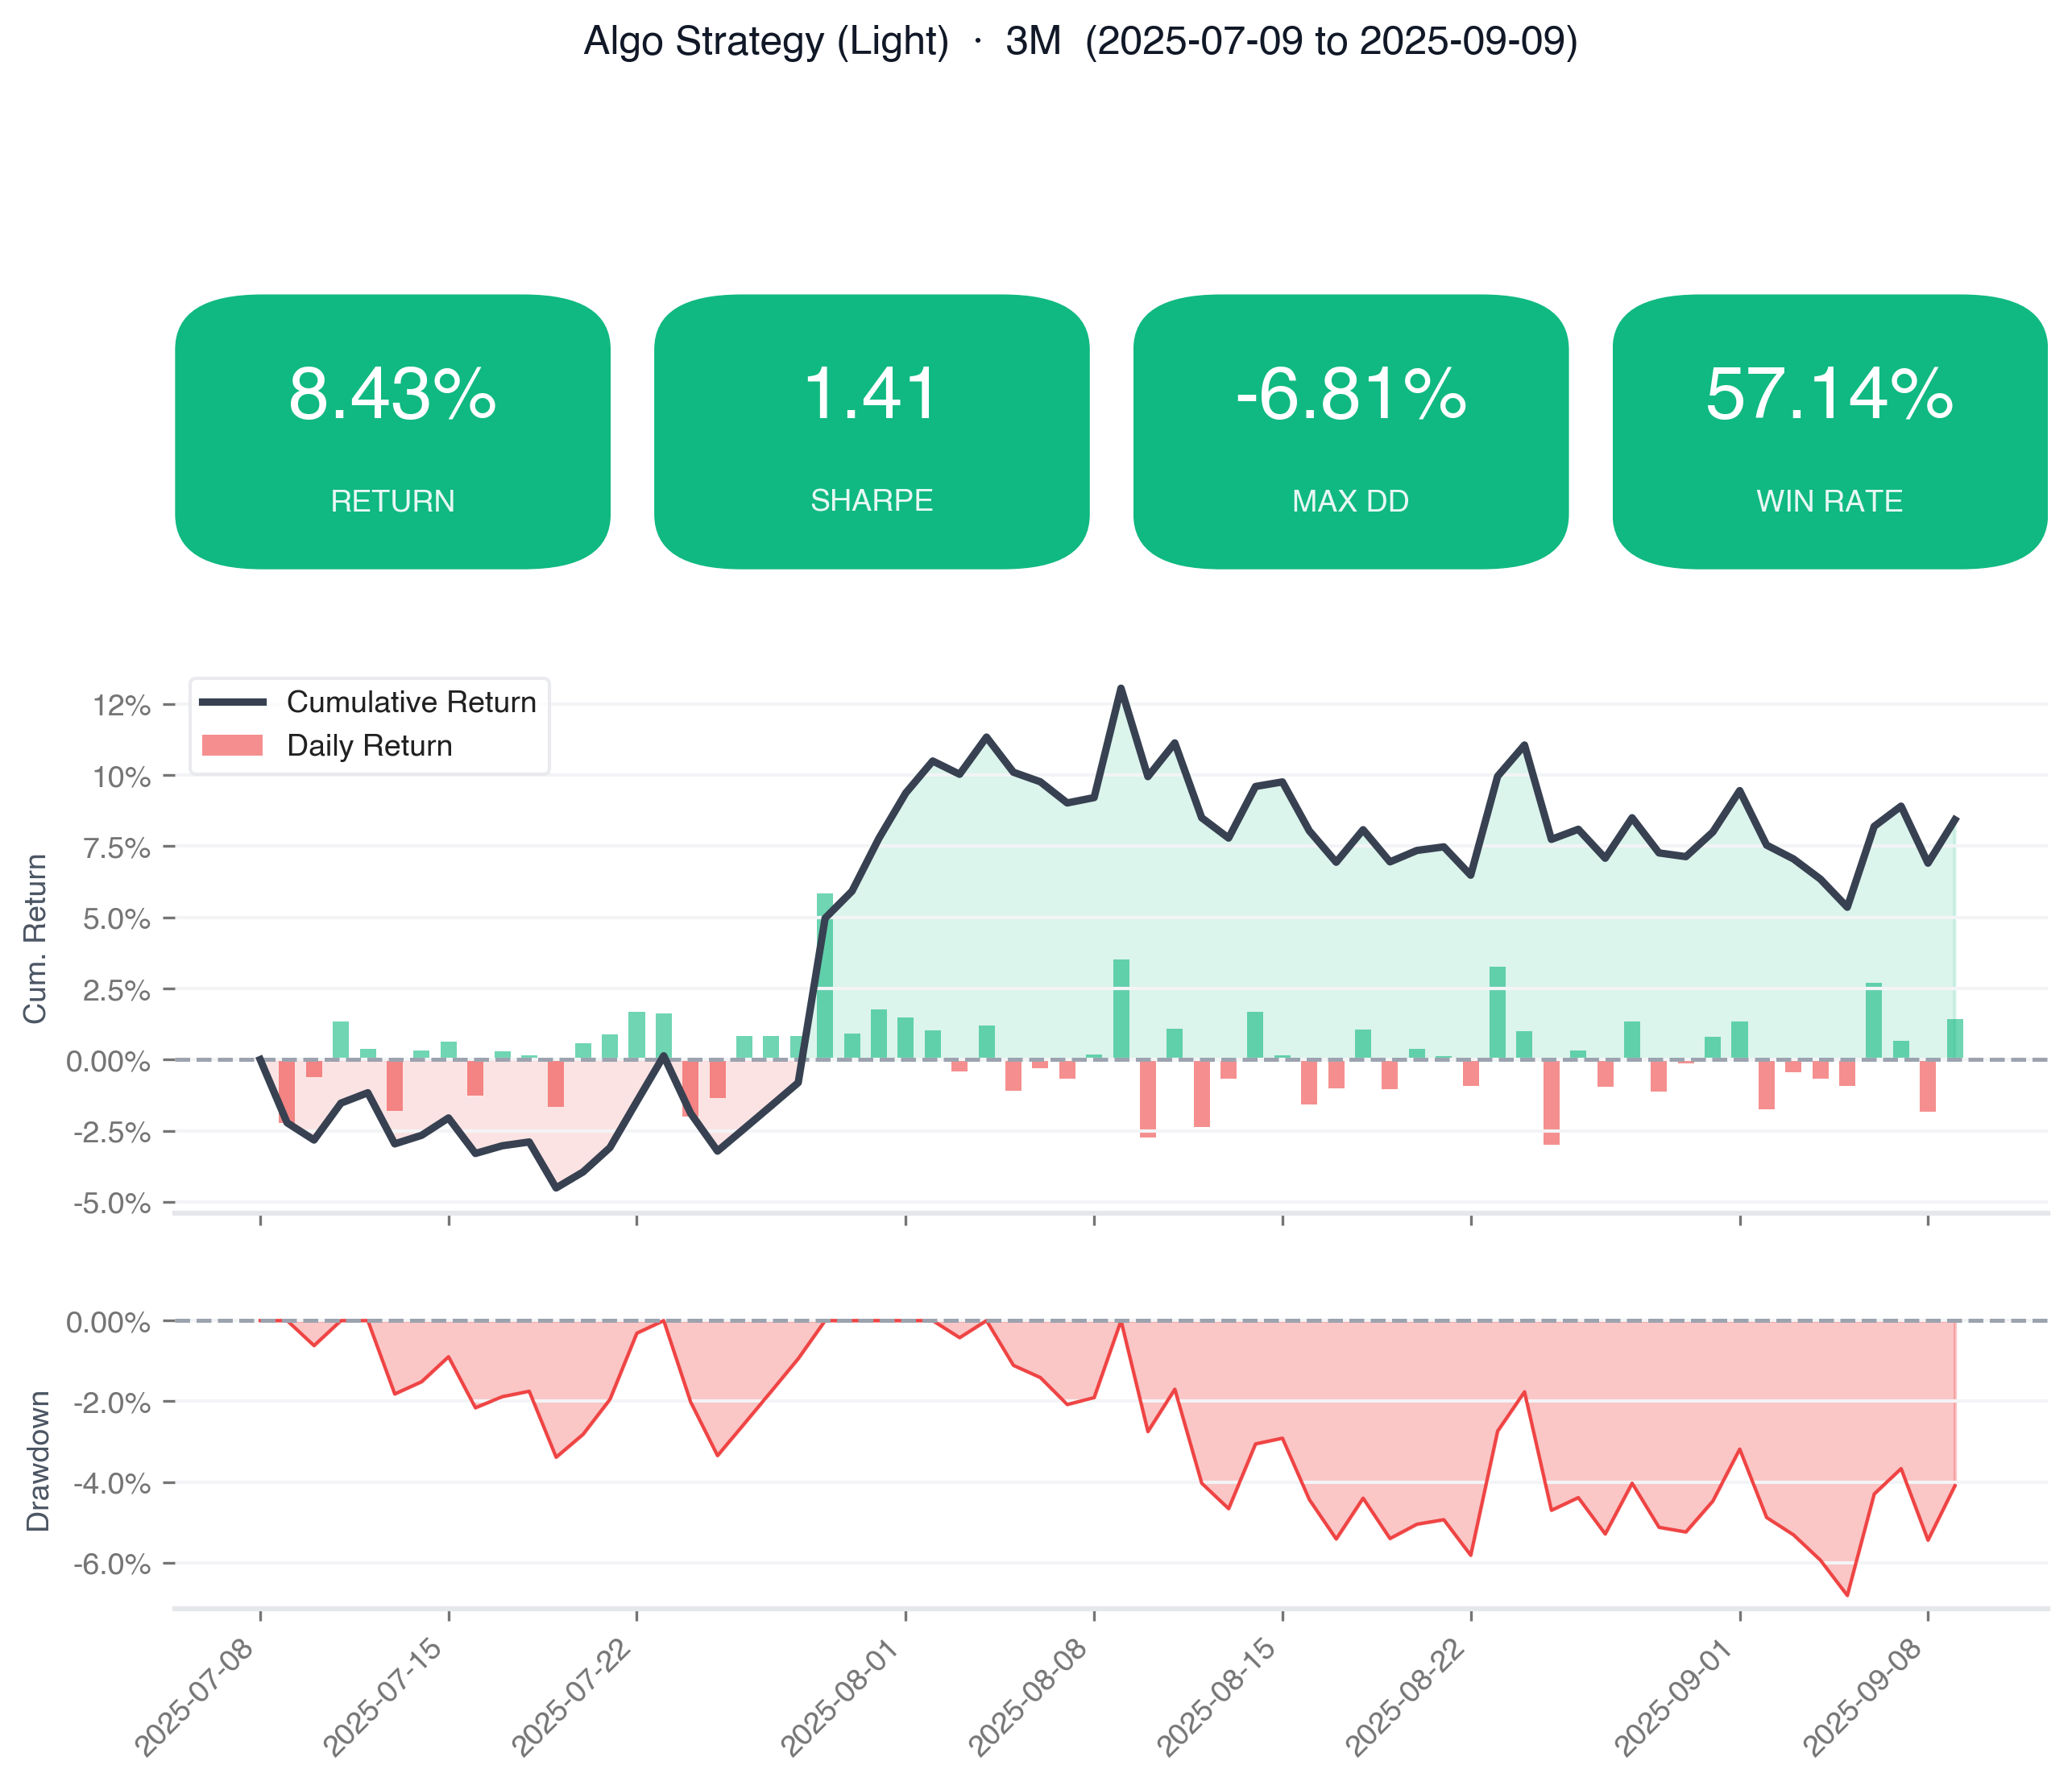
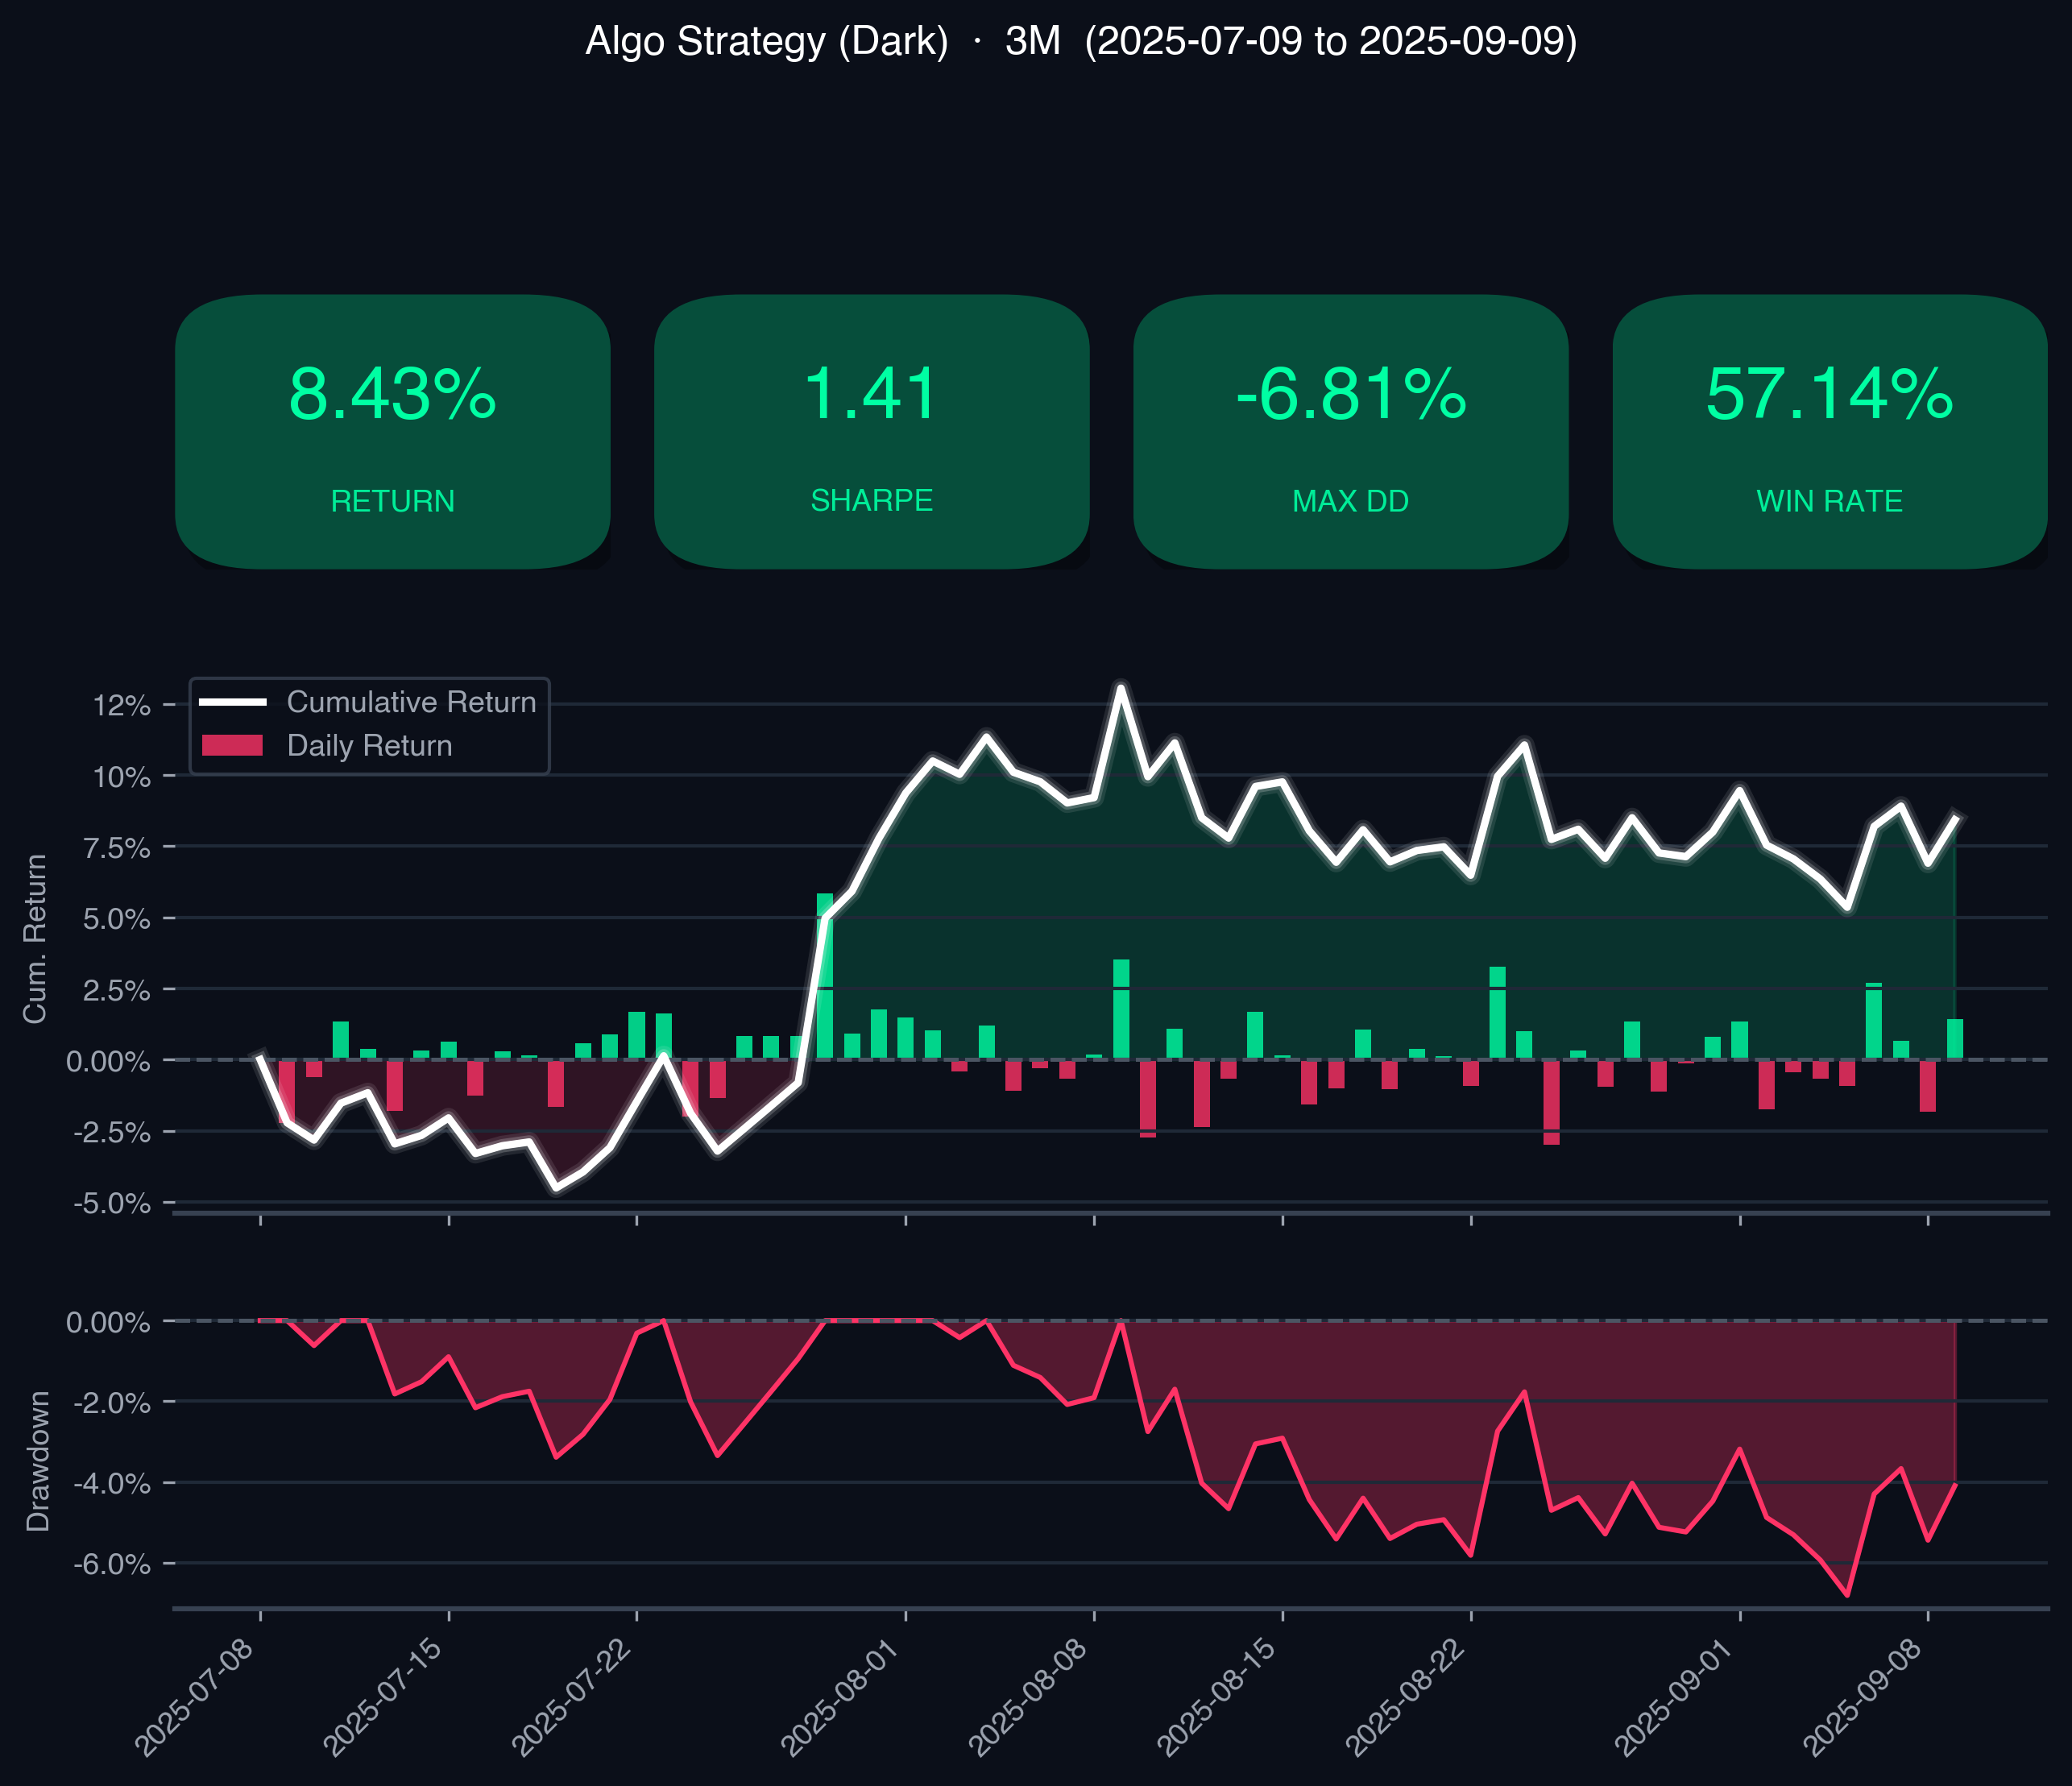
Generate a compact, single-image performance card (a "snapshot") showing key metrics, an equity curve, and underwater drawdowns. This is perfect for quick sharing on social media or in chat.
| Light Theme | Dark Theme |
|---|---|
 |
 |
Via CLI:
# Save a snapshot for the last 1 Month
katsustats snapshot trades.csv --window 1M -o snapshot.png

# Custom title and longer window
katsustats snapshot trades.csv --title "My Strategy" --window 3M -o snapshot.png

# Dark theme for social media sharing
katsustats snapshot trades.csv --theme dark -o snapshot.png
Via Python:
import katsustats

fig = katsustats.plots.plot_snapshot(returns, window="3M", title="My Strategy")
fig.savefig("snapshot.png")

# Dark mode
fig = katsustats.plots.plot_snapshot(returns, window="3M", title="My Strategy", theme="dark")
fig.savefig("snapshot_dark.png", facecolor=fig.get_facecolor())
Using individual modules
You can also call the lower-level APIs directly:
import katsustats

# --- Stats ---
katsustats.stats.total_return(returns)
katsustats.stats.cagr(returns)
katsustats.stats.sharpe(returns, rf=0.0)
katsustats.stats.sortino(returns)
katsustats.stats.max_drawdown(returns)
katsustats.stats.calmar(returns)
katsustats.stats.volatility(returns)
katsustats.stats.win_rate(returns)
katsustats.stats.profit_factor(returns)
katsustats.stats.value_at_risk(returns, alpha=0.05)

katsustats.stats.drawdown_details(returns, top_n=5)      # pl.DataFrame
katsustats.stats.day_of_week_stats(returns)              # pl.DataFrame
katsustats.stats.summary_metrics(returns, benchmark)     # pl.DataFrame

# --- Plots ---
katsustats.plots.plot_cumulative_returns(returns, benchmark)
katsustats.plots.plot_drawdown(returns)
katsustats.plots.plot_monthly_heatmap(returns)
katsustats.plots.plot_yearly_returns(returns, benchmark)
katsustats.plots.plot_return_distribution(returns, benchmark)
katsustats.plots.plot_rolling_sharpe(returns, benchmark)
katsustats.plots.plot_rolling_volatility(returns, benchmark)
katsustats.plots.plot_dow_returns(returns)
Metrics produced
| metric | description |
|---|---|
| Total Return | Compounded return over the full period |
| CAGR | Compound Annual Growth Rate |
| Sharpe Ratio | Annualized risk-adjusted return |
| Sortino Ratio | Sharpe using only downside deviation |
| Max Drawdown | Largest peak-to-trough decline |
| Calmar Ratio | CAGR / |Max Drawdown| |
| Volatility (ann.) | Annualized standard deviation |
| Win Rate | % of days with positive returns |
| Profit Factor | Gross profit / gross loss |
| Best / Worst Day | Largest single-day gain / loss |
| Avg Win / Avg Loss | Mean return on winning / losing days |
| Daily VaR (95%) | 5th-percentile daily return |
| CVaR (95%) | Mean return in the worst 5% tail |
| Recovery Factor | Total return / |Max Drawdown| |
| Skewness / Kurtosis | Distribution shape statistics |
| Best / Worst Month | Largest / smallest monthly return |
| Best / Worst Year | Largest / smallest yearly return |
| Positive Months / Years | Share of profitable months / years |
When a benchmark is provided, katsustats also reports Alpha, Beta, Correlation, Information Ratio, and Excess Return.
Project details
Verified details
These details have been verified by PyPIProject links
GitHub Statistics
Maintainers
Release history Release notifications | RSS feed


Download files
Download the file for your platform. If you're not sure which to choose, learn more about installing packages.
Source Distribution
Built Distribution
Filter files by name, interpreter, ABI, and platform.
If you're not sure about the file name format, learn more about wheel file names.
Copy a direct link to the current filters
File details
Details for the file katsustats-0.8.0.tar.gz.
File metadata
- Download URL: katsustats-0.8.0.tar.gz
- Upload date:
- Size: 866.6 kB
- Tags: Source
- Uploaded using Trusted Publishing? Yes
- Uploaded via: twine/6.1.0 CPython/3.13.12
File hashes
| Algorithm | Hash digest | |
|---|---|---|
| SHA256 |
376606d16e7495a2c84efaf9f30cd992fab3dcb079a4c2623a6d094ffcdbd1c8
|
|
| MD5 |
83097acbb038679315359eec6a6b1f3b
|
|
| BLAKE2b-256 |
a27565d38c683a16fbadd88a2361d45e372bcdb4ac4c3e08c4e9e3f550f198c0
|
Provenance
The following attestation bundles were made for katsustats-0.8.0.tar.gz:
Publisher:
publish.yml on katsu1110/katsustats
-
Statement:
-
Statement type:
https://in-toto.io/Statement/v1 -
Predicate type:
https://docs.pypi.org/attestations/publish/v1 -
Subject name:
katsustats-0.8.0.tar.gz -
Subject digest:
376606d16e7495a2c84efaf9f30cd992fab3dcb079a4c2623a6d094ffcdbd1c8 - Sigstore transparency entry: 2116607996
- Sigstore integration time:
-
Permalink:
katsu1110/katsustats@48d085e10b9a3bd178f0ac1b6b7e8fc87de284ea -
Branch / Tag:
refs/tags/v0.8.0 - Owner: https://github.com/katsu1110
-
Access:
public
-
Token Issuer:
https://token.actions.githubusercontent.com -
Runner Environment:
github-hosted -
Publication workflow:
publish.yml@48d085e10b9a3bd178f0ac1b6b7e8fc87de284ea -
Trigger Event:
release
-
Statement type:
File details
Details for the file katsustats-0.8.0-py3-none-any.whl.
File metadata
- Download URL: katsustats-0.8.0-py3-none-any.whl
- Upload date:
- Size: 48.2 kB
- Tags: Python 3
- Uploaded using Trusted Publishing? Yes
- Uploaded via: twine/6.1.0 CPython/3.13.12
File hashes
| Algorithm | Hash digest | |
|---|---|---|
| SHA256 |
39777c8bc187a00b1023c0e0cd9b22b468ee66b0c9562e00940697abcbe5a985
|
|
| MD5 |
79c5dd0d65f8d305cc2f96f194e7e359
|
|
| BLAKE2b-256 |
73ad1005988b00749cdd038d6480642d5c49bc96fd1dc85f6f9c84b8000143fd
|
Provenance
The following attestation bundles were made for katsustats-0.8.0-py3-none-any.whl:
Publisher:
publish.yml on katsu1110/katsustats
-
Statement:
-
Statement type:
https://in-toto.io/Statement/v1 -
Predicate type:
https://docs.pypi.org/attestations/publish/v1 -
Subject name:
katsustats-0.8.0-py3-none-any.whl -
Subject digest:
39777c8bc187a00b1023c0e0cd9b22b468ee66b0c9562e00940697abcbe5a985 - Sigstore transparency entry: 2116608101
- Sigstore integration time:
-
Permalink:
katsu1110/katsustats@48d085e10b9a3bd178f0ac1b6b7e8fc87de284ea -
Branch / Tag:
refs/tags/v0.8.0 - Owner: https://github.com/katsu1110
-
Access:
public
-
Token Issuer:
https://token.actions.githubusercontent.com -
Runner Environment:
github-hosted -
Publication workflow:
publish.yml@48d085e10b9a3bd178f0ac1b6b7e8fc87de284ea -
Trigger Event:
release
-
Statement type:






