Kesh Utils for Data science/EDA/Data preparation

Project description
Chart + Util = Chartil
During EDA/data preparation stage, I use few fixed chart types to analyse the relation among various features. Few are simple chart like univariate and some are complex 3D or even multiple features>3.
Over the period it became complex to maintain all relevant codes or repeat codes. Instead I developed a simple, single api to plot various type of relations which will hide all technical/code details from Data Science task and approch.
Using this approach I just need one api
from KUtils.eda import chartil
chartil.plot(dataframe, [list of columns]) or
chartil.plot(dataframe, [list of columns], {optional_settings})
Demo code:
Load UCI Dataset. Download From here
heart_disease_df = pd.read_csv('../input/uci/heart.csv')
heart_disease_df['age_bin'] = pd.cut(heart_disease_df['age'], [0, 32, 40, 50, 60, 70, 100], labels=['<32', '33-40','41-50','51-60','61-70', '71+']) heart_disease_df['sex'] = heart_disease_df['sex'].map({1:'Male', 0:'Female'})
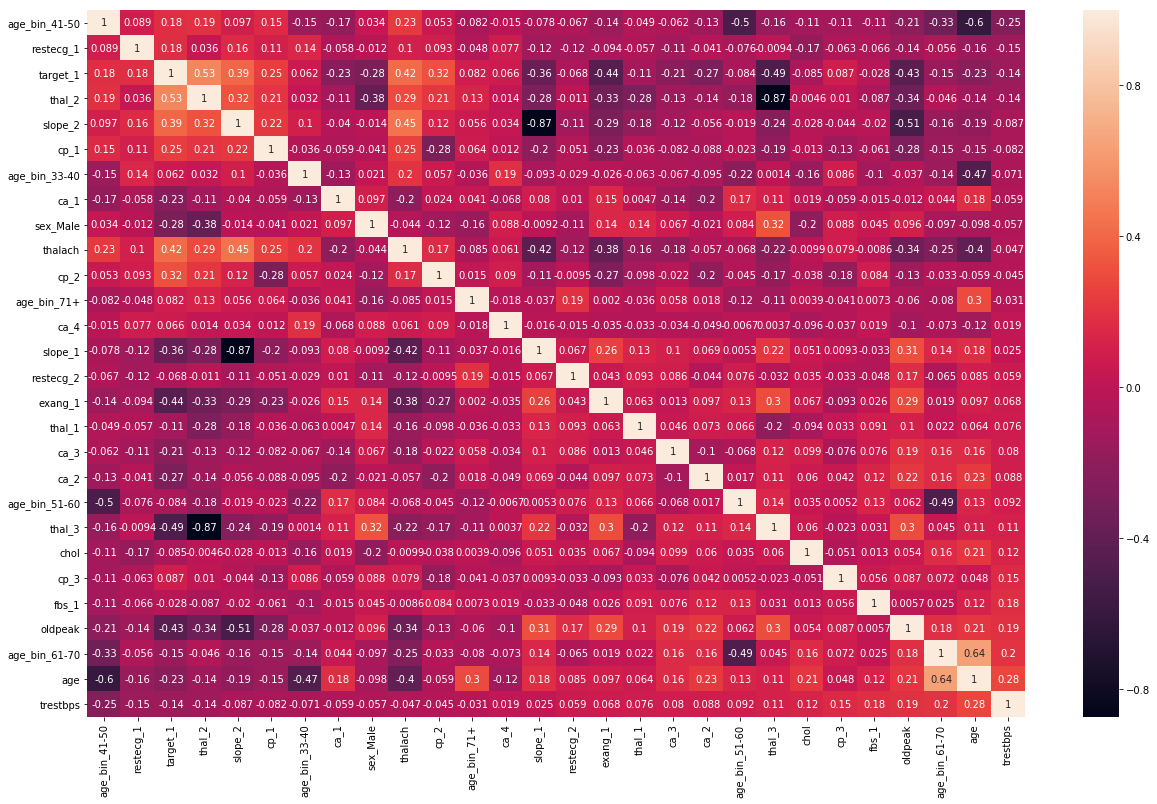
Heatmap
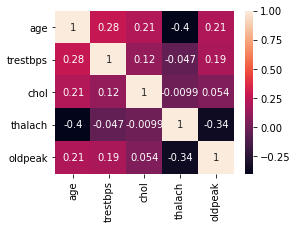
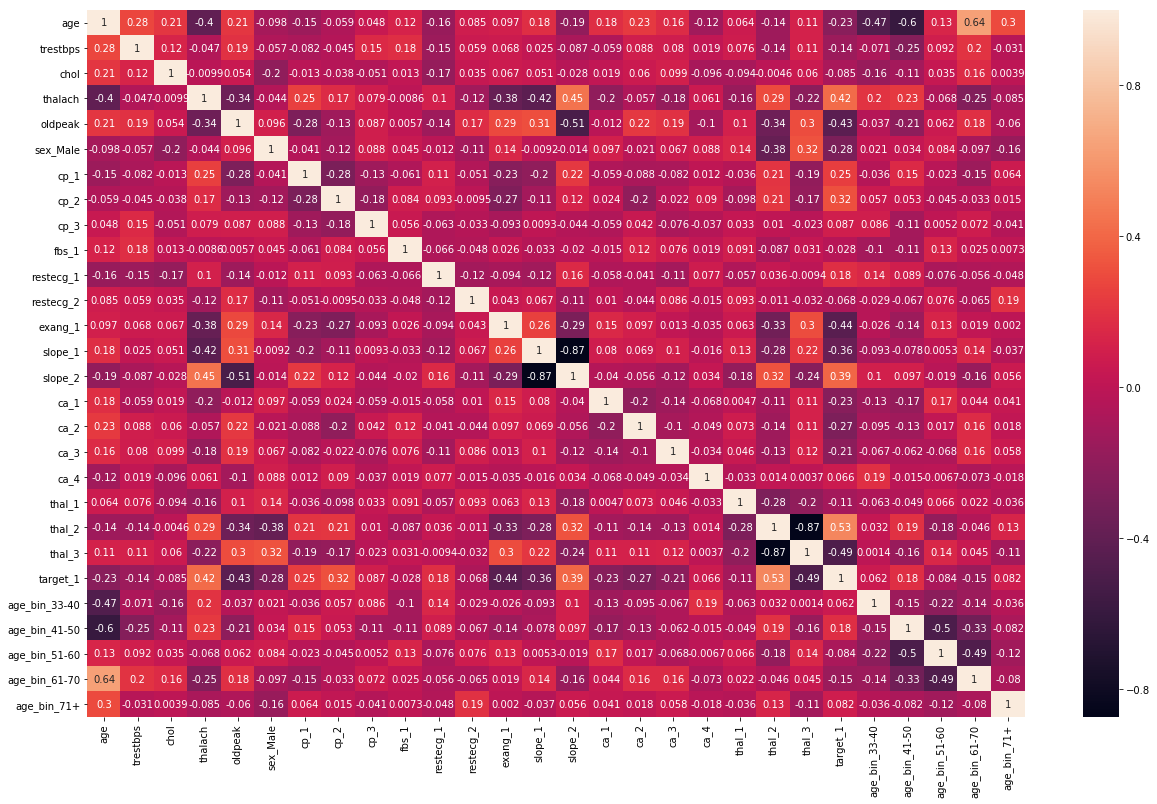
chartil.plot(heart_disease_df, heart_disease_df.columns) # Send all column names ![Heatmap Numerical] (https://raw.githubusercontent.com/KeshavShetty/ds/master/Roughbook/misc_resources/heatmap1.png) chartil.plot(heart_disease_df, heart_disease_df.columns, optional_settings={'include_categorical':True} ) ![Heatmap With categorical] (https://raw.githubusercontent.com/KeshavShetty/ds/master/Roughbook/misc_resources/heatmap2.png) chartil.plot(heart_disease_df, heart_disease_df.columns, optional_settings={'include_categorical':True, 'sort_by_column':'trestbps'} ) ![Heatmap With categorical and ordered by a column] (https://raw.githubusercontent.com/KeshavShetty/ds/master/Roughbook/misc_resources/heatmap3.png)
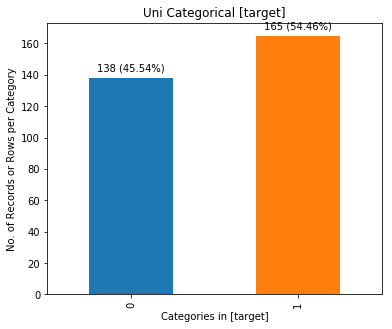
Uni-categorical
chartil.plot(heart_disease_df, ['target']) # Barchart as count plot
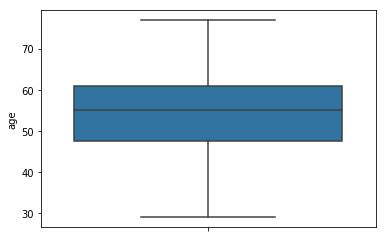
Uni-Continuous
chartil.plot(heart_disease_df, ['age']) # boxplot
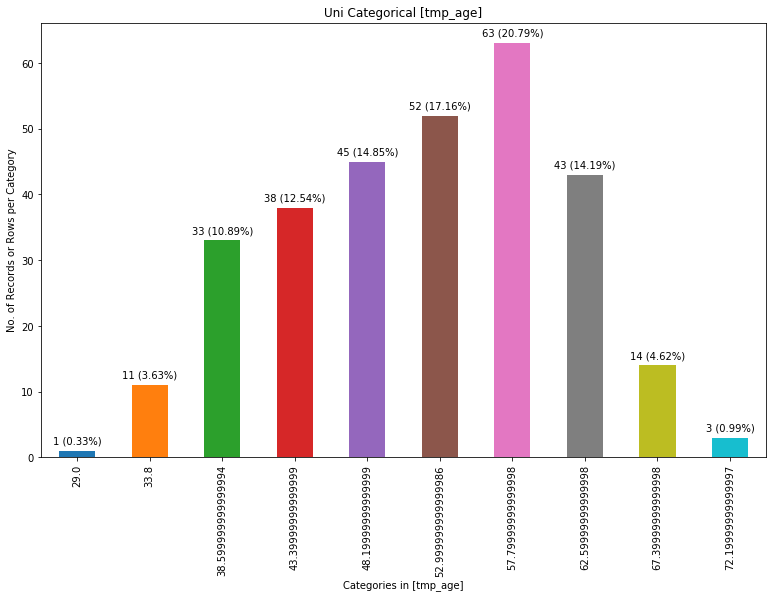
chartil.plot(heart_disease_df, ['age'], chart_type='barchart') # Force barchart on cntinuous by auto creating 10 equal bins
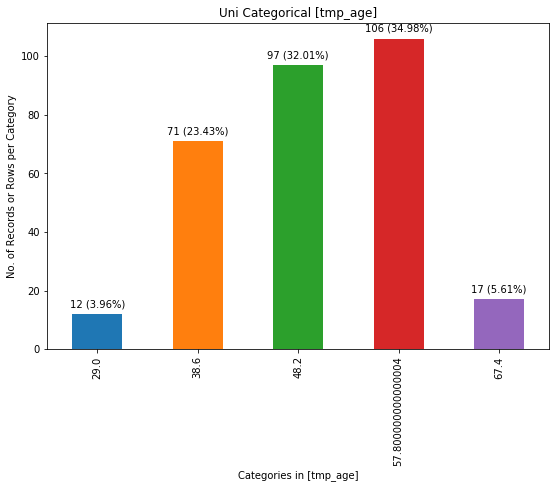
chartil.plot(heart_disease_df, ['age'], chart_type='barchart', optional_settings={'no_of_bins':5}) # Create custom number of bins
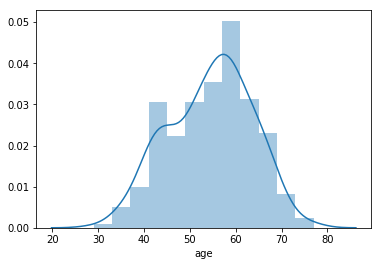
chartil.plot(heart_disease_df, ['age'], chart_type='distplot')
Uni-categorical with optional_settings
chartil.plot(heart_disease_df, ['age_bin']) # Barchart as count plot chartil.plot(heart_disease_df, ['age_bin'], optional_settings={'sort_by_value':True}) chartil.plot(heart_disease_df, ['age_bin'], optional_settings={'sort_by_value':True, 'limit_bars_count_to':5})
Bi Category vs Category (& Univariate Segmented)
chartil.plot(heart_disease_df, ['sex', 'target']) chartil.plot(heart_disease_df, ['sex', 'target'], chart_type='crosstab') chartil.plot(heart_disease_df, ['sex', 'target'], chart_type='stacked_barchart')
Bi Continuous vs Continuous
chartil.plot(heart_disease_df, ['chol', 'thalach']) # Scatter plot
Bi Continuous vs Category
chartil.plot(heart_disease_df, ['thalach', 'sex']) # Grouped box plot (Segmented univariate) chartil.plot(heart_disease_df, ['thalach', 'sex'], chart_type='distplot') # Distplot
Multi 3 Continuous
chartil.plot(heart_disease_df, ['chol', 'thalach', 'trestbps']) # Colored 3D scatter plot
Multi 3 Categorical
chartil.plot(heart_disease_df, ['age_bin', 'sex', 'target']) # Paired barchart
Multi 2 Continuous, 1 Category
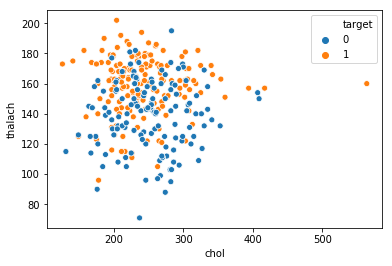
chartil.plot(heart_disease_df, ['chol', 'thalach', 'target']) # Scatter plot with colored groups
Multi 1 Continuous, 2 Category
chartil.plot(heart_disease_df, ['thalach', 'sex', 'target']) # Grouped boxplot chartil.plot(heart_disease_df, ['thalach', 'sex', 'target'], chart_type='violinplot') # Grouped violin plot
Multi 3 Continuous, 1 category
chartil.plot(heart_disease_df, ['chol', 'thalach', 'trestbps', 'target']) # Group Color highlighted 3D plot
Multi 3 Continuous, 2 category
chartil.plot(heart_disease_df, ['sex','cp','target','thalach','trestbps']) # Paired scatter plot
Release history Release notifications | RSS feed


Download files
Download the file for your platform. If you're not sure which to choose, learn more about installing packages.
Source Distribution
Built Distribution
Filter files by name, interpreter, ABI, and platform.
If you're not sure about the file name format, learn more about wheel file names.
Copy a direct link to the current filters
File details
Details for the file kesh-utils-0.1.8.tar.gz.
File metadata
- Download URL: kesh-utils-0.1.8.tar.gz
- Upload date:
- Size: 12.2 kB
- Tags: Source
- Uploaded using Trusted Publishing? No
- Uploaded via: twine/1.13.0 pkginfo/1.5.0.1 requests/2.21.0 setuptools/40.6.3 requests-toolbelt/0.9.1 tqdm/4.29.1 CPython/3.6.8
File hashes
| Algorithm | Hash digest | |
|---|---|---|
| SHA256 |
347c934c5f559d29333a5c06eb64797a3b1337f9cebc8a89782d8ffe281c235e
|
|
| MD5 |
a437b9039411b20dbeaf8bff530acdd5
|
|
| BLAKE2b-256 |
68cea7839fbe60603db4feed2adfd623bdb0a6f68851309fdf8f0906988db5f2
|
File details
Details for the file kesh_utils-0.1.8-py3-none-any.whl.
File metadata
- Download URL: kesh_utils-0.1.8-py3-none-any.whl
- Upload date:
- Size: 13.0 kB
- Tags: Python 3
- Uploaded using Trusted Publishing? No
- Uploaded via: twine/1.13.0 pkginfo/1.5.0.1 requests/2.21.0 setuptools/40.6.3 requests-toolbelt/0.9.1 tqdm/4.29.1 CPython/3.6.8
File hashes
| Algorithm | Hash digest | |
|---|---|---|
| SHA256 |
c8f44085acbfaf3621a3d8e0d1dbbf424726b87ea3c434a2345ffc61aff266fd
|
|
| MD5 |
ec6b4bbe150988e4a5298e87add07100
|
|
| BLAKE2b-256 |
9eb350f30ee6cfc8db4336797e6f744ab83266bf8a9edf70a91db18cb0893504
|


