

Landfall





Landfall turns geographic data into static map images with a small Python API.
Plot points, routes, polygons, and circles; combine layers; or read GeoJSON and
GeoPandas data. It is built on py-staticmaps
by Florian Pigorsch, which supplies map tiles, framing, and rendering. Landfall
keeps the native py-staticmaps API available through landfall.Context, so
you can use its map objects, tile providers, context controls, and renderers
directly alongside Landfall helpers. See the
guide to the full py-staticmaps API.
Landfall's convenience functions return Pillow
images.
For geohash or H3 heatmaps from point observations, see the companion Heatfall documentation.
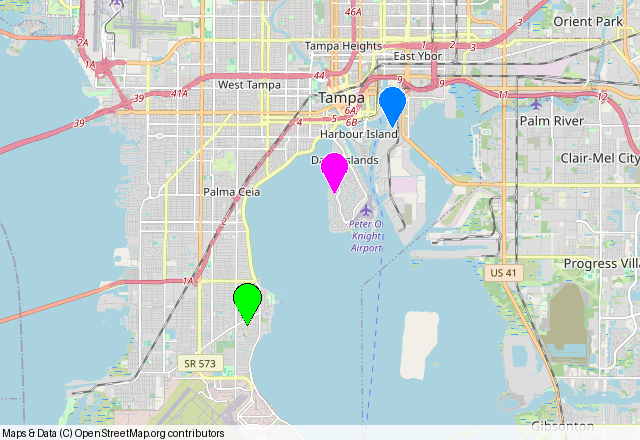
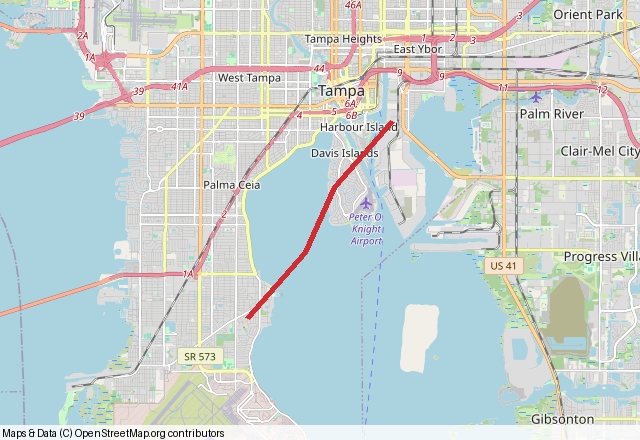
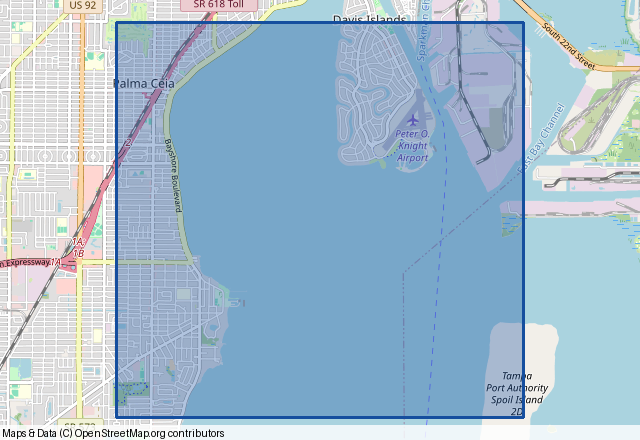
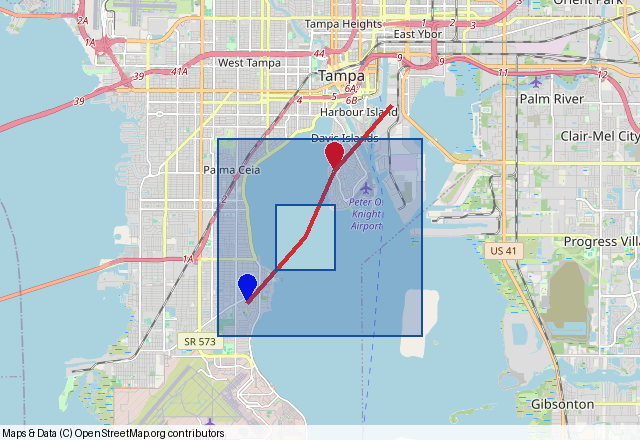
Routes · translucent areas · layered maps
Install
Landfall supports Python 3.8–3.13. Install the optional geo extra for
GeoPandas and Shapely integration.
python -m pip install landfall
python -m pip install 'landfall[geo]'  # optional
python -m pip install 'landfall[cairo]'  # optional anti-aliased PNG output
The default OpenStreetMap tile provider needs network access when rendering.
If you use a different tile provider, pass a py-staticmaps provider through
tile_provider or configure a Context directly. Providers that need a URL
API key accept api_key= in plot functions or
context.set_tile_provider(provider, api_key=...). The optional cairo extra
enables anti-aliased PNG output through Context.render_cairo().
Make a map
import landfall

image = landfall.plot_points(
    [(27.88, -82.49), (27.92, -82.46), (27.94, -82.44)],
    colors="distinct",
    point_size=14,
    window_size=(640, 440),
    zoom=-1,
)
image.save("tampa-points.png")
Native coordinate pairs are (latitude, longitude). GeoJSON and Shapely
positions are (longitude, latitude); Landfall converts them. For native
inputs already in longitude/latitude order, use flip_coords=True.
Every plot_* function returns a PIL.Image.Image. Use Context when a map
needs multiple kinds of shapes or an SVG result:
map_context = landfall.Context()
map_context.add_points([27.88, 27.92], [-82.49, -82.46], colors="distinct")
map_context.add_line([(27.88, -82.49), (27.92, -82.46)], color="red")
map_context.add_circle(27.88, -82.49, 1000, fill_color="#ff000064")
map_context.render_pillow(800, 600).save("combined.png")
map_context.render_svg(800, 600).saveas("combined.svg")
More maps you can run
route = [(27.88, -82.49), (27.90, -82.47),
         (27.92, -82.46), (27.94, -82.44)]
landfall.plot_line(
    route, color="#d12c31", width=5, window_size=(640, 440), zoom=-1
).save("route.png")
landfall.plot_circle(
    27.88, -82.49, 1000,
    color="#9b2727", fill_color="#d12c3155", width=3,
    window_size=(640, 440),
).save("coverage.png")
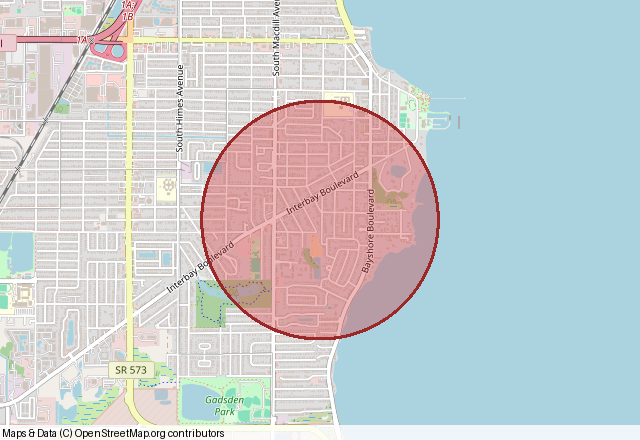
Circle radii are in meters by default; set radius_unit="kilometers" for
kilometers. Colors can be names, hex values, RGB/RGBA tuples, or
staticmaps.Color objects. Batch functions also accept the "distinct",
"random", and "wheel" palettes.
The checked-in images above were generated with
examples/generate_doc_maps.py using real
OpenStreetMap tiles; tile attribution appears in each image.
Documentation
Read the full documentation on Read the Docs.
| Start here | What you will find |
|---|---|
| Getting started | Installation, coordinates, first maps, and image output |
| Working with shapes | Layers, colors, groups, polygon holes, and circles |
| Full py-staticmaps API | Native map objects, context controls, tile providers, and renderers |
| GeoJSON and GeoPandas | Files, features, coordinate systems, and styling |
| API reference | Public functions, parameters, defaults, and return values |
| Troubleshooting | Common errors, tile access, and optional dependencies |
| Contributing | Local setup, checks, and release validation |
The documentation index also links to example notebooks. For release history, see the changelog.
Support and license
Report bugs or request features through GitHub Issues. Landfall is released under the MIT license. The underlying py-staticmaps project was created by Florian Pigorsch and is also MIT licensed; see its upstream license.
1 maintainer

Metadata
1 maintainer
Release files for landfall 0.5.0
For a detailed explanation of source distributions (sdists) and built distributions (wheels), please see the package formats documentation.
Source distribution (sdist)
| File | Size | Uploaded | |
|---|---|---|---|
| landfall-0.5.0.tar.gz | 35.2 kB | Details |
Built distribution (wheel)
| File | Interpreter | ABI | Platform | Reset |
|---|---|---|---|---|
| landfall-0.5.0-py3-none-any.whl | Python 3 | none | any | Details |
Total release size: 58.6 kB
Release files / landfall-0.5.0.tar.gz
| Download URL | landfall-0.5.0.tar.gz |
|---|---|
| Size | 35.2 kB |
| Tags | Source |
|
SHA-256 checksum How to use checksums |
267715ac820d21ca0bf9f492b232c6d69bef02edaf5db188605a197f2a691d38
|
|
BLAKE2b-256 checksum How to use checksums |
b9034f0b82f682f843a7c6a15521fca11c4633ce3446d04cd5b84f62a4f05462
|
| Upload date | |
|
Uploaded using Trusted Publishing? What is trusted publishing? |
Yes |
| Uploaded via |
twine/7.0.0 CPython/3.13.14
|
Provenance
Provenance describes where a file came from. On PyPI, provenance is shared via attestations, which provide a verifiable record of the build or publishing details. View details, limitations and caveats.


PyPI Publish Attestation
PyPI verified that this artifact, at this checksum, originated from the publisher listed below.
Signed by GitHub Actions, verified by PyPI on Oct 6, 2026.
Transparency logRelease files / landfall-0.5.0-py3-none-any.whl
| Download URL | landfall-0.5.0-py3-none-any.whl |
|---|---|
| Size | 23.3 kB |
| Tags | Python 3 |
|
SHA-256 checksum How to use checksums |
3d5a779a8bcb91da7c2c12ca905ce332f0b4389bb30abc1a52fca1ca1b675f8c
|
|
BLAKE2b-256 checksum How to use checksums |
0e0d4f53babbd46552b9c2938e56a01ea2eb170beee0bdd3eddff42a18ec5da7
|
| Upload date | |
|
Uploaded using Trusted Publishing? What is trusted publishing? |
Yes |
| Uploaded via |
twine/7.0.0 CPython/3.13.14
|
Provenance
Provenance describes where a file came from. On PyPI, provenance is shared via attestations, which provide a verifiable record of the build or publishing details. View details, limitations and caveats.
PyPI Publish Attestation
PyPI verified that this artifact, at this checksum, originated from the publisher listed below.
Signed by GitHub Actions, verified by PyPI on Oct 6, 2026.
Transparency log













