A Qt GUI to run and display line by line profiling data using line_profiler

Project description


This is a Qt GUI for the line_profiler python utility.
It allows to run and display the profiling results using an interactive interface. It is functionnaly equivalent to the kernprof script, which is used to invoque line_profiler from the command line.
Features
Command line: Configure and run from the command line, just like kernprof,
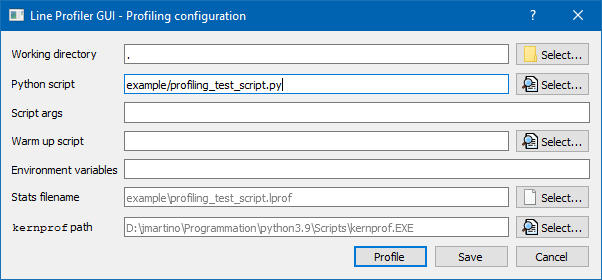
GUI: Configure and run from the GUI, just like kernprof but with buttons,
Colors: Highlight lines based on the percentage of time spent on them to easily spot the lines to be optimised,
Configuration: Setup warmup script, environment variables, and more!
History: Compare timing with previous profiling runs,
Viewer: Display data from any .lprof file by kernprof,
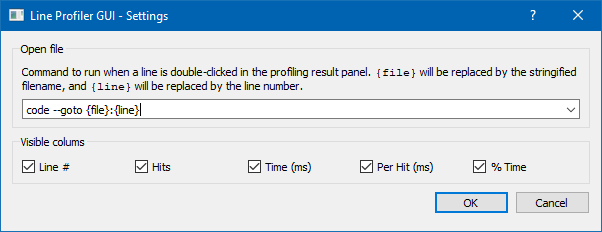
Editor: Double-click on any line to edit it with your favorite editor.
Installation
Line Profiler GUI can be installed from pypi using pip:
$ pip install line-profiler-gui
Line Profiler GUI can use anyon of the Qt python bindings by using QtPy: PyQt5, PyQt6, PySide2 or PySide6. You can install the Qt python bindings of your choice in one go by specifying it between square brackets:
$ pip install line-profiler-gui[PySide2]
$ pip install line-profiler-gui[PyQt5]
Source releases can be downloaded from PyPI. To check out the development sources, you can use Git:
$ git clone https://github.com/Nodd/lineprofilergui.git
Usage
Users should be familiar with the line_profiler line_profiler documentation, but here is a quick reminder. Since the line by line profiling slown down the execution, not all functions are profiled. The functions to be profiled have to be marked with a @profile decorator (see the example/ directory for more examples):
@profile
def my_slow_function():
    ...
No import is needed, profile is added to the python builtins for the execution. Don’t forget to remove the added decorators afterwards!
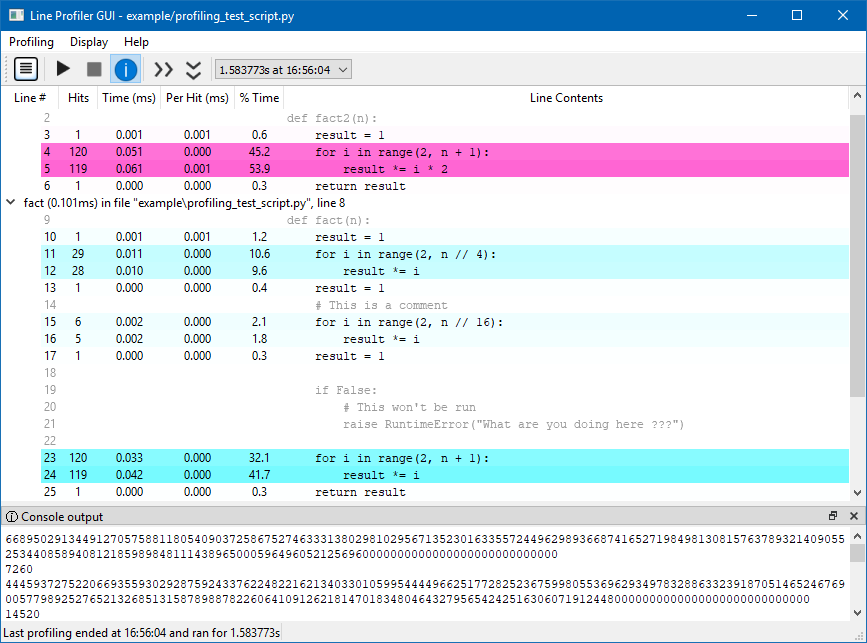
Once the profilng is done, the following data will be disaplyed for each line of the decorated functions:
Line #: The line number in the file.
Hits: The number of times that line was executed.
Time: The total amount of time spent executing the line.
Per Hit: The average amount of time spent executing the line once.
% Time: The percentage of time spent on that line relative to the total amount of recorded time spent in the function.
Line Contents: The actual source code. Note that this is always read from disk when the formatted results are viewed, not when the code was executed. If you have edited the file in the meantime, the lines will not match up, and the formatter may not even be able to locate the function for display.
In the displayed table, the lines are higlighted depending on their % Time. This allows to easily spot the lines to be optimised, and to not be distracted by the rest od the code.
Command line arguments
$ lineprofilergui -h
usage: lineprofilergui [-h] [-V] [-l LPROF] [-r] [-o OUTFILE] [-s SETUP]
                    [script] ...

Run, profile a python script and display results.

positional arguments:
script                The python script file to run
args                  Optional script arguments

options:
-h, --help            show this help message and exit
-V, --version         show program's version number and exit
-l LPROF, --lprof LPROF
                        Display data from a .lprof file
-r, --run             Profile the python script on launch
-o OUTFILE, --outfile OUTFILE
                        Save stats to OUTFILE (default: 'scriptname.lprof')
-s SETUP, --setup SETUP
                        Python script to execute before the code to profile
See also
Release history Release notifications | RSS feed


Download files
Download the file for your platform. If you're not sure which to choose, learn more about installing packages.
Source Distribution
Built Distribution
Filter files by name, interpreter, ABI, and platform.
If you're not sure about the file name format, learn more about wheel file names.
Copy a direct link to the current filters
File details
Details for the file line-profiler-gui-0.2.tar.gz.
File metadata
- Download URL: line-profiler-gui-0.2.tar.gz
- Upload date:
- Size: 17.6 kB
- Tags: Source
- Uploaded using Trusted Publishing? No
- Uploaded via: twine/3.1.1 pkginfo/1.4.2 requests/2.22.0 setuptools/45.2.0 requests-toolbelt/0.8.0 tqdm/4.30.0 CPython/3.8.10
File hashes
| Algorithm | Hash digest | |
|---|---|---|
| SHA256 |
312ffededced3d2fe253401191047e9d9210045ab631c825cacd310aeb5b2402
|
|
| MD5 |
11faf1822dedd97c2d3f168511207cb8
|
|
| BLAKE2b-256 |
80e35aa92e14dee8e52ead20e802b9064dc68177432160b3d00714cbd85b727f
|
File details
Details for the file line_profiler_gui-0.2-py3-none-any.whl.
File metadata
- Download URL: line_profiler_gui-0.2-py3-none-any.whl
- Upload date:
- Size: 20.7 kB
- Tags: Python 3
- Uploaded using Trusted Publishing? No
- Uploaded via: twine/3.1.1 pkginfo/1.4.2 requests/2.22.0 setuptools/45.2.0 requests-toolbelt/0.8.0 tqdm/4.30.0 CPython/3.8.10
File hashes
| Algorithm | Hash digest | |
|---|---|---|
| SHA256 |
69a577a037bc4be095d8e172770842007d17724430e8f24e557c56f835eeb97e
|
|
| MD5 |
d38cfbdcf80e6a17c15dbd17958ced5c
|
|
| BLAKE2b-256 |
f019a57af6c6d23f5b63f6250596de97c380c2f6a74bda73cc3190ceb52833fd
|


