
Locomotive — CI Load Testing Library




A Python library and CLI for integrating load testing into CI/CD pipelines. Powered by Locust under the hood, but lets you define tests declaratively in JSON/YAML config — no Python code required. Generates HTML reports with charts, regression analysis and baseline comparison, with full theming and branding support.
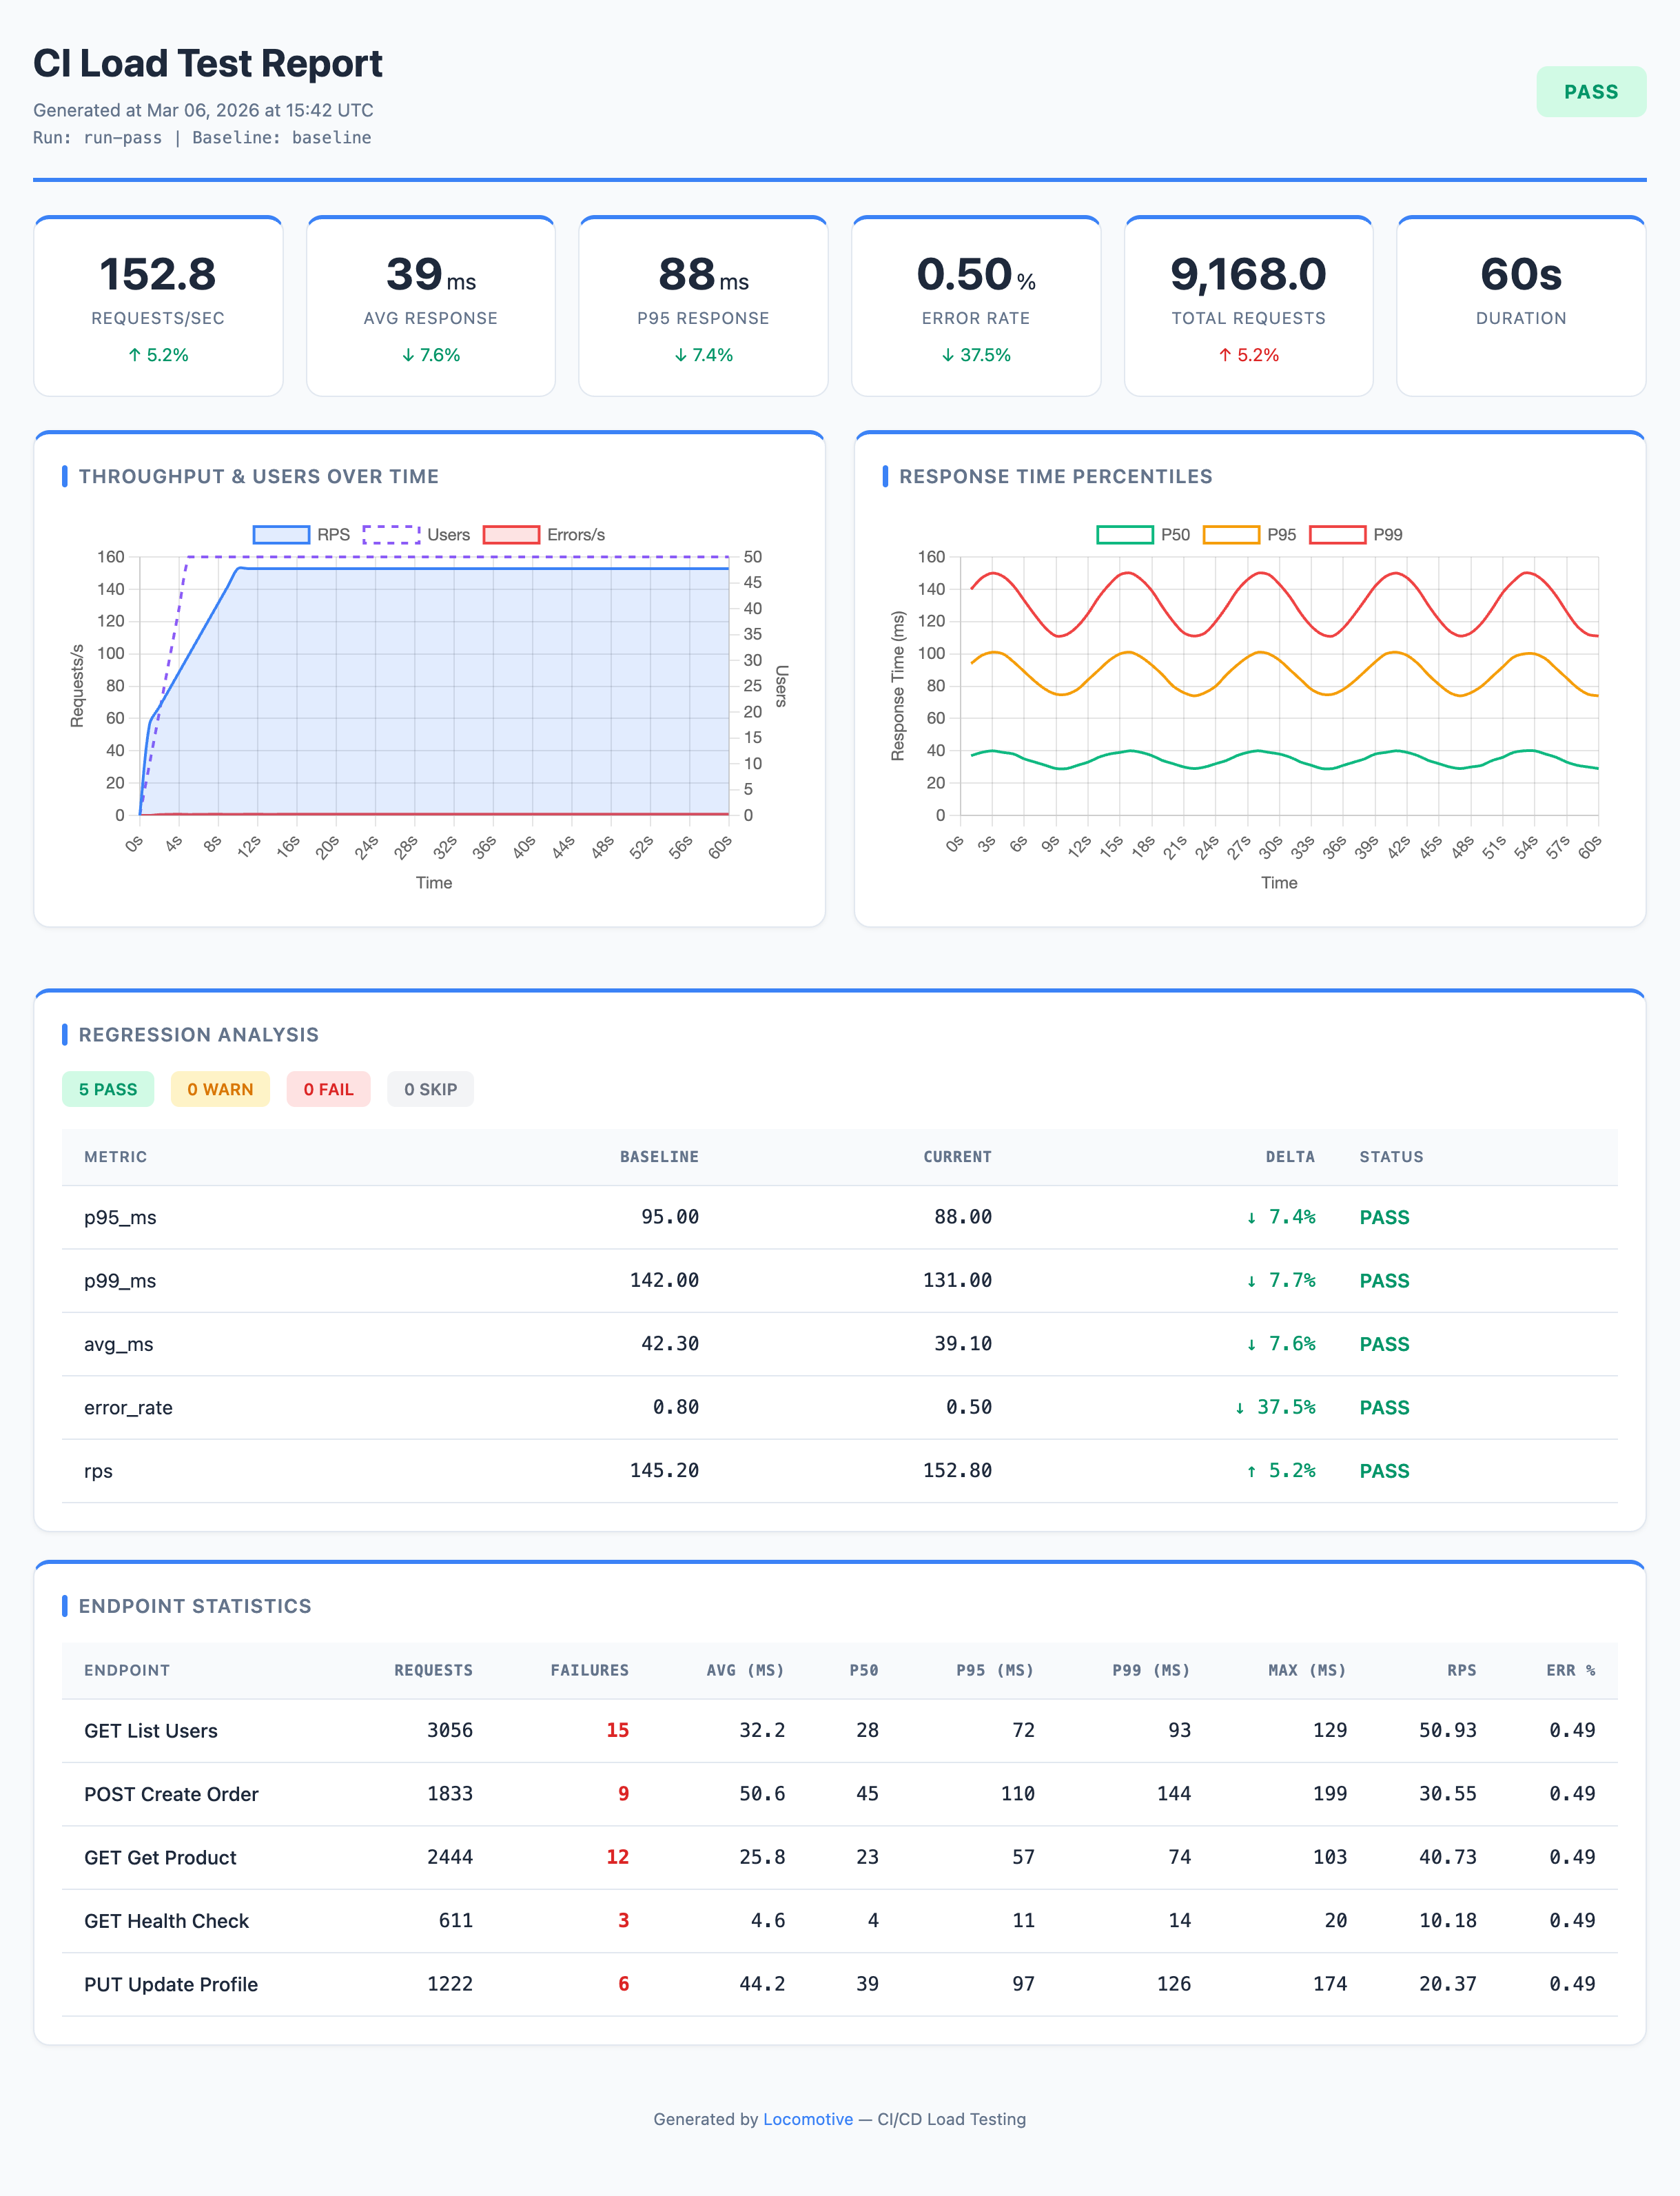
Features
- Smart OpenAPI generation —
loco init --openapi openapi.jsonbuilds a near-runnable config: request bodies filled from schemas, auth detected, login + multi-step flows inferred - Baseline comparison — regression analysis of performance metrics across runs
- Gate checks — threshold-based metric validation (error rate, latency, RPS)
- HTML reports — visual results with charts, deltas, and customizable themes
- GitHub Actions ready — built-in Action for CI/CD integration, PR comments, artifact uploads, and pipeline gating
- Response assertions — an
expectblock validates status, body content, JSON fields, and response time; content failures show up in Locust stats and the error-rate gate - Config validation —
loco validatecatches every mistake that would stop a run (malformedrequests/flows, uncaptured${var:}, undeclared data pools, thresholds only read after Locust finishes, ...) before the run starts; runs automatically inrun/ci - Spec drift detection —
loco diff --openapi spec.jsonshows how the config drifted from a changed API contract (removed / changed / added endpoints) - Distributed load —
--processes N(or a master/worker cluster across machines) to push past one CPU core, with data pools split between processes so no two of them log in as the same account - YAML & JSON configs — both formats supported (
.json,.yml,.yaml)
Installation
pip install locomotive
Locust is installed automatically as a dependency.
Quick Start
1. Create a config
# Basic template
loco init

# Generate from OpenAPI spec (creates requests from endpoints)
loco init --openapi openapi.json

# Also generate a GitHub Actions workflow
loco init --github-workflow
| Flag | Description |
|---|---|
--openapi FILE |
Path to OpenAPI spec — see Generating from OpenAPI |
--host URL |
Service URL. Without it, the host declared by the spec's servers/host is used, falling back to http://localhost:8000 |
--output FILE / -o |
Output file path (default: loconfig.json) |
--github-workflow |
Also create .github/workflows/loadtest.yml |
--force / -f |
Overwrite existing files |
2. Configure
Edit loconfig.json to match your service:
{
  "load": {
    "host": "https://staging.myapp.com",     // target service URL
    "users": 500,                             // number of virtual users
    "spawn_rate": 50,                         // user spawn rate (per second)
    "run_time": "3m"                          // test duration (s/m/h)
  },
  "scenario": {
    "think_time": {"min": 0.5, "max": 2.0},  // pause between requests (simulates real users)
    "headers": {
      "Accept": "application/json"
    },
    "requests": [
      {
        "name": "Get Users",
        "method": "GET",
        "path": "/api/users",
        "weight": 5                           // relative call frequency (higher = more frequent)
      },
      {
        "name": "Create Order",
        "method": "POST",
        "path": "/api/orders",
        "weight": 2,
        "json": {"product_id": 1, "quantity": "${random}"}
      }
    ]
  }
}
3. Run
# Full CI pipeline: test → analyze → report
loco --config loconfig.json ci

# Save baseline for future comparisons
loco --config loconfig.json ci --set-baseline
Generating from OpenAPI
loco init --openapi spec.json reads your OpenAPI 3.x spec (JSON or YAML) and produces a config that is close to runnable — not a bag of TODO stubs. Instead of hand-writing scenarios, you edit a scaffold that already reflects your API.
Request bodies are synthesized from the schema. Each field is filled with a sensible placeholder, chosen in this priority: the schema's own example/default → enum (${choice:...}) → format (email, uuid, date-time, ...) → the field name (email, phone, first_name, password, quantity, *_id, ...) → the JSON type. Explicit minimum/maximum become ${randint:min:max}. $ref, allOf, and nested objects/arrays are resolved.
// POST body schema { product_id: integer, quantity: integer(1..5), customer_email: string(email) }
// becomes:
"json": {
  "product_id": "${randint:1:1000}",
  "quantity": "${randint:1:5}",
  "customer_email": "${fake:email}"
}
Form-encoded bodies stay form-encoded. A requestBody whose only media type is application/x-www-form-urlencoded or multipart/form-data (and Swagger 2.0's in: formData parameters) becomes a data body instead of a json one, with a per-request Content-Type header overriding the scenario-wide application/json. This matters most for OAuth2 /token endpoints, which the OAuth spec requires to be form-encoded — sent as JSON they answer 400 on every call.
The server URL is read, not ignored. OpenAPI 3's servers[0].url (with {variables} substituted from their defaults) and Swagger 2's schemes/host/basePath are split in two. The path prefix — the /v1 or /api that the paths keys leave out — is written into every generated request path, so the scaffold does not 404 on every request. The host becomes the default for load.host, and only that: an explicit --host still wins, and because the prefix lives in the paths rather than the host, pointing the finished config at a staging server cannot silently drop /v1 along with the hostname.
OpenAPI 3.1 nullable unions are understood. {"type": ["integer", "null"]} scaffolds as an integer rather than falling through to ${fake:word}, and a oneOf/anyOf that pairs a real schema with {"type": "null"} resolves to the real one.
Auth is detected from securitySchemes. A bearer/OAuth2 scheme becomes auth: {type: bearer, ...}, basic and header apiKey are mapped too. If the spec has a login-looking endpoint, Locomotive wires an on_start step that logs in and captures the token — inferring the token field from the login response schema (e.g. data.access_token) — and sets auth.token to ${var:token}. Login credentials map to ${TEST_USER} / ${TEST_PASSWORD} (set them as CI secrets).
The login endpoint is picked by scoring whole path words — login and signin beat token and auth, which beat session, and a body with a password-shaped field breaks the tie between two candidates under the same prefix. Words like logout, register, reset and revoke disqualify a path outright. Matching whole words rather than substrings is what keeps a blog API from scaffolding "log in by POSTing an article" because it has a /authors endpoint.
Multi-step flows are inferred from CRUD paths. When a resource has a POST /orders (create) plus item operations (GET/PUT/DELETE /orders/{id}, sub-actions like POST /orders/{id}/pay), Locomotive builds a flow: the create step captures the new id from its response, and later steps use ${var:id} in the path. Collection reads (GET /orders) stay as flat requests; login and flow operations are removed from the flat request list so nothing runs twice.
Every generated request and step carries an _operation field (the operationId) — kept for provenance and future spec-vs-config reconciliation.
Everything is a starting point: values the tool can't infer are marked with _comment TODOs (unknown token field, path params to fill, step order to review). Review and adjust, then run. Use --host to set the target URL.
Keeping the config in sync (loco diff)
APIs change. loco diff --openapi spec.json compares your config against the current spec and shows exactly what drifted — so a contract change means updating the config, not regenerating and re-adapting it from scratch.
loco --config loconfig.json diff --openapi openapi.json
It reports three kinds of drift, with breaking ones marked !:
- REMOVED (breaking) — the config calls an endpoint that's no longer in the spec (removed or renamed). Your test would hit a dead route.
- CHANGED (breaking / info) — a matched endpoint whose contract shifted: the spec now requires a body field or query param the request is missing (breaking), or the request sends a field the spec dropped (info).
- ADDED (info) — a spec endpoint the config doesn't cover yet, suggested for adding.
Requests are matched to spec operations first by _operation (the operationId stamped during generation), then by method + path (params canonicalized), so renamed paths are still tracked as long as the operationId is stable. When it is not — the _operation is gone from the spec but the path still resolves — that is reported as an informational CHANGED finding naming the new operationId, rather than being swallowed by the path match and only surfacing at the next regeneration.
diff reads the config as written, without substituting ${...}, because a path written /users/${PATH_ID:-1} is a parameterized path and comparing the resolved /users/1 against the spec's /users/{id} made every scaffolded config drift against the spec it came from. For the same reason a spec's server prefix matches both ways: whether you keep /v1 in the request paths or fold it into load.host is a style choice, not drift. Form-encoded requests are compared on their data fields the same way JSON ones are compared on json, and HEAD/OPTIONS/TRACE operations are matched rather than reported as dead routes (they are still not scaffolded — a generated load test that spends its budget on OPTIONS is not what you asked for). Exit code is 1 when there's breaking drift (use it as a CI gate) and 0 otherwise; --exit-zero makes it report-only.
Configuration
load section
Load test parameters. Fields host, users, spawn_rate, and run_time are required.
{
  "load": {
    "host": "https://staging.myapp.com",     // required: target service URL
    "users": 500,                             // required: number of virtual users
    "spawn_rate": 50,                         // required: users/sec ramp-up rate
    "run_time": "3m",                         // required: duration ("30s", "2m", "1h")
    "stop_timeout": 10,                       // graceful shutdown timeout in seconds
    "timeout": "10m",                         // wall-clock budget for the whole run
    "tags": ["api"],                          // only run requests tagged "api"
    "exclude_tags": ["slow"],                 // skip requests tagged "slow"
    "processes": 4                            // spread the load over 4 processes
  }
}
processes and the rest of the distribution settings (master, worker,
master_host, master_port, expect_workers, shard_data) have their own
section: Distributed load.
run_time is how long Locust generates load; timeout is how long the Locust
process is allowed to exist. They differ because ramp-up, shutdown and CSV
flushing all happen outside run_time, and because a Locust that stops
honouring --run-time — a hung greenlet, a worker that never connects — would
otherwise pin the CI job until the CI platform kills it, with no artifacts and
no report. Leave timeout out and Locomotive derives one from run_time (plus
stop_timeout, plus the larger of two minutes and half the run). Set it to
null to wait indefinitely, which is what a long soak run usually wants.
When the budget runs out, Locomotive asks Locust to stop, escalates to a kill if
it does not, and then analyses whatever Locust had already written rather
than discarding the run. The same is true of Ctrl-C: the interrupt is forwarded
to Locust, the artifacts that exist are collected and the report is still built,
so a run stopped a minute early is still worth looking at. loco run exits 130
if it was interrupted.
scenario section
User scenario definition: headers, auth, and requests.
{
  "scenario": {
    "think_time": {"min": 0.5, "max": 2.0},  // pause between requests (or a number: "think_time": 1.0)
    "headers": {                               // global headers for all requests
      "Accept": "application/json",
      "Content-Type": "application/json"
    },
    "auth": {                                  // authentication (see section below)
      "type": "bearer",
      "token": "${API_TOKEN}"                  // environment variable
    },
    "on_start": [                              // runs once per user at startup
      {
        "name": "Login",
        "method": "POST",
        "path": "/auth/login",
        "json": {"username": "${USER}", "password": "${PASS}"},
        "capture": {"auth_token": "data.token"}
      }
    ],
    "on_stop": [                               // runs once per user at shutdown (teardown)
      {"name": "Logout", "method": "POST", "path": "/auth/logout"}
    ],
    "flows": [...],                            // multi-step user journeys (see Flows)
    "requests": [...]                          // flat weighted requests (see below)
  }
}
think_time is either a number of seconds or a {min, max} pair, and it can be set on the scenario, on a flow, or on a single request. The bounds have to be non-negative; if they arrive out of order they are swapped when the locustfile is generated ({"min": 2, "max": 0.5} becomes a wait between 0.5s and 2s), and loco validate warns about it — a negative value is an error.
Request format
Each request in the requests array describes a single HTTP call:
{
  "name": "Create Resource",                   // display name for reports (default: "METHOD /path")
  "method": "POST",                            // HTTP method: GET, POST, PUT, PATCH, DELETE
  "path": "/api/resources",                    // path (appended to host)
  "weight": 3,                                 // relative call frequency (default: 1)
  "headers": {"X-Custom": "value"},            // per-request headers
  "query": {"filter": "active"},               // query parameters (?filter=active)
  "json": {"field": "value"},                  // JSON request body
  "data": {"field": "value"},                  // form-encoded request body (instead of json)
  "timeout": 30,                               // timeout in seconds (a positive number)
  "tags": ["api", "write"]                     // tags for filtering
}
json and data are two ways to fill the same request body, so stating both is a config error rather than a merge: loco validate rejects the combination, and if a run somehow reaches the generator anyway, json is what gets sent. timeout has to be a positive number — a YAML timeout: "5" is a string, which requests rejects mid-run, so validate warns about the quoted form and errors on anything that is not a number greater than zero.
Tags
Tags let you run a subset of requests. Assign "tags": ["api", "write"] to a request, then use --tags api to only run requests tagged api. Or --exclude-tags slow to run everything except requests tagged slow. Tags can also be set in the config: "load": {"tags": ["api"]}.
A single tag can be written as a plain string — "tags": "purchase" means the one tag purchase, and "tags": "api,write" means two, the same comma-separated form the --tags flag accepts. (Earlier versions read a string as a set of its letters, so a request tagged that way matched nothing and disappeared from every filtered run.)
Dynamic values
String values in the config support runtime placeholders — resolved at request time:
| Placeholder | Description |
|---|---|
${ENV_VAR} |
Captured variable (see Capture) first, then environment variable |
${ENV_VAR:-default} |
Environment variable with fallback |
${env:NAME} |
Environment variable (explicit namespace, also ${env:NAME:-default}) |
${var:name} |
Variable captured via capture (explicit namespace) |
${timestamp} |
Current timestamp in milliseconds |
${random} |
Random alphanumeric string (8 chars); ${random:16} — custom length |
${uuid} |
Random UUID4 (e.g. for unique resource IDs) |
${randint:A:B} |
Random integer between A and B inclusive: ${randint:1:100} |
${choice:a,b,c} |
Random element of a comma-separated list |
${now:%Y-%m-%d} |
Current time via strftime format (colons allowed: ${now:%H:%M}); ${now} — ISO format |
${iteration} |
Request counter across the run: 1, 2, 3, ... — increments on every call by any virtual user. Useful for unique data: "name": "user-${iteration}". In a distributed run each process counts in its own range, so the values stay unique across the cluster |
${fake:KIND} |
Synthetic data (see below): ${fake:name}, ${fake:email}, ${fake:city}, ... |
Every placeholder is braced. The unbraced $NAME form was accepted in earlier versions and is not any more: it swallowed the $ref of a JSON-Schema body and the $ of a jq-style path, and the generated locustfile never understood it, so the same config meant two different things depending on which resolver read it. $NAME is now sent literally; loco validate warns when it sees one whose name is set in the environment.
Placeholders are resolved in dictionary keys as well as values, so a header, a query dict, or a body may be keyed by one: {"query": {"${env:PARAM_NAME}": "x"}} sends the variable's value as the parameter name.
In a json body, a placeholder keeps its own type. JSON is the one place where 7 and "7" are different things to the server, and {"quantity": "${randint:1:10}"} used to send the string — an API that declares quantity as an integer answers 422 to that, which reads in the report as a broken service rather than a broken config. A value that is exactly one placeholder, with no text around it, now keeps its native type: ${randint:A:B}, ${iteration} and ${timestamp} arrive as numbers, ${fake:bool} as a boolean, and ${var:x} / ${data:pool.field} as whatever was captured or loaded — a response that said 42 produces 42 in the follow-up request, not "42". Anything mixed with other text ("SKU-${randint:1:9}") is a string, as it has to be, and placeholders whose type is not beyond doubt (${uuid}, ${random:6}, ${choice:...}, ${now:...}, ${env:...}, the other ${fake:} kinds) stay strings — a code that happens to be all digits is still a code. Headers, query params and data bodies are strings on the wire whatever the config says, so they are unaffected.
Function names (timestamp, random, iteration, uuid, randint, choice, now) are reserved — an environment variable with the same name cannot be referenced as a bare ${name} (use ${env:name} instead). Invalid function arguments degrade gracefully (defaults or empty string) instead of crashing the run.
Secrets: use ${env:NAME}. Inside scenario and users, ${env:NAME} is not substituted while the config is read — it is written into the generated locustfile as-is and read from the environment by the locust process. The generated file lives in the artifacts directory and is commonly uploaded as a CI build artifact, so a token referenced this way never ends up in it. The other forms (${NAME}, ${NAME:-default}) are substituted at load time and do end up in the generated file — keep them for non-secret values.
Outside scenario/users — load.host, artifacts.storage, analysis.rules_file — and under the keys the generator itself consumes (source, mode, count, weight, tags, think_time, name), ${env:} is still substituted at load time: those values are used by loco itself and nothing resolves them later.
One consequence: loco validate and loco diff see ${env:...} rather than the value it will have, so they cannot flag a config that only breaks under a particular environment. What they can check is that the variable will resolve at all: a ${env:NAME} with no :-default whose variable is unset in the current environment is a validation error, and run/ci stop before Locust starts rather than sending an empty password a hundred times a second.
Synthetic data (${fake:...})
For realistic payloads without preparing a dataset, use the fake: namespace. Each reference produces a new synthetic value at request time:
| Placeholder | Example output |
|---|---|
${fake:first_name} / ${fake:last_name} |
Anna / Petrov |
${fake:name} |
Anna Petrov |
${fake:username} |
anna.petrov42 |
${fake:email} |
anna.petrov1234@example.com |
${fake:domain} |
acme.io |
${fake:phone} |
+1-415-555-0132 |
${fake:city} / ${fake:country} |
Berlin / Germany |
${fake:address} |
742 Oak Ave |
${fake:word} / ${fake:words:N} |
lorem / lorem ipsum dolor |
${fake:sentence} |
Lorem ipsum dolor sit amet. |
${fake:digits:N} |
${fake:digits:5} → 40718 |
${fake:bool} |
true / false |
The fake: namespace never collides with your environment or captured variables. Unknown kinds resolve to an empty string. Values are independent per reference — if you need a consistent synthetic identity per virtual user (same name and email across a whole flow), use a generated data pool (below).
Placeholders also work in path — e.g. "path": "/users/${var:user_id}". The request name keeps the template string, so Locust stats group all calls of the endpoint into one row regardless of the substituted values.
Authentication
The auth section in scenario adds an auth header to all requests:
// Bearer token — adds Authorization: Bearer <token> header
"auth": {"type": "bearer", "token": "${API_TOKEN}"}

// API Key — adds a custom header with the key
"auth": {"type": "api_key", "header": "X-API-Key", "key": "${API_KEY}"}

// Basic Auth — adds a base64-encoded Authorization: Basic header.
// Credentials are resolved and encoded at runtime, never embedded as a ready-made header.
"auth": {"type": "basic", "username": "${USER}", "password": "${PASS}"}
Capture (response data extraction)
In on_start requests, you can extract values from JSON responses and use them in subsequent requests. A typical use case is login: each virtual user POSTs to /login at startup, receives a token, and Locomotive automatically injects it into headers for all further requests.
Everything is configured declaratively — no need to edit the generated locustfile:
{
  "scenario": {
    "on_start": [
      {
        "name": "Login",
        "method": "POST",
        "path": "/auth/login",
        "json": {"username": "${USER}", "password": "${PASS}"},
        "capture": {
          "auth_token": "data.token"     // extracts response.json()["data"]["token"]
        }
      }
    ],
    "headers": {
      "Authorization": "Bearer ${auth_token}"  // injected automatically
    },
    "requests": [...]
  }
}
capture is a {"variable_name": "json.path"} dict. The path is dot-separated: "data.token" means response["data"]["token"].
The path also reaches into arrays, in either notation: "data.items.0.id" and "data.items[0].id" are the same path, and negative indices ("items[-1].id") count from the end.
Captured values are stored per virtual user and can be referenced from any request — in headers, paths, query, or bodies — as ${auth_token} or explicitly as ${var:auth_token}. A bare ${name} checks captured variables first, then environment variables.
A capture that finds nothing fails the request. If the body is not JSON, or the path does not exist, the sample is marked failed in Locust with a message like capture auth_token: no value at data.token, and the variable is set to None. The alternative — an empty ${var:} quietly poisoning a request three steps later — turns a clear error into a puzzling 404. A captured null is a real value and is not a failure. When a request fails for its own reasons (a 500, a failed expect), that failure is reported alone; capture noise on top of it is suppressed.
capture works in on_start requests, in flat requests, and in any flow step.
Response assertions (expect)
By default a request counts as a failure only when the HTTP client raises or the server returns a 5xx-style error. Add an expect block to any request to also validate the content of the response — a 200 that returns the wrong body, or a slow-but-successful call, is then reported as a failure in Locust's stats (and counts toward the error-rate gate):
{
  "name": "Get order",
  "method": "GET",
  "path": "/orders/${var:order_id}",
  "expect": {
    "status": [200, 304],                 // allowed status code(s); int or list
    "contains": "order",                   // substring(s) the body must contain; str or list
    "json": {"data.status": "paid"},       // JSON fields by path (loose string compare)
    "max_ms": 800                          // fail if the response took longer than 800ms
  }
}
Every key is optional; a request fails if any stated expectation is not met, and the failure message lists all mismatches at once (e.g. status 500 not in [200]; body is missing 'order').
Paths in expect.json use the same notation as capture, including array indices — "items.0.sku" and "items[0].sku" both work, and a negative index counts from the end. A path that is absent from the response is a failure in its own right (json data.status: no value at that path), which is what makes {"json": {"error": null}} a meaningful assertion: it says the field exists and is null, not that the response happens to have no such field.
An expect block only ever adds checks — it never removes them. When you omit status, the response still has to be one Locust itself would accept: a 4xx/5xx, or no response at all (connection refused, DNS failure, timeout), fails the sample regardless of what else expect says. To assert an error status on purpose — a negative test — state it explicitly with "status": 404. Values in expect go through the same placeholder resolution as the rest of the request, so "contains": "${var:order_id}" or "json": {"user.email": "${data:accounts.email}"} work as expected. expect is available on flat requests, on on_start/on_stop, and on any flow step. loco validate checks the shape of every expect block before a run.
Flows (multi-step user journeys)
Flows describe ordered sequences of requests — a user journey like "browse → create order → pay". Steps run strictly in order; values captured in one step can be used in the next:
{
  "scenario": {
    "flows": [
      {
        "name": "Checkout",
        "weight": 3,                            // scheduling weight vs other flows/requests
        "think_time": {"min": 1.0, "max": 2.0}, // optional: overrides the user's think_time inside the flow
        "tags": ["purchase"],                   // optional: tags for the whole flow
        "steps": [
          {"name": "Browse", "method": "GET", "path": "/catalog"},
          {
            "name": "Create order",
            "method": "POST",
            "path": "/orders",
            "json": {"product_id": "${randint:1:100}"},
            "capture": {"order_id": "id"}       // captured for the next step
          },
          {"name": "Pay", "method": "POST", "path": "/orders/${var:order_id}/pay"}
        ]
      }
    ],
    "requests": [                               // flat requests coexist with flows
      {"name": "Health", "method": "GET", "path": "/health", "weight": 1}
    ]
  }
}
How it works:
- Each flow becomes a Locust
SequentialTaskSet— steps execute in declaration order. weightcontrols how often the flow is picked relative to other flows and flatrequests(here: Checkout runs 3× more often than Health).- After the last step, control returns to the scheduler (the flow does not loop internally).
- A step supports everything a request does:
headers,query,json,data,timeout,tags,capture. - Variables captured in a step are stored per virtual user and are visible in later steps, in other flows, and in flat requests.
- Flow-level
tagsparticipate in--tags/--exclude-tagsfiltering, same as request tags.
Data pools (data-driven testing)
Data pools feed requests with rows from CSV/JSON files (or inline lists) — e.g. a pool of test accounts where each virtual user logs in with its own credentials:
{
  "scenario": {
    "data": {
      "accounts": {
        "source": "data/accounts.csv",      // CSV (with header) or .json (array of objects)
        "mode": "unique_per_user"           // see modes below
      },
      "products": {
        "inline": [                          // alternative: rows right in the config
          {"id": "1", "sku": "A-100"},
          {"id": "2", "sku": "B-200"}
        ],
        "mode": "random"
      },
      "people": {
        "generate": {                        // synthetic pool — no file needed
          "count": 1000,                     // number of rows to generate
          "fields": {                        // each field is a placeholder template
            "email": "${fake:email}",
            "full_name": "${fake:name}",
            "user_id": "${uuid}"
          }
        },
        "mode": "unique_per_user"
      }
    },
    "on_start": [
      {
        "name": "Login",
        "method": "POST",
        "path": "/auth/login",
        "json": {
          "username": "${data:accounts.login}",     // this user's row
          "password": "${data:accounts.password}"
        },
        "capture": {"auth_token": "token"}
      }
    ],
    "requests": [
      {"name": "Buy", "method": "POST", "path": "/buy",
       "json": {"sku": "${data:products.sku}"}}
    ]
  }
}
${data:pool.field} resolves a field of a row; nested JSON fields use dot paths (${data:accounts.profile.city}).
A pool draws its rows from exactly one source: source (a CSV/JSON file), inline (rows in the config), or generate (synthetic rows built from ${fake:...} and other placeholders). A generated pool gives each virtual user a consistent synthetic identity — the same generated email, name and id across the whole scenario — which pure ${fake:...} placeholders (fresh value every reference) cannot.
| Mode | Row selection |
|---|---|
unique_per_user (default) |
Each virtual user pins its own row at start; consistent across all of that user's requests. Wraps around when users outnumber rows. |
round_robin |
Every request takes the next row, cycling through the pool |
random |
Every request takes a random row |
once |
The first row is used for the entire run |
The unit of selection is one request, not one placeholder. A request whose body contains ${data:accounts.login} and ${data:accounts.password} sends the login and the password of the same account, and the expect block of that request is checked against that same row. round_robin therefore advances one step per request regardless of how many ${data:} references the request has.
Notes:
sourcepaths are relative to the file they are written in — the config, or the included fragment — and that holds inside a persona too. Files are read once per worker process at startup.- A pool that cannot produce rows is a validation error, so the run stops before Locust starts: a
sourcefile that is missing, unreadable, empty or header-only, a JSON file that is not a list of objects, an emptyinline: [], orgenerate.count: 0. Previously these became empty strings mid-run. - A
${data:pool.field}naming a field the pool does not have is a warning (checked against the first row, so nested JSON paths are left alone) and still resolves to an empty string at runtime. - In a distributed run every process loads the file and then keeps only its own stride of it (
rows[worker_index::worker_count]), sounique_per_userstays unique across the whole cluster rather than per process. See Distributed load for what that means for pool size, and forshard_data: falseto turn it off.
Personas (multiple user types)
The top-level users section defines several user types running simultaneously — e.g. 80% readers and 20% buyers. Each persona is a full scenario of its own (think_time, headers, auth, data, flows, requests) with a scheduling weight:
{
  "load": { "host": "...", "users": 100, "spawn_rate": 10, "run_time": "3m" },
  "users": [
    {
      "weight": 4,                          // 4 of every 5 virtual users
      "name": "reader",
      "scenario": {
        "think_time": {"min": 1.0, "max": 3.0},
        "requests": [
          {"name": "Read article", "method": "GET", "path": "/articles/${randint:1:1000}"}
        ]
      }
    },
    {
      "weight": 1,                          // 1 of every 5 virtual users
      "name": "buyer",
      "scenario": {
        "auth": {"type": "bearer", "token": "${API_TOKEN}"},
        "flows": [
          {"name": "Checkout", "steps": [
            {"name": "Order", "method": "POST", "path": "/orders", "capture": {"order_id": "id"}},
            {"name": "Pay", "method": "POST", "path": "/orders/${var:order_id}/pay"}
          ]}
        ]
      }
    }
  ]
}
Each persona becomes its own Locust user class; Locust distributes virtual users between classes by weight. Settings are fully isolated per persona (headers, auth, think_time, on_start/on_stop). Data pool names are global across personas — share one definition or use distinct names. When users is present, the top-level scenario section is ignored.
Modular configs (include)
Any object in the config may use include to pull in another JSON/YAML file — the classic use case is one file per persona:
// loconfig.json
{
  "load": { "host": "https://staging.myapp.com", "users": 100, "spawn_rate": 10, "run_time": "3m" },
  "users": [
    {"weight": 4, "name": "reader", "include": "personas/reader.json"},
    {"weight": 1, "name": "buyer",  "include": "personas/buyer.json"}
  ]
}

// personas/reader.json
{
  "scenario": {
    "think_time": {"min": 1.0, "max": 3.0},
    "requests": [{"name": "Read", "method": "GET", "path": "/articles"}]
  }
}
Rules:
- The included file's content is merged into the object containing
include; sibling keys (likeweightabove) win over included ones. - Paths are relative to the file containing the directive, so included files can include further files (
personas/reader.jsoncanincludeshared_headers.jsonnext to it). Cycles are detected and reported. - Includes are expanded before placeholder resolution —
capturevariables defined in included files work exactly as if written inline. - File paths inside an included fragment (a pool
source, for example) are relative to that file, not to the config that includes it:personas/buyer.jsoncan say"source": "accounts.csv"and meanpersonas/accounts.csv. - Any object works, not just personas: share a common
datapool, a headers block, or gate thresholds between configs.
Distributed load (more than one process)
One Locust process is one Python process on one core, and somewhere around a few hundred to a couple of thousand requests per second it stops being a load generator and starts being the bottleneck — the numbers in the report then describe your CI runner, not the service. Locust solves this by running several load-generating processes and aggregating their statistics into one; Locomotive drives that from the config, and takes care of the part Locust leaves to you: making sure the processes do not all feed on the same rows of your data pools.
The simplest form is several processes on one machine:
{
  "load": {
    "host": "https://staging.myapp.com",
    "users": 2000,          // across the whole cluster, not per process
    "spawn_rate": 200,      // likewise
    "run_time": "5m",
    "processes": 4          // 1 master + 4 workers, one per core
  }
}
or on the command line, which is usually what CI wants because the right number depends on the runner:
loco --config loconfig.json ci --processes 4
users, spawn_rate and run_time stay totals for the entire run. This is the single thing worth remembering about distributed mode. "users": 2000 with "processes": 4 is two thousand virtual users, five hundred per worker — Locust divides them for you. Multiplying by the process count yourself is the classic way to accidentally run an eight-thousand-user test and conclude the service fell over.
Across machines
When one machine is not enough, run a master and connect workers to it. The master coordinates, aggregates and writes the artifacts; the workers only generate load.
// master.json
{"load": {"host": "https://staging.myapp.com", "users": 5000, "spawn_rate": 250,
          "run_time": "10m", "master": true, "expect_workers": 6}}

// worker.json — the same scenario, run on each load machine
{"load": {"host": "https://staging.myapp.com", "worker": true,
          "master_host": "10.0.0.4"}}
# on the coordinating machine
loco --config master.json ci
# on each of the six load machines
loco --config worker.json run --worker --master-host 10.0.0.4
A master waits for expect_workers workers to connect before starting, so the ramp-up begins with the full cluster present rather than whichever workers happened to boot first. A worker takes users, spawn_rate and run_time from its master and ignores its own, so the worker config only needs the scenario and the address to connect to.
Settings
All of these live in load, and each has a matching flag on run and ci — the flag wins.
| Config | Flag | Meaning |
|---|---|---|
processes |
--processes N |
Fork N worker processes on this machine and make this process their master. |
master |
--master |
This process coordinates a cluster; workers connect to it over the network. |
worker |
--worker |
This process generates load for a master elsewhere. |
master_host |
--master-host |
Where the master is (workers only; default 127.0.0.1). |
master_port |
--master-port |
Master's port, if it is not Locust's default 5557. |
expect_workers |
--expect-workers N |
How many workers a master waits for before starting. |
shard_data |
--no-shard-data |
Whether each process gets its own slice of the data pools (default true). |
loco validate rejects the combinations that cannot mean anything before the run starts: master together with worker (one process is one role), worker together with processes (a worker cannot fan out again), master together with processes (processes already makes this process the master), an expect_workers that contradicts processes, a master with no expect_workers at all, and processes on Windows, where Locust cannot fork. A worker with no master_host is a warning — it will look for a master on localhost, which is occasionally what you meant.
Data pools are split between processes
Each process reads the whole pool file and then keeps only its own stride of it — worker 0 takes rows 0, 4, 8, …, worker 1 takes rows 1, 5, 9, … The slices never overlap, together they are exactly the pool, and they differ in size by at most one row whatever the numbers are. So a pool of 500 test accounts run with unique_per_user over four processes still hands every virtual user a different account, which is the behaviour you would get from a single process and the reason to bother.
This applies to the two modes where a repeated row is a problem — unique_per_user and round_robin — and to pools loaded from source and inline alike. The rest stay whole on purpose: mode: "once" has to keep seeing the same first row or it stops meaning one row, random is already correct and dividing it would only narrow the values each process can draw from, and generate pools are synthesised independently in every process, so there is no shared sequence to divide.
Because the pool is divided, the pool has to be big enough to divide. Fewer rows than load generators means at least one slice comes out empty, and a process with no rows has nothing to send — so the generated file catches that case and falls back to the whole pool, logging that rows will repeat across workers. That is a recoverable degradation rather than a crash, but it is also knowable before anything starts, so loco validate warns about it up front and names the three ways out: add rows, lower the process count, or set shard_data: false to say the repetition is intended.
shard_data: false (or --no-shard-data) is that third way: every process keeps the whole pool. Use it when the rows are not identities — a pool of search terms, say, where two processes sending the same query is fine and the shared list is more representative than a quarter of it each. With unique_per_user it means several virtual users on different processes will pin the same row, which is exactly the collision sharding exists to prevent — hence sharding being the default.
${iteration} is seeded per process as well: each worker starts its counter in its own range rather than all of them counting 1, 2, 3. A "name": "user-${iteration}" therefore stays unique across the cluster, the same way it is unique within one process.
What comes out of a distributed run
Only the master aggregates statistics, so only the master has anything to write. A worker is not given --csv and produces no artifacts — writing empty CSVs would leave behind what looks like a run that measured zero. loco ci on a worker knows this: it exits with Locust's own exit code and says the master holds the results, instead of failing the step because it found no metrics to analyse.
The report gains a Load generators: N note in its header whenever more than one process generated the load, and the topology is recorded in run.json next to the rest of the run metadata.
That recorded topology is also compared against the baseline's. Going from one process to eight makes throughput rise and latency change for reasons that have nothing to do with the code, and the regression rules cannot see it — the metrics look the same shape either way. So when a run and its baseline used different numbers of load generators, the analysis adds a warning saying the two are not comparable and the baseline should be retaken on the new topology. It is a warning rather than a failure because the run that re-baselines after deliberate scaling has to be allowed to happen.
Version note
Distributed runs need Locust 2.11 or newer, which is the floor in Locomotive's dependencies. 2.11 is the release where a worker first learns its own index — the master sends it in the connection acknowledgement — and without an index there is no way to give each worker a different slice of a pool. Older masters report -1 for every worker.
Rules vs Gates
Locomotive provides two mechanisms for validating metrics:
| Rules (regression analysis) | Gates (threshold checks) | |
|---|---|---|
| Compares | Current run vs baseline (a run marked with --set-baseline) |
Current run vs fixed thresholds |
| Needs baseline | Yes — requires a previous run with --set-baseline (otherwise SKIP) |
No |
| Use case | Catch degradation: "p95 got 15% worse" | Enforce SLAs: "p95 must stay under 500ms" |
| Example | "metric": "p95_ms", "mode": "relative", "fail": 25 |
"p95_ms": {"fail": 500} |
Both can be used together — results are merged, and the overall status is the worst of the two. That merged status is what decides the exit code of loco ci, so loco ci and loco analyze always agree on the same artifacts. If you want regression rules to be reported but never fail the build — they compare against a baseline, which can drift — set "rules_advisory": true in the analysis section and only the gate will decide the exit code.
Baseline & Regression Analysis
Baseline is a saved result from a previous run used for comparison.
Baseline is saved when you pass --set-baseline (in the built-in Action this happens automatically — set_baseline defaults to true). Only successful runs (PASS or WARNING) are saved.
On the first run there is no baseline — regression analysis is skipped (but gate checks still work). Starting from the second successful run, the report shows deltas: how much latency, RPS, and error rate changed compared to the previous run.
Branch-aware baselines
When using the built-in GitHub Action, baselines are branch-aware:
| Scenario | Baseline source | Why |
|---|---|---|
| Push to branch | Latest baseline from the same branch | Track regressions within the branch |
| Pull request | Latest baseline from the target branch | Show what the PR would change in the target |
| First run on a new branch | Falls back to main branch baseline | New branches start from the main baseline |
Each branch listed in push.branches maintains its own baseline. PRs always compare against the target branch (e.g., a PR into main uses main's baseline, a PR into release uses release's baseline).
You can change the fallback branch via the fallback_branch input (default: main).
Analysis rules
Rules compare current metrics against baseline and produce a status:
{
  "analysis": {
    "rules": [
      {
        "metric": "p95_ms",        // metric to check
        "mode": "relative",        // "relative" (% change) or "absolute" (raw value)
        "direction": "increase",   // p95 increase = degradation
        "warn": 10,                // WARNING if p95 increased by 10%
        "fail": 25                 // DEGRADATION if p95 increased by 25%
      },
      {
        "metric": "error_rate",
        "mode": "absolute",        // checks the raw error_rate value (not delta)
        "direction": "increase",   // error_rate increase = degradation
        "warn": 1,                 // WARNING if error_rate >= 1%
        "fail": 5                  // DEGRADATION if error_rate >= 5%
      },
      {
        "metric": "rps",
        "mode": "relative",
        "direction": "decrease",   // RPS drop = degradation
        "warn": 10,                // WARNING if RPS dropped by 10%
        "fail": 20                 // DEGRADATION if RPS dropped by 20%
      }
    ],
    "fail_on": "DEGRADATION"       // exit code 1 on this status ("WARNING" = stricter; case-insensitive)
  }
}
Rules can be extracted to a separate file:
{
  "analysis": {
    "rules_file": "rules.json"     // path to a file with a rules array
  }
}
| Parameter | Description | Values |
|---|---|---|
metric |
Metric to check | p95_ms, p99_ms, avg_ms, median_ms, rps, error_rate |
mode |
Comparison type | relative — % change from baseline; absolute — raw metric value compared to threshold |
direction |
Which direction is degradation | increase — degradation on growth (latency, errors); decrease — degradation on drop (rps) |
warn / fail |
Thresholds | Exceeding warn → WARNING, fail → DEGRADATION |
fail_on |
When CI should fail | "DEGRADATION" (default) or "WARNING" (stricter); case-insensitive |
rules_advisory |
Report regression rules but let only the gate decide the exit code | false (default) or true |
allow_no_data |
Treat NO_DATA as SKIP instead of failing the build |
false (default) or true |
Statuses
| Status | Meaning | Exit code |
|---|---|---|
| PASS | Metric is within acceptable range | 0 |
| WARNING | Minor deviation (exceeded warn) |
0 (or 1 if fail_on: "WARNING") |
| DEGRADATION | Significant degradation (exceeded fail) |
1 |
| NO_DATA | The check should have run but there was nothing to measure: the run recorded 0 requests, fewer than gate.min_requests, or the metric a rule names was never produced |
1 (regardless of fail_on) |
| SKIP | The check does not apply yet — typically a first run with no baseline to compare against | 0 |
NO_DATA is deliberately not a pass. A run that never reached the target still writes a stats CSV full of zeros, and every latency threshold passes because 0 < 500; treating that as green means the build goes through on a test that never happened. If you have a pipeline where empty runs are expected and acceptable, set "allow_no_data": true in the analysis section to downgrade NO_DATA back to SKIP.
min_requests defaults to 1 when you do not set it, so a zero-request run is caught even without an explicit floor.
Gate Checks
Gate checks work without a baseline — they validate absolute metric values against fixed thresholds. Use them to enforce SLAs: "error rate under 5%", "p95 under 500ms".
Thresholds define boundaries: if a metric exceeds warn — WARNING, fail — DEGRADATION.
Each threshold has a direction — which way is bad. Default is "increase" (higher = worse), for rps use "decrease" (lower = worse). Example: "rps": {"fail": 100, "direction": "decrease"} — fails if RPS drops below 100.
For error metrics (error_rate, failures, etc.) warn: 0 is set automatically — any errors below fail result in WARNING instead of PASS.
{
  "analysis": {
    "gate": {
      "min_requests": 200,                     // minimum requests for check (otherwise NO_DATA; default 1)
      "warmup_seconds": 10,                    // first N seconds are excluded (see note below)
      "thresholds": {
        "error_rate": {"fail": 5},             // total error rate < 5% (warn = 0 auto)
        "error_rate_503": {"fail": 2},         // 503 errors < 2%
        "p95_ms": {"warn": 300, "fail": 500},  // p95 latency
        "rps": {"fail": 100, "direction": "decrease"}  // RPS not below 100
      }
    }
  }
}
Setting warmup_seconds switches the gate from Locust's end-of-run totals to
its stats history, so the ramp-up is excluded from the numbers the thresholds
see. The history is a series of samples, and each row records a rate over the
window it covers — so the window length matters. Locomotive reads the actual
interval from the timestamps rather than assuming one second per row, which is
what it does if you pass --csv-full-history with a non-default interval via
extra_args. Gaps in the history (Locust stopped reporting for a while) are not
credited as if one sample covered the whole silence.
Available metrics for threshold checks
Thresholds can be specified as objects {"warn": N, "fail": M} or shorthand numbers — "error_rate": 5 is equivalent to "error_rate": {"fail": 5}.
Error rates:
| Metric | Description |
|---|---|
error_rate |
Total error percentage |
error_rate_4xx |
4xx error percentage |
error_rate_5xx |
5xx error percentage |
error_rate_503 |
503 error percentage |
error_rate_non_503 |
Non-503 error percentage (graceful degradation) |
Absolute error counts:
| Metric | Description |
|---|---|
failures |
Total failure count |
failures_4xx |
4xx failure count |
failures_5xx |
5xx failure count |
failures_503 |
503 failure count |
failures_non_503 |
Non-503 failure count |
Latency & throughput:
| Metric | Description |
|---|---|
avg_ms |
Average response time |
median_ms |
Median response time |
p95_ms |
95th percentile |
p99_ms |
99th percentile |
rps |
Requests per second (use "direction": "decrease") |
artifacts section
Result storage settings:
{
  "artifacts": {
    "storage": "artifacts",              // artifact storage directory (default: "artifacts")
    "run_id": "${GITHUB_SHA:-local}",    // run ID; in CI resolves to commit SHA, locally — "local"
    "history": 30                        // number of recent runs to keep for trend charts (0 = disabled)
  }
}
| Parameter | Default | Description |
|---|---|---|
storage |
"artifacts" |
Artifact directory path |
run_id |
timestamp | Run ID; defaults to run-<timestamp>, in CI resolves to GITHUB_SHA / GITHUB_RUN_ID / CI_PIPELINE_ID |
history |
0 (disabled) |
Number of runs in history.json for trend charts; 0 disables history tracking |
Every file Locomotive writes into the artifact directory is written whole or not
at all: it goes to a temporary file in the same directory, is flushed to disk,
and is then renamed into place. A run interrupted mid-write — Ctrl-C, a CI job
cancelled, a full disk — leaves the previous baseline.json and history.json
intact instead of a truncated file that the next run cannot parse.
GitHub Actions
Recommended approach (pip install)
Locomotive is available on the public PyPI registry.
name: Load Test

on:
  push:
    branches: [main]
  pull_request:

jobs:
  loadtest:
    runs-on: ubuntu-latest
    steps:
      - uses: actions/checkout@v4

      - name: Set up Python
        uses: actions/setup-python@v5
        with:
          python-version: '3.12'

      - name: Install
        run: pip install locomotive

      - name: Start service
        run: docker-compose up -d
        # or however you start your service

      - name: Run load test
        run: loco --config loconfig.json ci --set-baseline
        env:
          API_TOKEN: ${{ secrets.API_TOKEN }}  # if auth is needed

      - name: Upload results
        uses: actions/upload-artifact@v4
        if: always()
        with:
          name: loadtest-results
          path: artifacts/
Built-in Action (with HTML reports, PR comments, and artifacts)
Locomotive ships with a GitHub Action that handles everything: installation, test execution, HTML report generation, baseline management, and artifact uploads.
name: Load Test

on:
  push:
    branches: [main]
  pull_request:

jobs:
  loadtest:
    runs-on: ubuntu-latest
    steps:
      - uses: actions/checkout@v4

      - name: Set up Python
        uses: actions/setup-python@v5
        with:
          python-version: '3.12'

      - name: Run load test
        uses: locomotive-lib/locomotive/.github/actions/loadtest@master
        with:
          config: loconfig.json
The Action automatically:
- Installs
locomotivefrom PyPI - Downloads branch-aware baseline — on PR uses the target branch's baseline, on push uses the current branch's baseline, with fallback to
main - Runs tests, analysis, and generates the HTML report
- Uploads the HTML report and all artifacts (metrics, analysis, CSV) to GitHub Actions Artifacts
- Saves baseline on successful runs (
set_baseline: trueby default) - Posts a summary with metrics as a PR comment
Action parameters:
| Parameter | Default | Description |
|---|---|---|
config |
loconfig.json |
Config file path |
users |
from config | Override user count |
run_time |
from config | Override test duration |
set_baseline |
true |
Save run as baseline on success |
post_pr_comment |
true |
Post results as a PR comment |
baseline_artifact |
loadtest-baseline |
Artifact name for baseline storage |
results_artifact |
loadtest-results |
Artifact name for results |
workflow |
(empty) | Workflow file name to search for baseline artifacts (empty = search all workflows) |
fallback_branch |
main |
Fallback branch when no branch-specific baseline exists |
github_token |
github.token |
Token for PR comments. Uses the built-in github.token by default — no need to create a separate token |
Action outputs:
| Output | Description |
|---|---|
metrics_path |
Path to metrics.json |
report_path |
Path to report.html |
status |
Run status: PASS, WARNING, or DEGRADATION |
Report Customization
The report section in the config lets you customize the HTML report: theme, colors, branding, KPI cards, charts, endpoint table, and trends.
Presets
The quickest way — pick a preset. A preset defines a set of KPI cards, charts, and trends. You can override any preset settings — your overrides take priority.
{
  "report": {
    "preset": "default"    // "default" | "latency" | "throughput" | "errors"
  }
}
| Preset | Focus | KPI cards | Charts |
|---|---|---|---|
default |
Balanced overview | rps, avg_ms, p95_ms, error_rate, requests, duration | throughput + response_time |
latency |
Response time | avg, median, p95, p99, max, duration | response_time |
throughput |
Throughput | rps, requests, error_rate, duration | throughput |
errors |
Errors | error_rate, 4xx, 5xx, 503, failures, duration | throughput (titled "Errors Over Time", shows errors/s and RPS) |
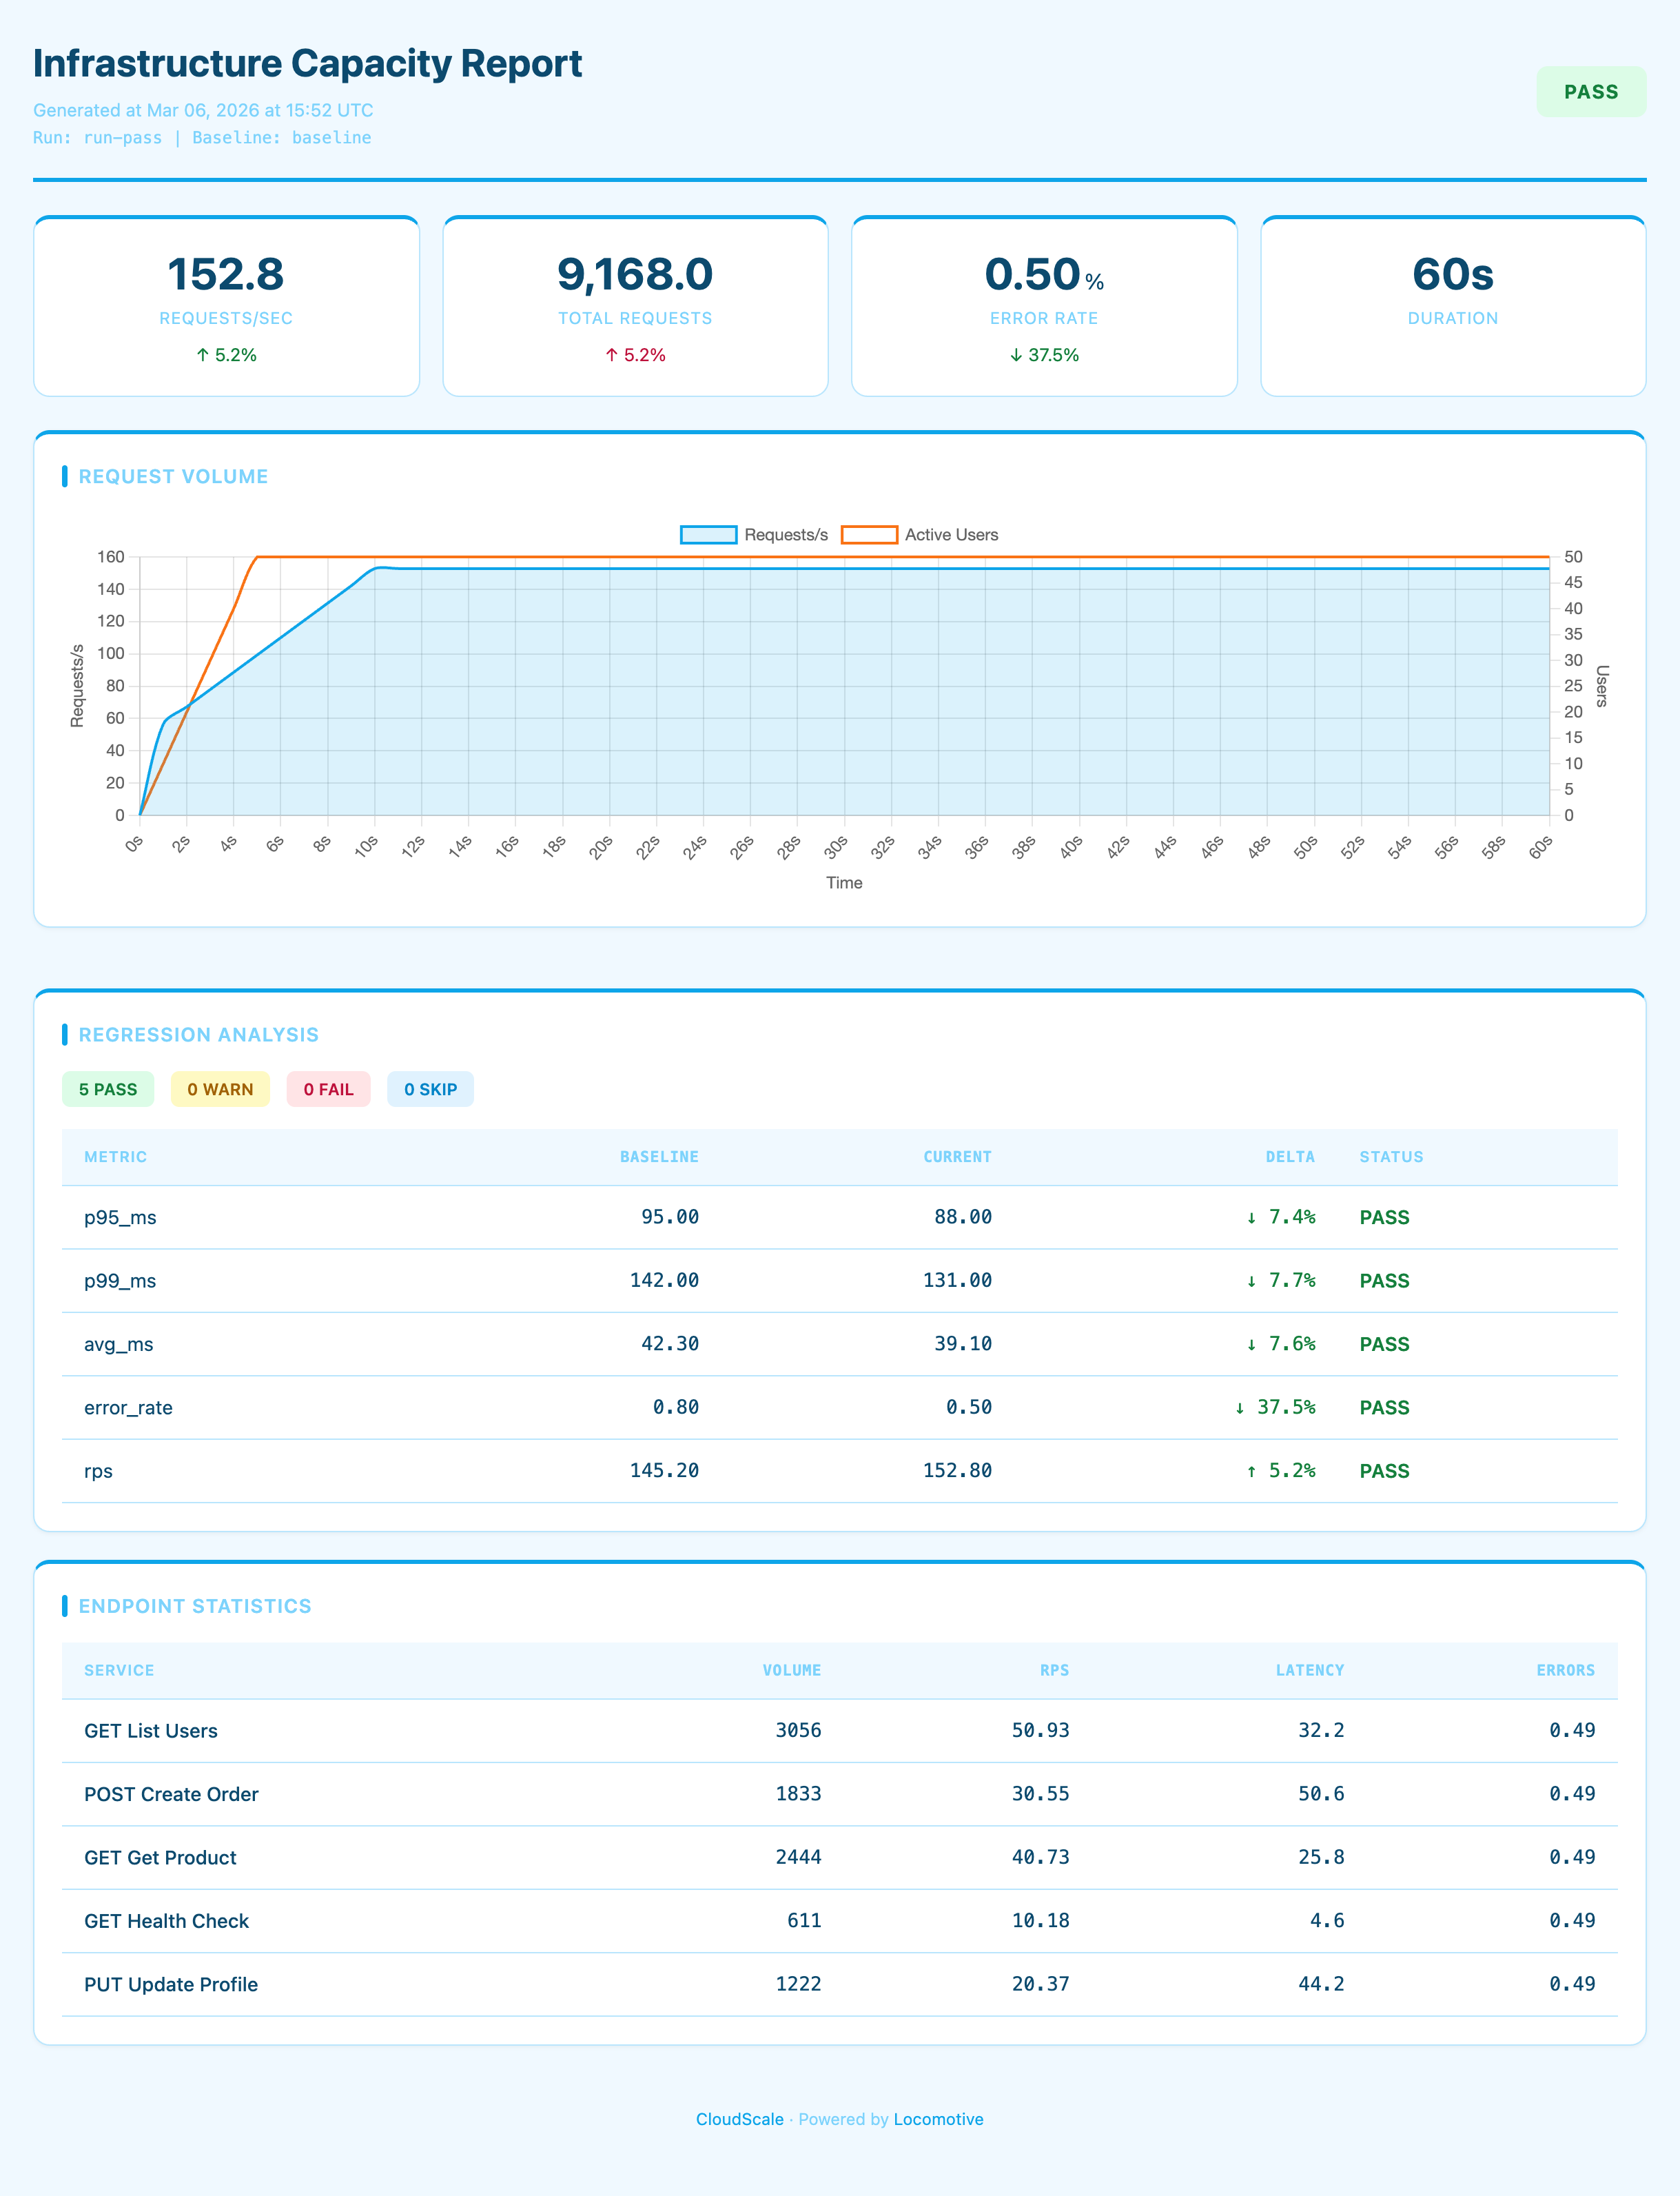
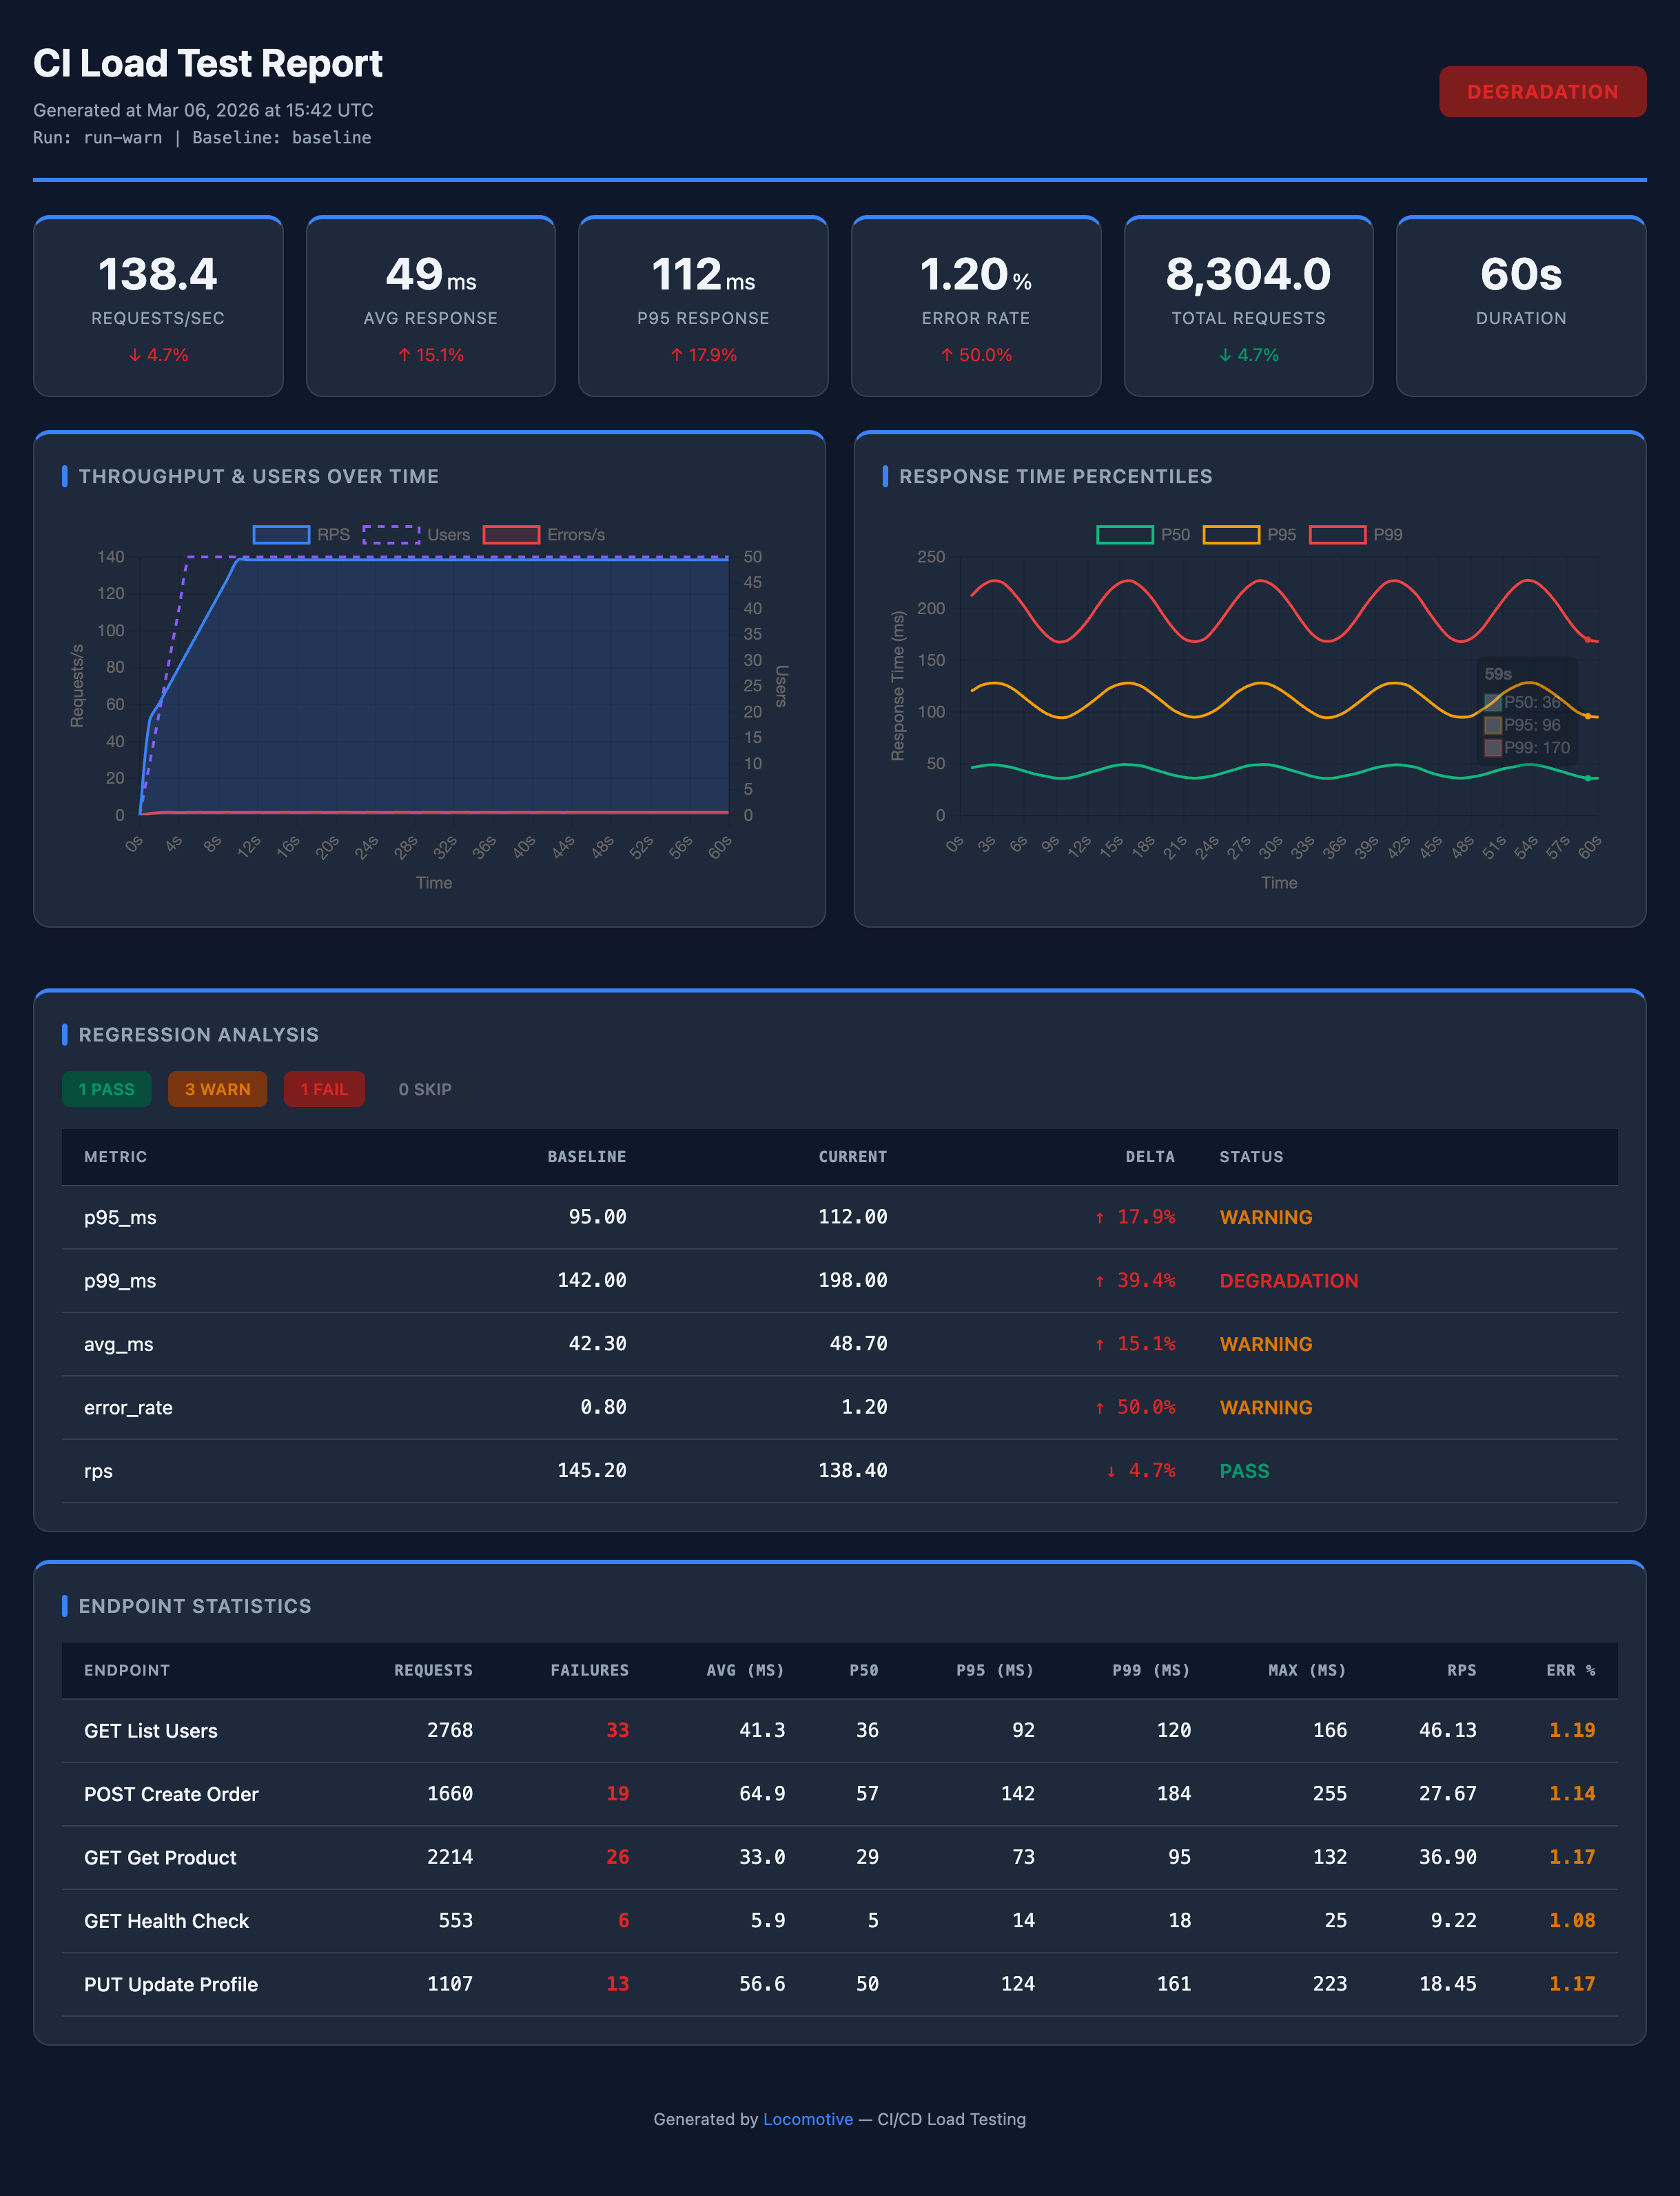
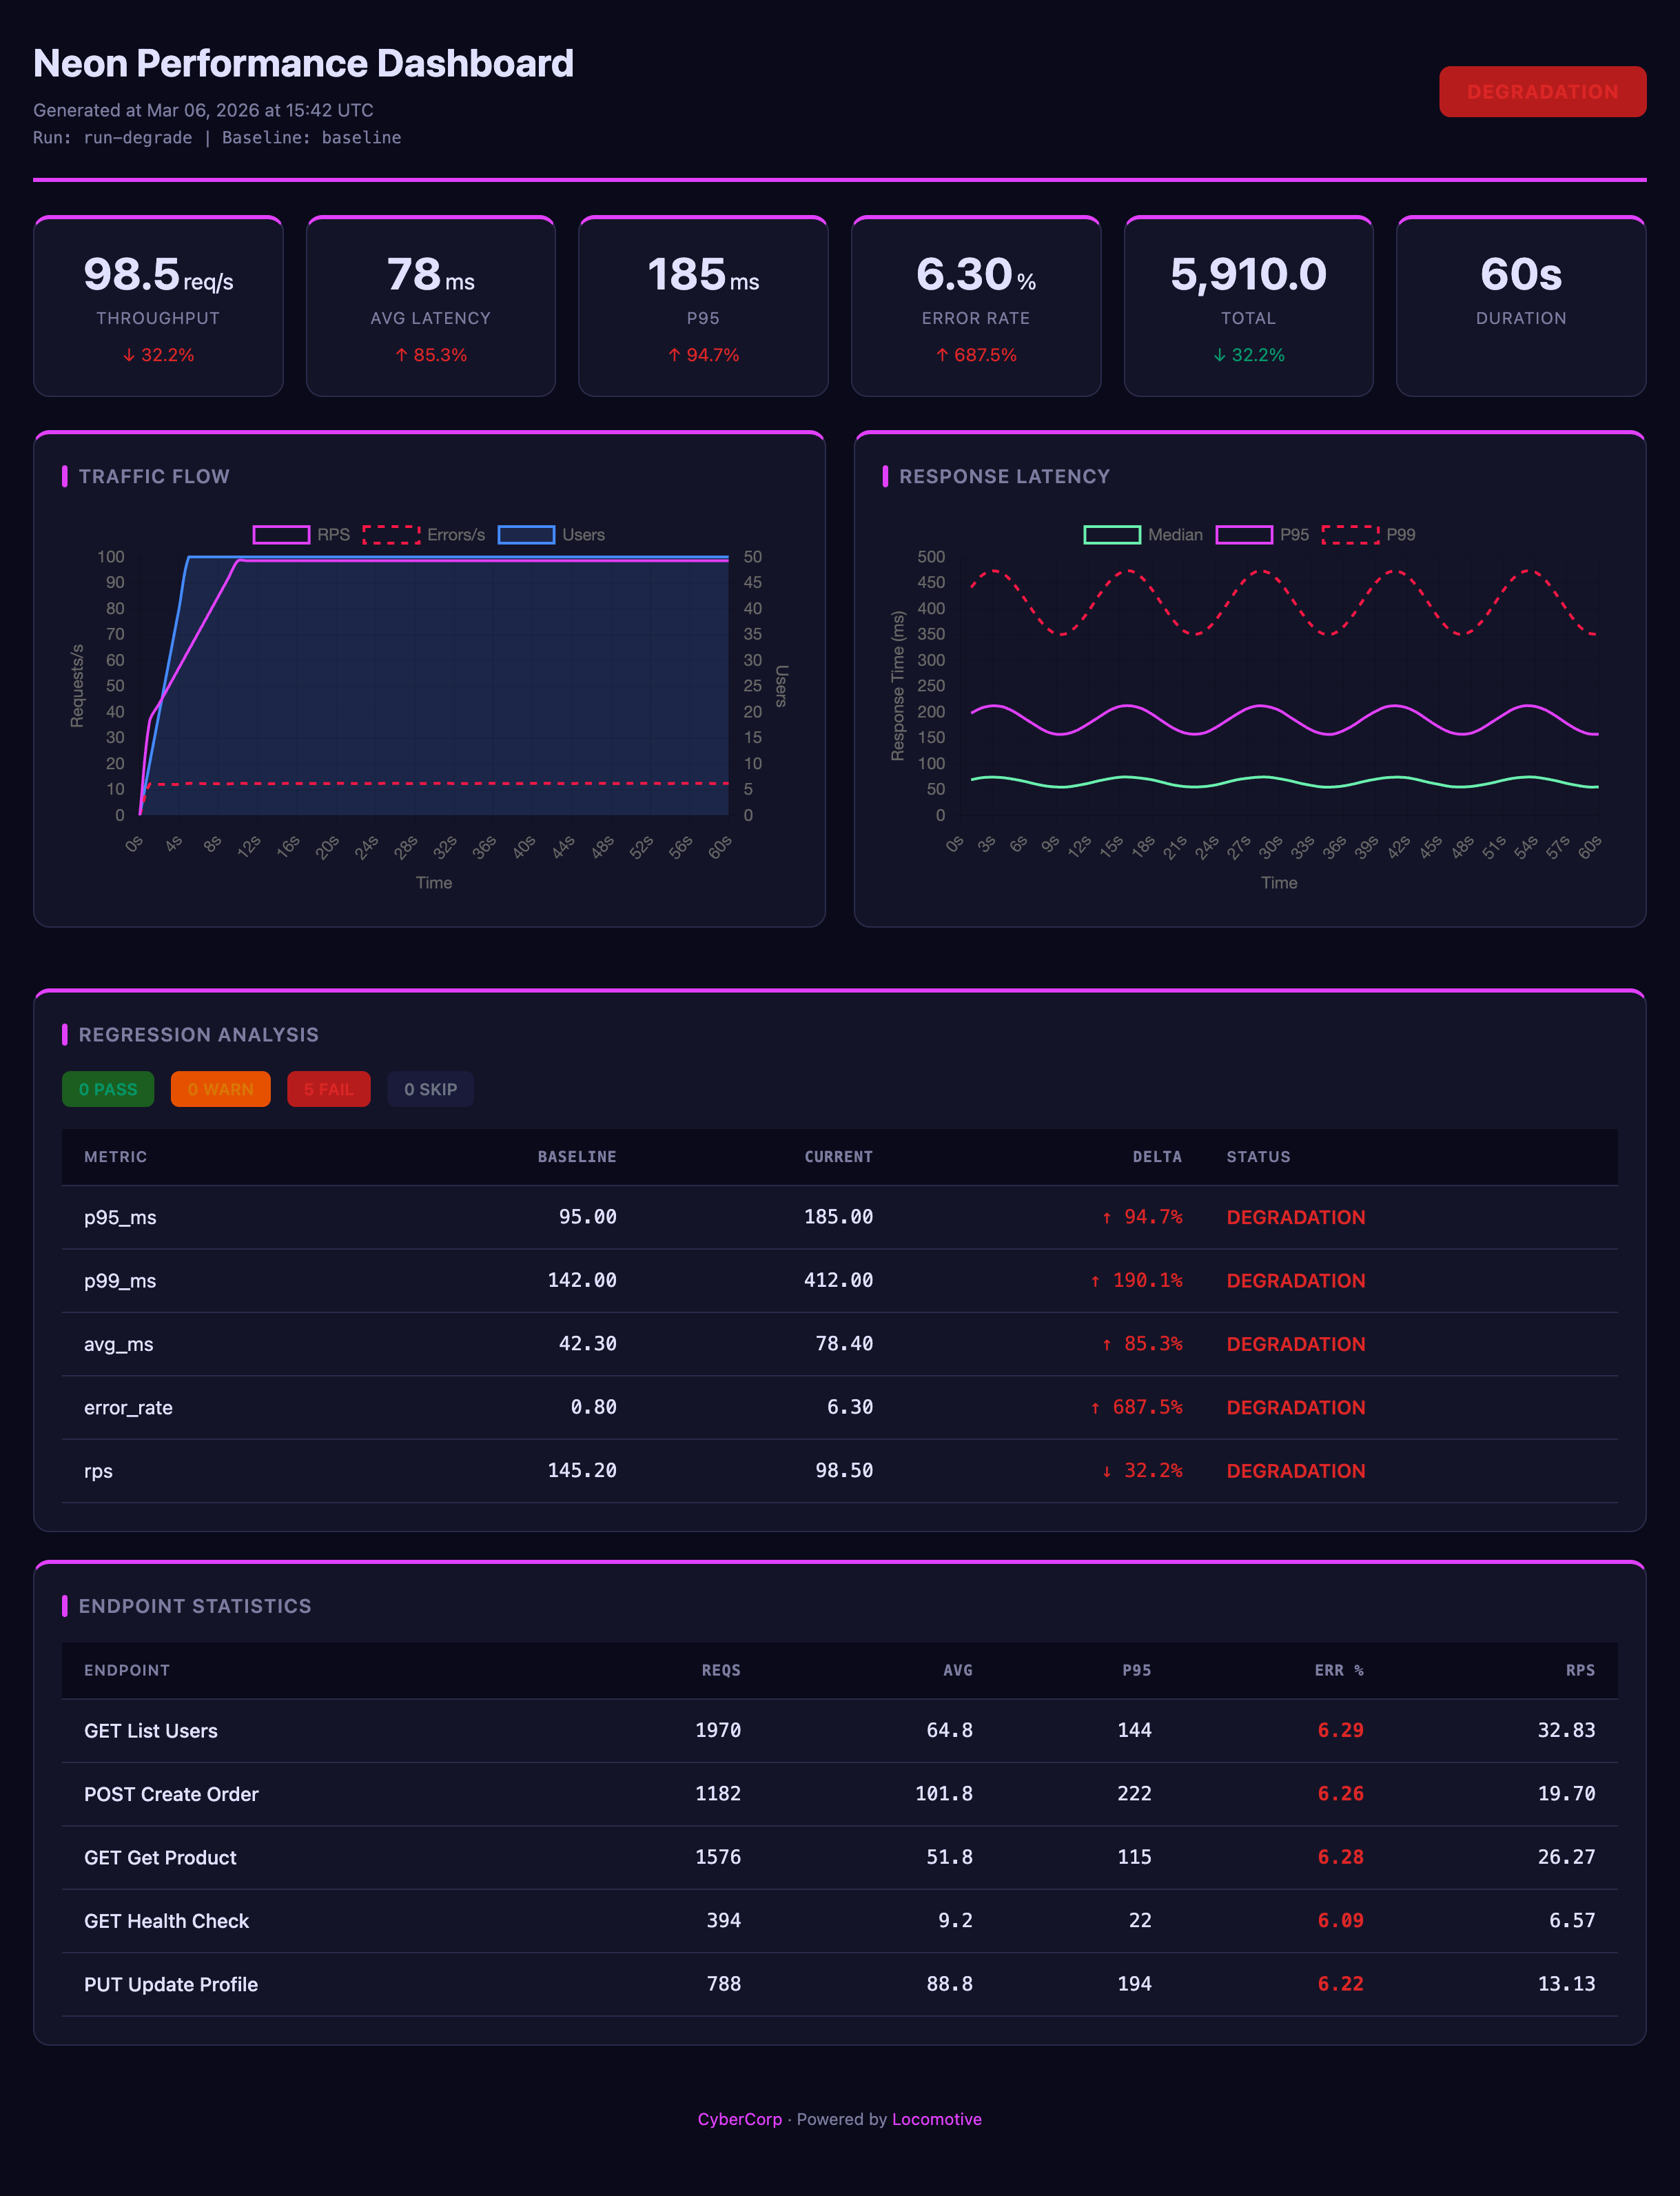
Throughput — throughput preset + custom pastel theme + branding
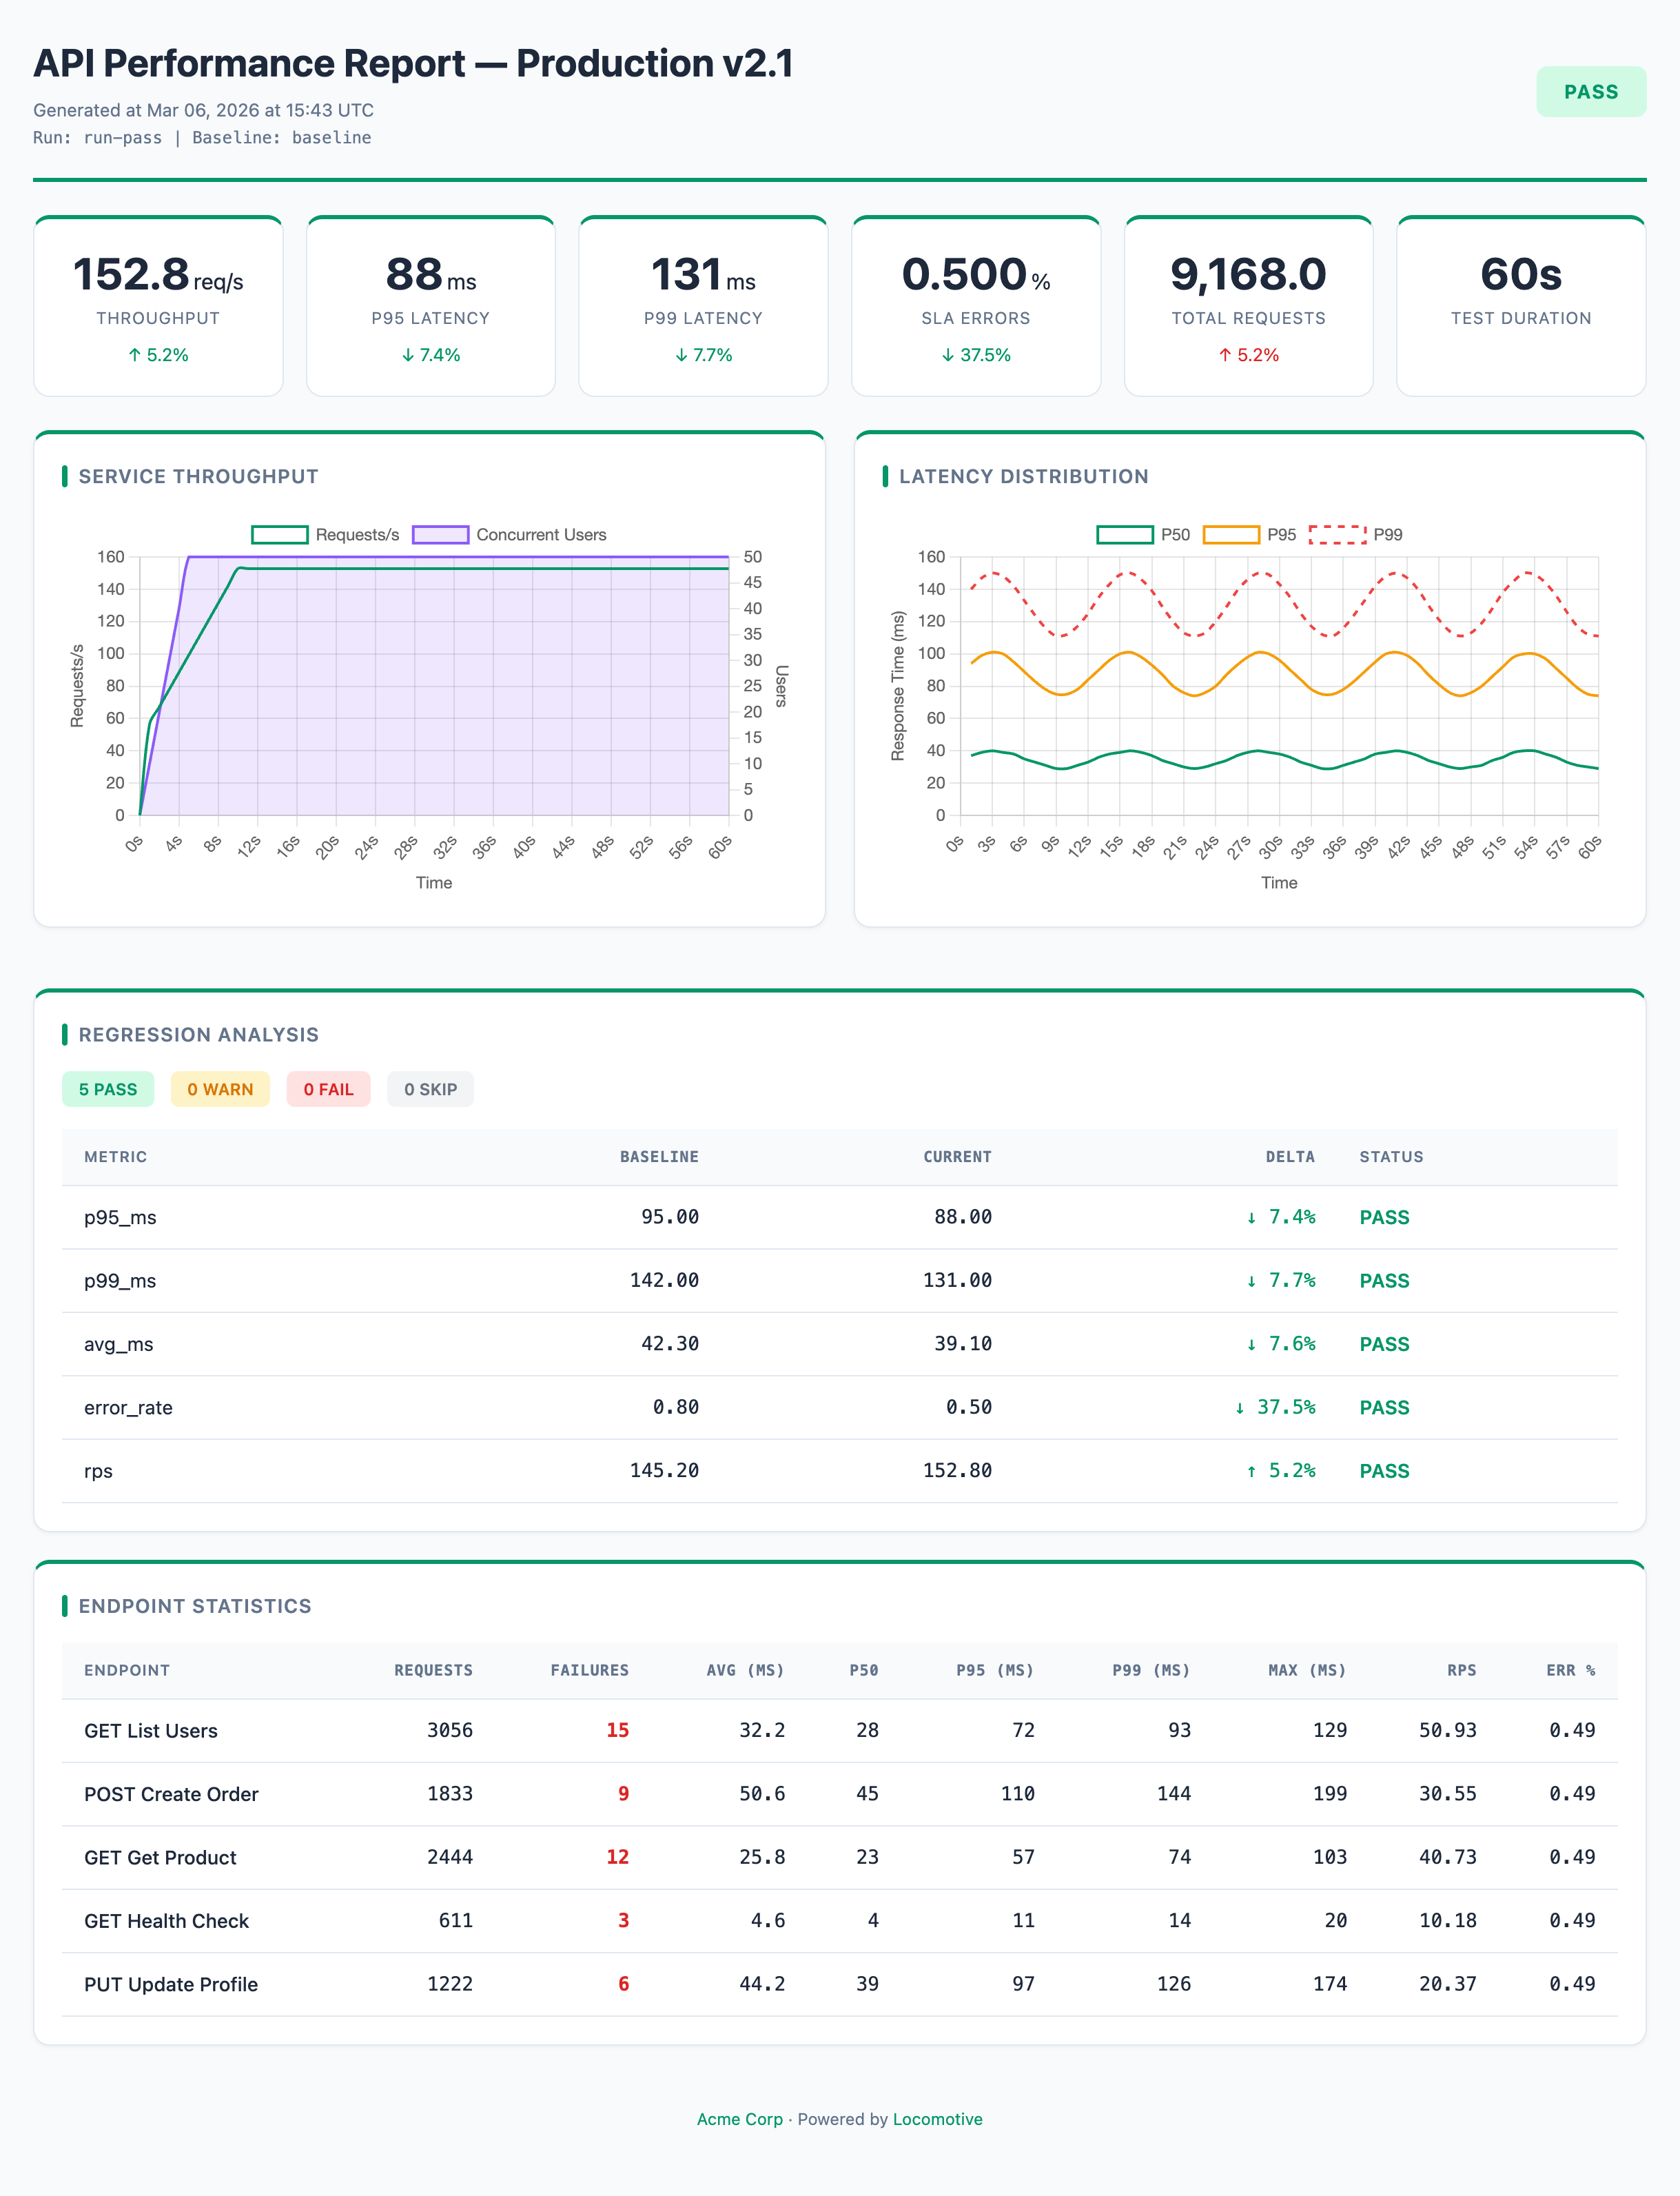
Branded — default preset + custom KPI cards + branding + accent #059669
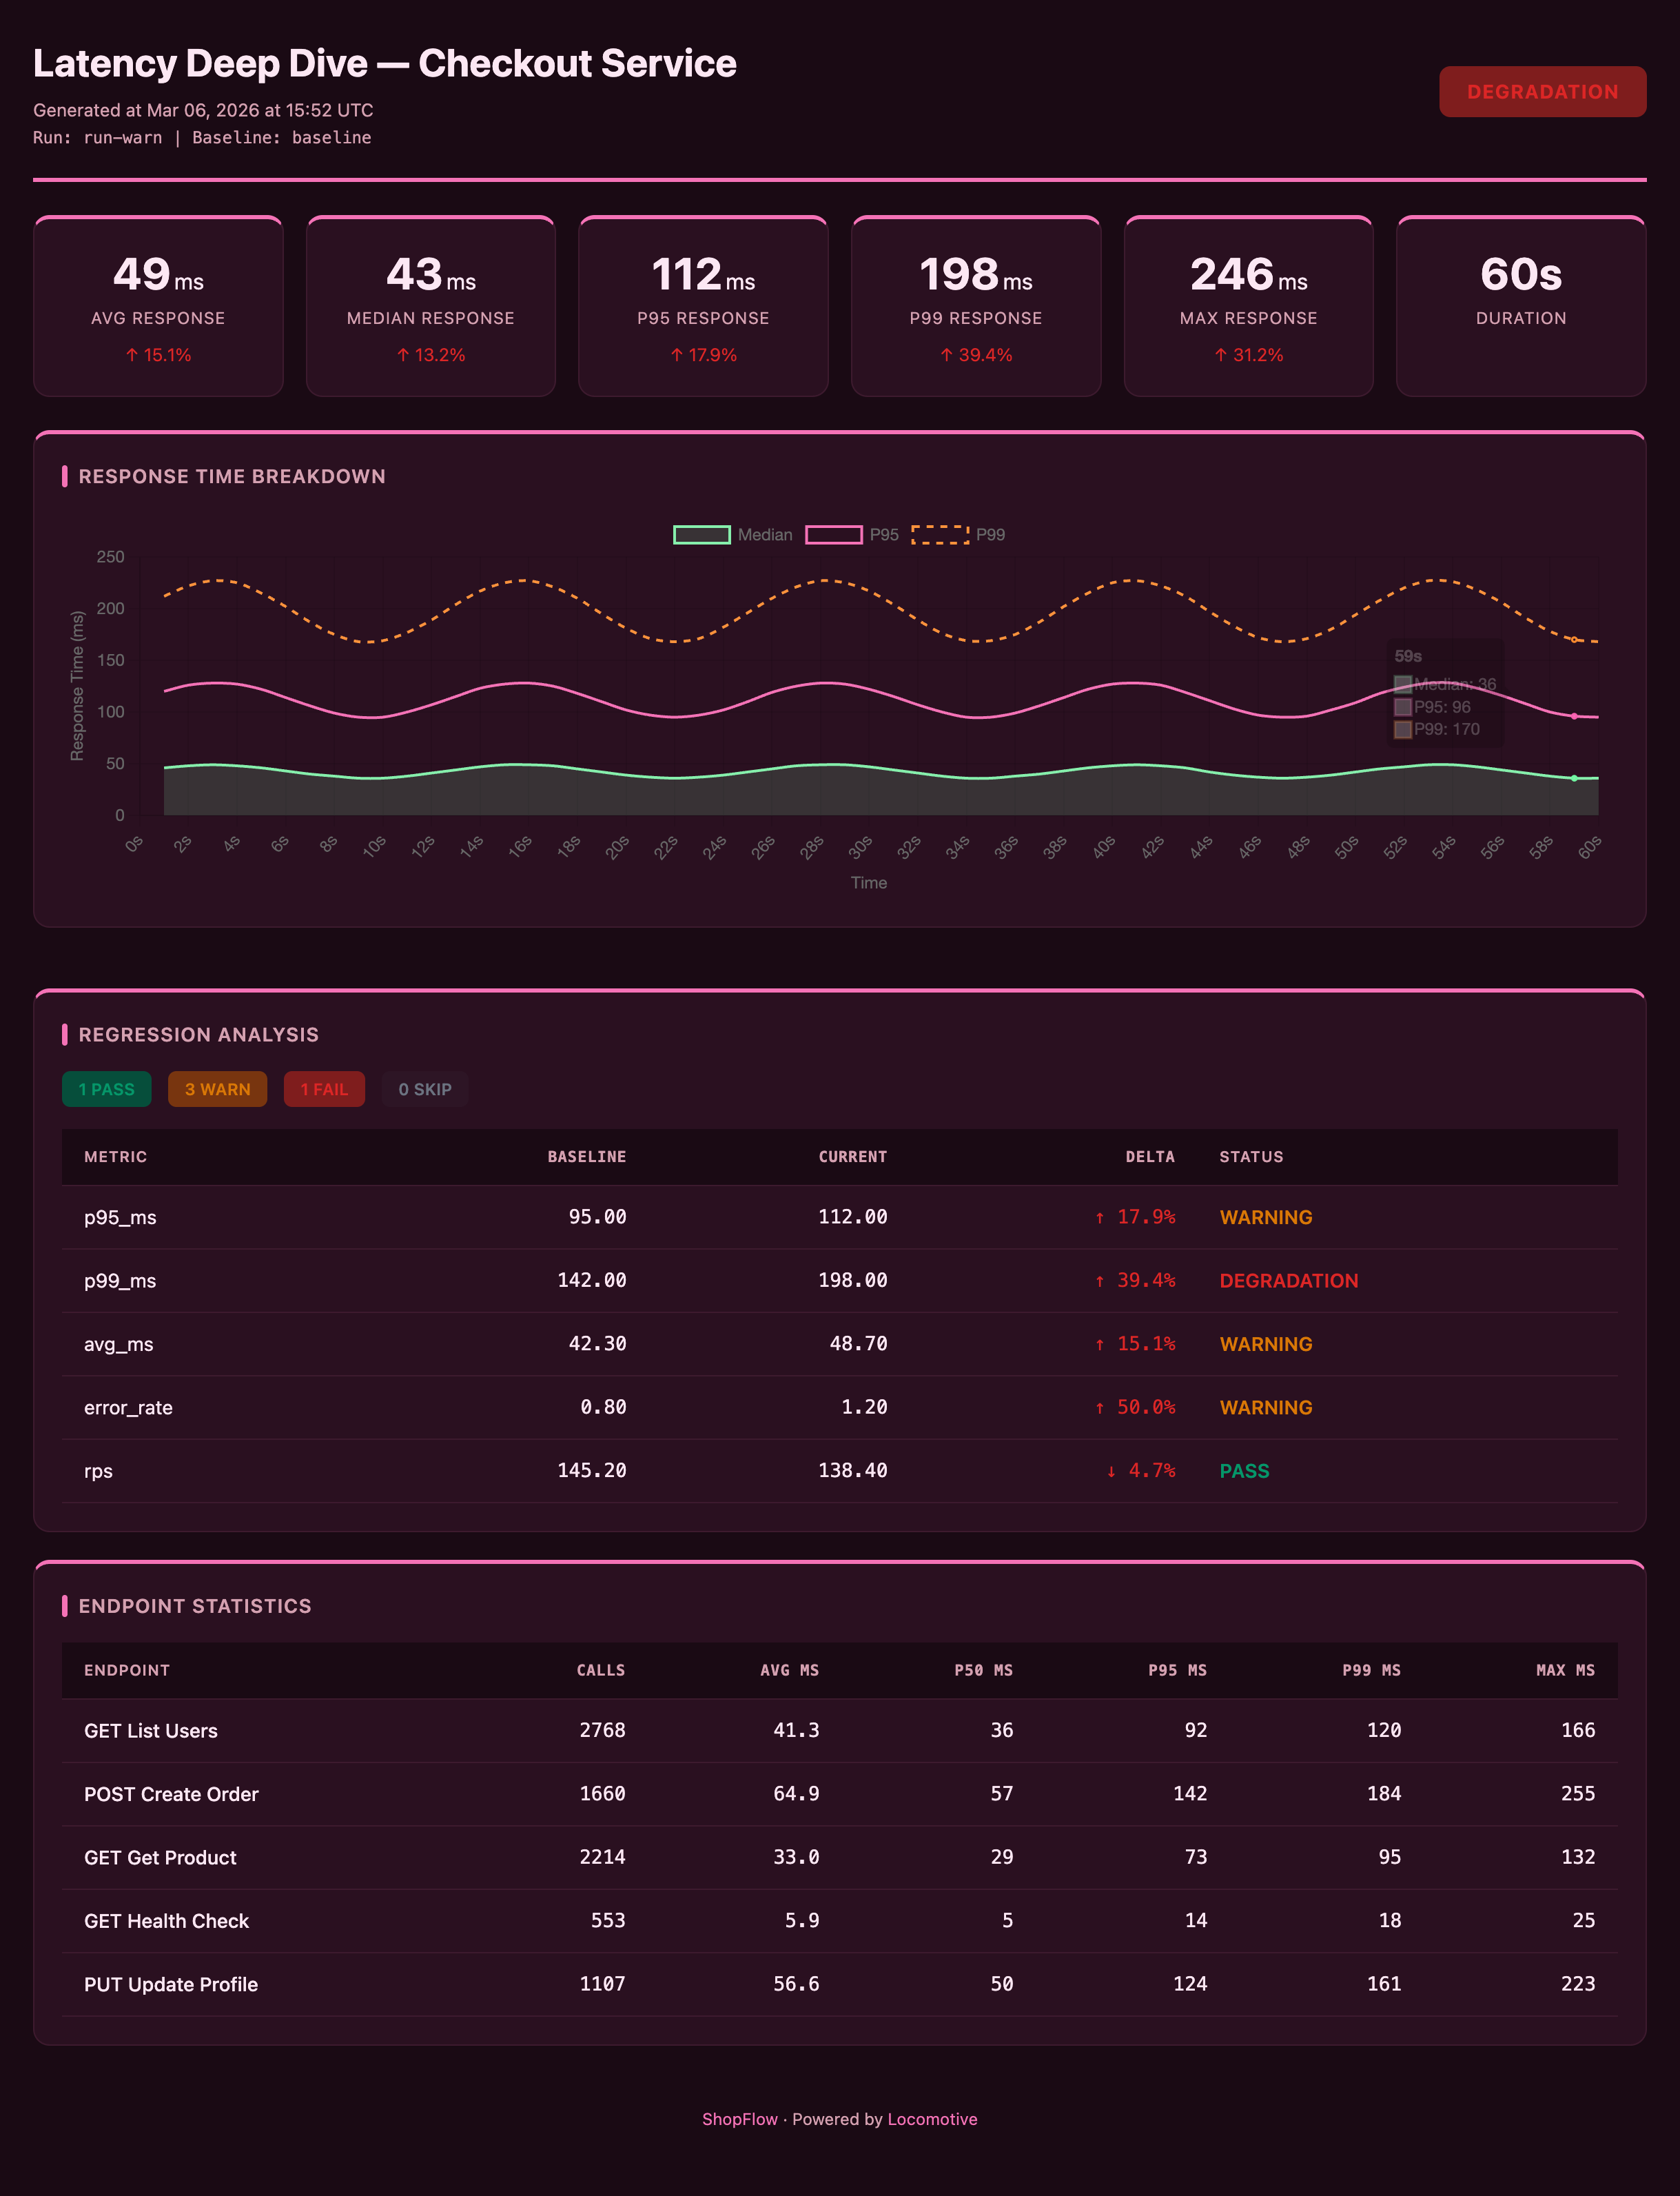
Latency — latency preset + custom dark theme + branding
Errors — errors preset + dark theme, accent #ef4444
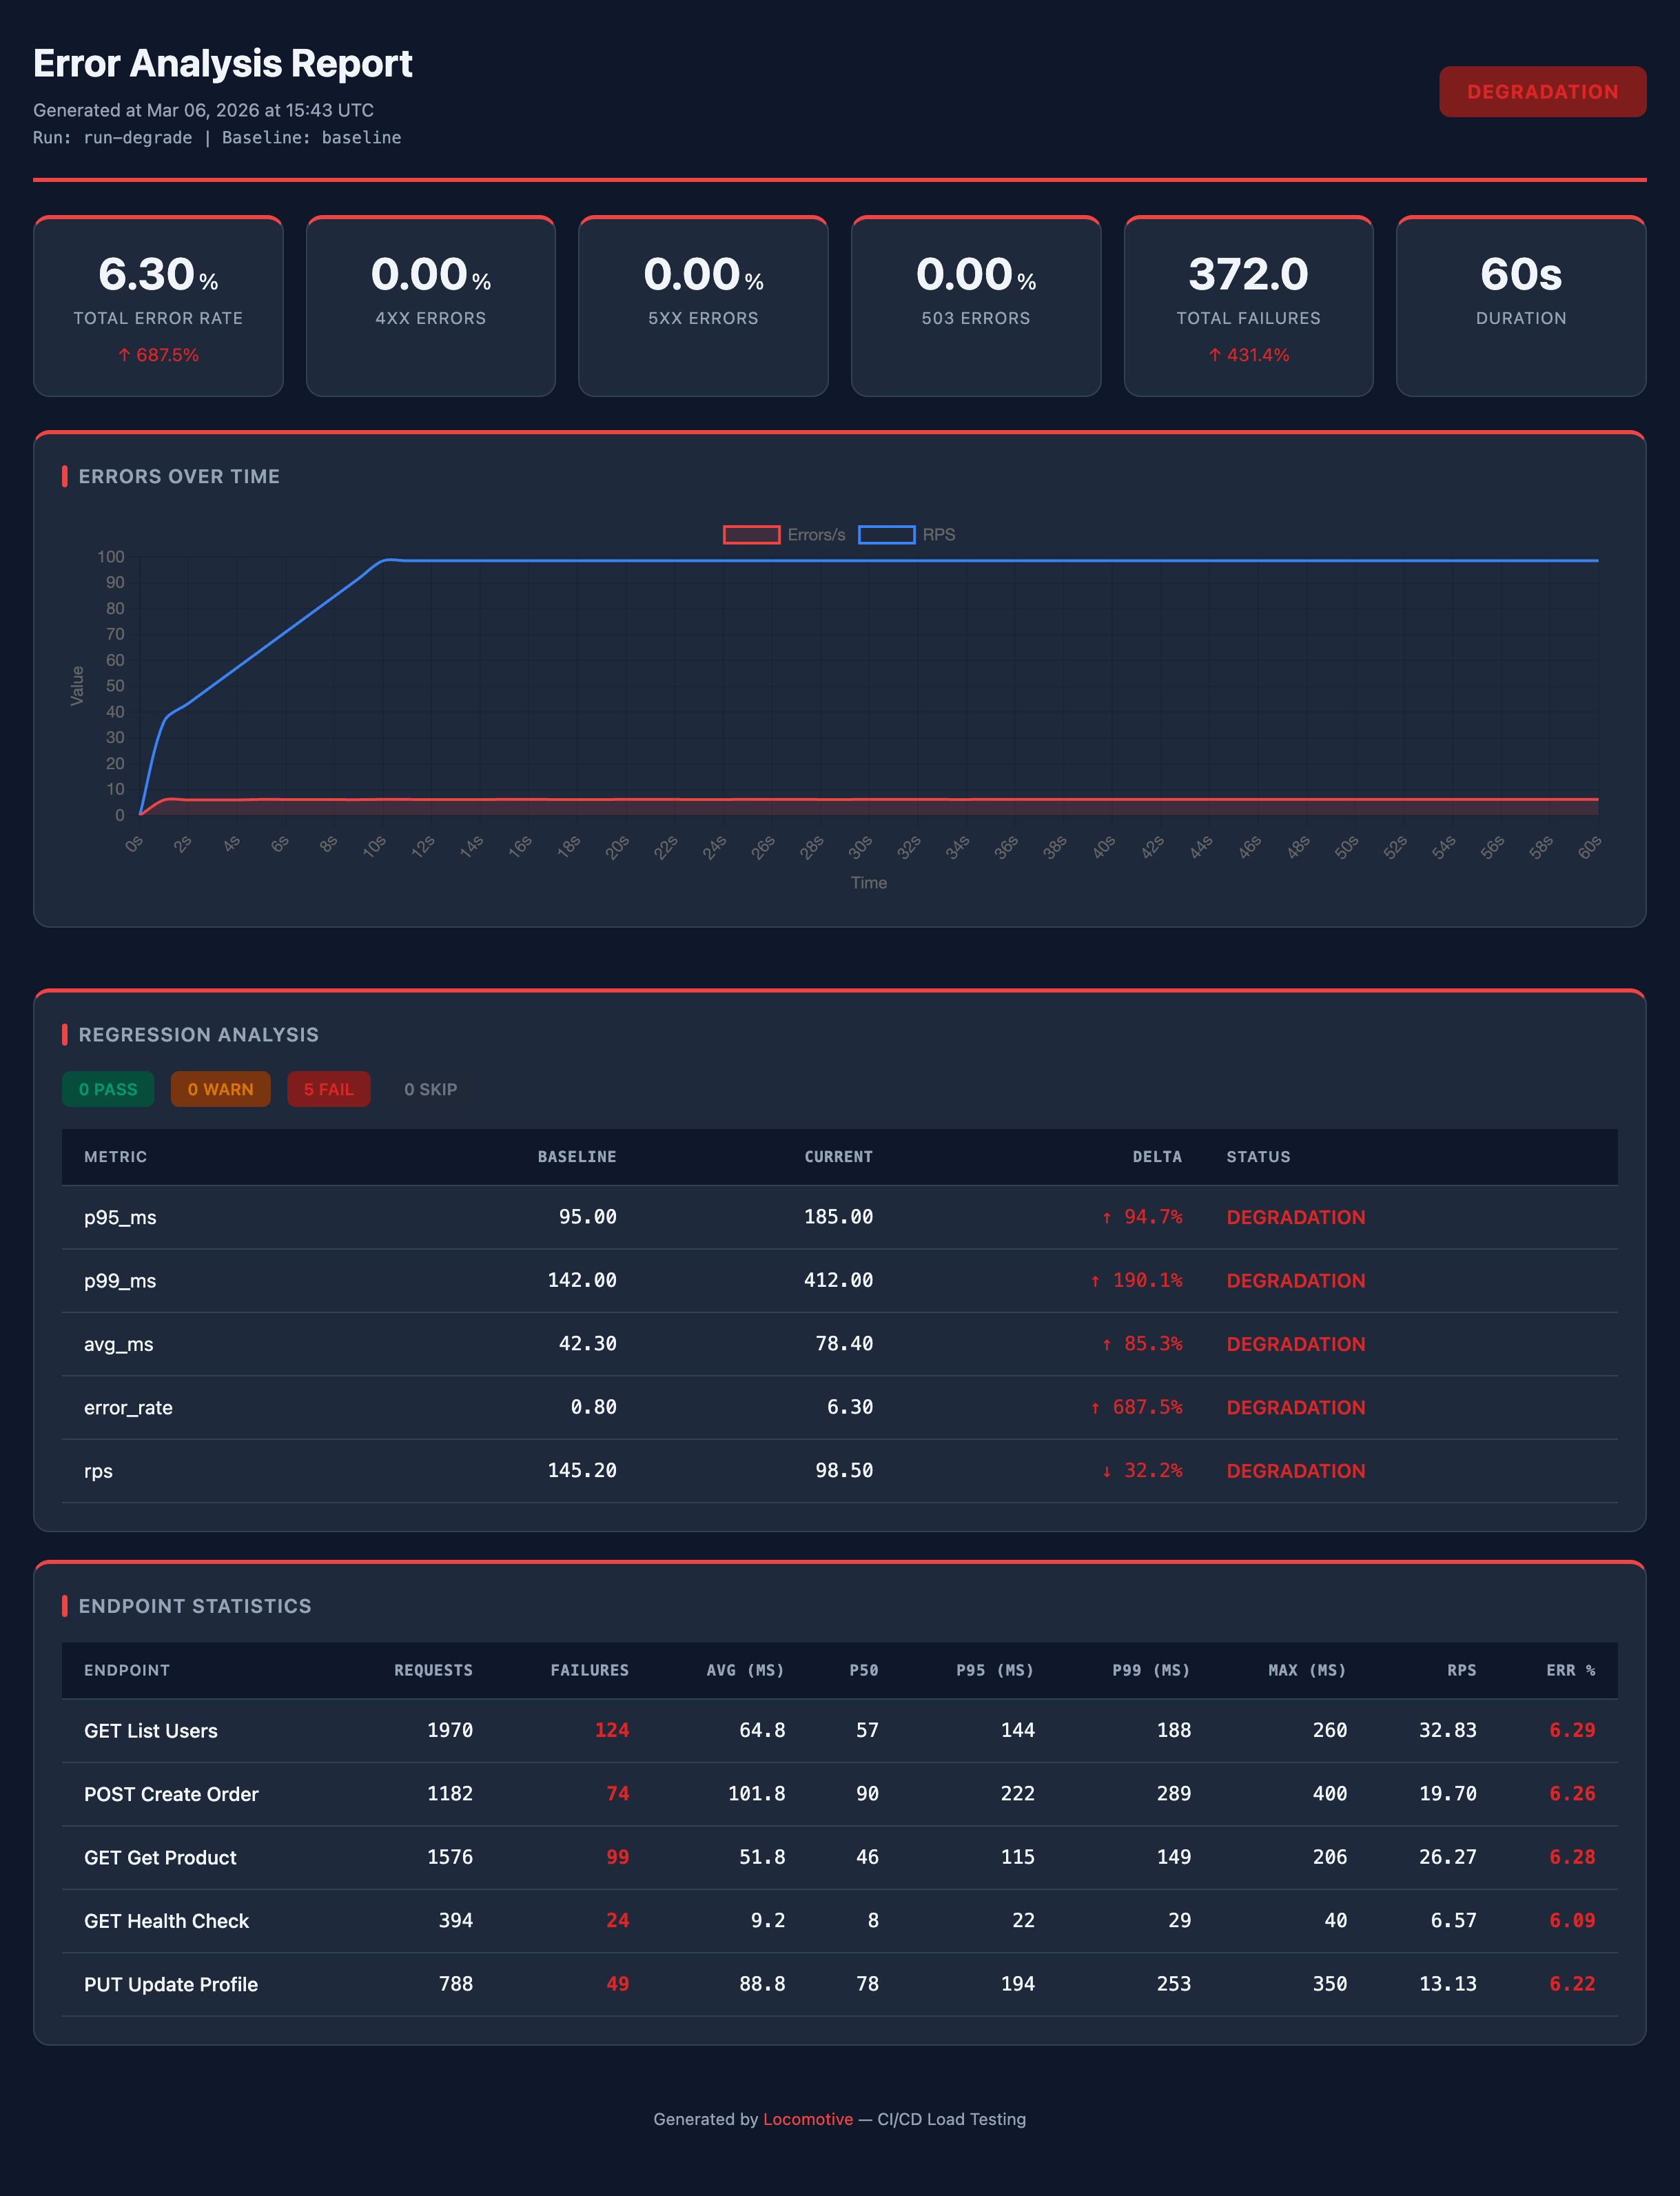
All reports above are examples of customization on top of presets: theme, colors, branding, and card layout are configured in the report section.
Theme & colors
By default, the report uses a light theme. To switch to dark mode, just set "mode": "dark" — no additional configuration needed:
"theme": {"mode": "dark"}
{
  "report": {
    "title": "Load Test Report — My Service",  // report title
    "output": "artifacts/report.html",          // HTML report path (default: inside run dir)
    "timezone": "UTC+3",                        // timezone: "UTC", "UTC+3", "UTC-5:30"
    "theme": {
      "mode": "light",                          // "light" or "dark"
      "color": "#6366f1"                        // accent color (shortcut for primary)
    }
  }
}
Branding
Display your company or project name in the report footer:
{
  "report": {
    "branding": {
      "name": "CompanyName",              // name shown in the report footer
      "color": "#ffffff"                  // footer text color
    }
  }
}
Full color control
All theme CSS variables can be overridden:
{
  "report": {
    "theme": {
      "mode": "dark",
      "colors": {
        "primary": "#6366f1",       // accent color (card borders, header)
        "primary-light": "#818cf8", // lighter accent variant
        "bg": "#0f172a",            // page background
        "card": "#1e293b",          // card background
        "text": "#f8fafc",          // primary text
        "text-muted": "#94a3b8",    // secondary text
        "line": "#334155",          // lines and borders
        "pass-bg": "#166534",       // PASS status background
        "warn-bg": "#854d0e",       // WARNING status background
        "fail-bg": "#991b1b",       // DEGRADATION status background
        "skip-bg": "#374151"        // SKIP status background
      }
    }
  }
}
Colour values go straight into the report's stylesheet, so they are restricted
to what a colour can look like: hex (#3b82f6), functional notation
(rgba(0,0,0,.5)), a named colour, var(--something), or a short shorthand
like 1px solid red. Anything containing the characters that would end a
declaration or open a url() is dropped and the default kept — a report is a
build artifact that gets emailed around and served from CI, and a config value
should not be able to put arbitrary markup in it. loco validate warns about
any colour that would be dropped, so a theme that silently comes out the default
shade of blue takes two lines to diagnose rather than an afternoon.
KPI cards
Cards at the top of the report with key run metrics. Each card shows a metric value and delta against baseline (if available). You can customize which metrics to show, labels, number formatting, and units:
{
  "report": {
    "kpi": {
      "cards": [
        {"metric": "rps", "label": "Requests/sec", "format": "{value:.1f}"},
        {"metric": "p95_ms", "label": "P95 Latency", "format": "{value:.0f}", "unit": "ms"},
        {"metric": "error_rate", "label": "Errors", "format": "{value:.2f}", "unit": "%"},
        {"metric": "requests", "label": "Total", "format": "{value:,}"},
        {"metric": "duration", "label": "Duration", "format": "duration"}
      ]
    }
  }
}
| Field | Description |
|---|---|
metric |
Metric key (rps, avg_ms, p95_ms, p99_ms, error_rate, requests, duration, etc.) |
label |
Card label |
format |
Python format string ("{value:.2f}") or "duration" for auto time formatting |
unit |
Unit of measure ("ms", "%") |
multiplier |
Value multiplier before display (default: 1.0) |
Charts
Two built-in charts: throughput (RPS, errors, users over time) and response_time (percentiles over time). You can enable/disable charts, change titles, and configure datasets (which lines to show, colors, axes):
{
  "report": {
    "charts": {
      "throughput": {
        "enabled": true,                // show chart (default: true)
        "title": "Throughput",          // chart title
        "datasets": [
          {"key": "rps", "label": "RPS", "color": "#3b82f6", "y_axis": "left"},
          {"key": "errors", "label": "Errors/s", "color": "#ef4444", "y_axis": "right", "dash": [5, 5]},
          {"key": "users", "label": "Users", "color": "#a855f7", "y_axis": "right", "fill": true}
        ]
      },
      "response_time": {
        "enabled": true,
        "title": "Response Time",
        "datasets": [
          {"key": "p50", "label": "Median", "color": "#22c55e"},
          {"key": "p95", "label": "P95", "color": "#f59e0b"},
          {"key": "p99", "label": "P99", "color": "#ef4444", "dash": [5, 5]}
        ]
      }
    }
  }
}
| Dataset field | Description |
|---|---|
key |
Data key: rps, users, errors, p50, p95, p99 |
label |
Legend label |
color |
Line color (hex) |
y_axis |
Axis: "left" or "right" for dual scale |
fill |
true — fill area under the line |
dash |
Dashed line: [length, gap], e.g. [5, 5] |
In the
errorspreset, thethroughputchart is titled "Errors Over Time" and configured to show errors/s and RPS. There is no separate "errors over time" chart type — it's a customizedthroughput.
Endpoint table
Table at the bottom of the report with per-endpoint metrics (one row per name in requests). You can configure columns and set thresholds for cell highlighting — yellow for warn, red for fail:
{
  "report": {
    "endpoint_table": {
      "columns": [
        {"key": "name", "label": "Endpoint"},
        {"key": "requests", "label": "Requests"},
        {"key": "p95", "label": "P95", "highlight": {"warn": 300, "fail": 500}},
        {"key": "error_rate", "label": "Error %", "highlight": {"fail": 5}}
      ]
    }
  }
}
Available column keys: name, requests, failures, avg, p50, p95, p99, max, rps, error_rate.
Sections & trends
Control which sections appear in the report and in what order:
{
  "report": {
    "sections": ["kpi", "charts", "regression", "endpoints", "trends"]
  }
}
By default: kpi, charts, regression, endpoints. The trends section is not included by default — it must be added explicitly.
Trends are additional charts showing how selected metrics changed across runs. For example, you can see that p95 latency has been gradually increasing over the last 20 runs. Requirements:
- Add
"trends"tosections - Set
artifacts.history> 0 (how many runs to keep) - At least 2 runs in history
Configure which metrics to show on trend charts (each metric gets its own chart):
{
  "report": {
    "trends": {
      "metrics": ["p95_ms", "rps", "error_rate"]
    }
  }
}
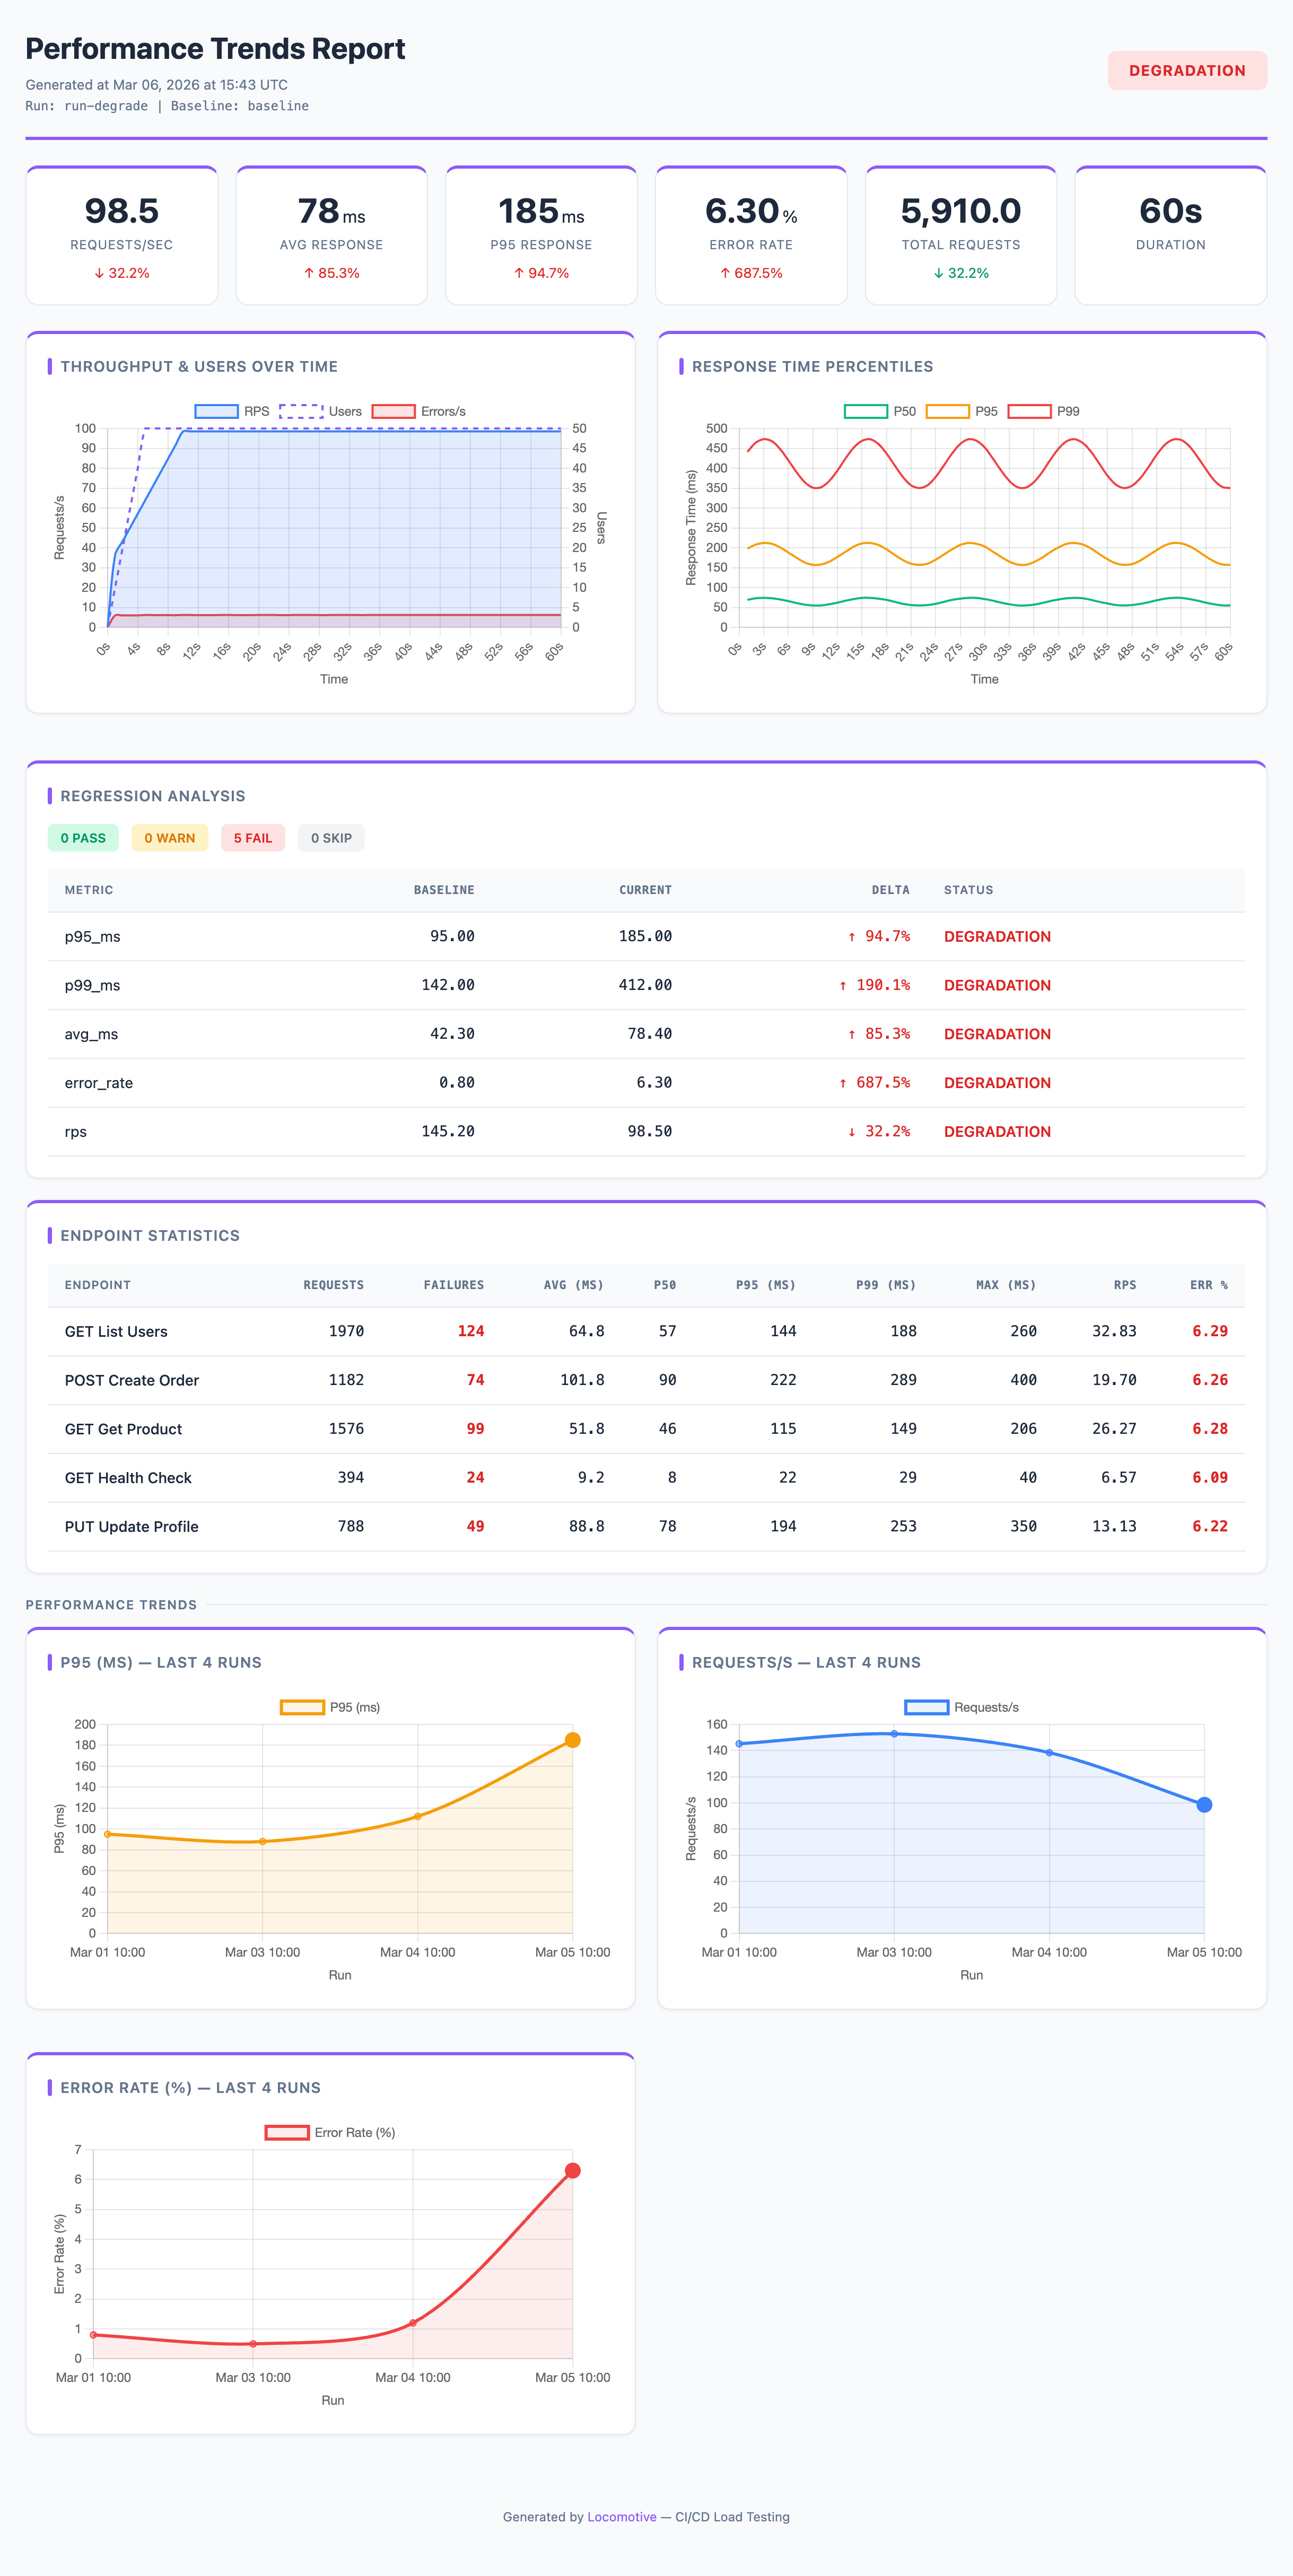
#8b5cf6
Available trend metrics: rps, avg_ms, median_ms, p95_ms, p99_ms, max_ms, error_rate, error_rate_4xx, error_rate_5xx, error_rate_503, requests, failures.
CLI Reference
loco init — create config
loco init [--openapi spec.json] [--host URL] [--github-workflow] [--output FILE] [--force]
| Flag | Description |
|---|---|
--openapi FILE |
Path to OpenAPI spec — see Generating from OpenAPI |
--host URL |
Service URL. Without it, the host declared by the spec's servers/host is used, falling back to http://localhost:8000 |
--output FILE / -o |
Output config path (default: loconfig.json) |
--github-workflow |
Also create .github/workflows/loadtest.yml |
--force / -f |
Overwrite existing files |
loco validate — check the config
loco --config loconfig.json validate
Statically checks the config without running Locust and reports every problem at once, with precise locations. Errors block (bad structure — requests/flows/on_start/on_stop that are not lists of objects, a flow without a non-empty steps list, a users entry that is not an object, a section like load or analysis that is not an object, missing path, a non-string method, invalid data mode, a pool name outside [A-Za-z0-9_], unknown auth.type, no scenario source; a data pool that cannot produce rows; a ${env:NAME} that is unset and has no default; json and data on the same request; a timeout that is not a positive number; a negative or non-numeric think_time; an analysis rule missing warn/fail; a non-integer artifacts.history; a load.timeout that is not a duration; report.theme.colors that is not an object); warnings flag likely mistakes (${var:x} that nothing captures, ${data:pool} not declared, ${data:pool.field} naming a field the pool does not have, _requires_auth with no auth block, unknown analysis metric, an unknown fail_on, a weight below 1, two requests sharing a name, a quoted timeout, think_time bounds written in the wrong order, a bare $NAME that names a set environment variable, a load.timeout shorter than run_time, a report colour the stylesheet would refuse to carry). Exit code is 1 if there are errors, 0 otherwise.
Because the checks that touch the environment and the filesystem run here, loco validate is worth running in the same shell as the run itself — the same config can be valid on your machine and invalid in CI, which is exactly the point.
Anything that stops a run is an error here, not a surprise later. Validation and generation used to disagree: a requests: written as a mapping instead of a list, a flow with no steps, an on_start written as a single object rather than a one-item list, a data pool named orders.csv — each of these passed validate cleanly and then either aborted the run or, worse, was silently dropped, so the login never happened and the whole run came back 401. Every shape the generator refuses is now refused by validate first, in the generator's own words. The same goes for the sections that are only read after Locust finishes: an analysis rule missing its warn/fail thresholds, a fail_on that is not WARNING or DEGRADATION, an artifacts.history that is not a whole number — these used to end a loco ci run after it had already spent its minutes.
A few things are warnings rather than errors because the run still produces useful numbers: a weight below 1 (it runs as 1 — to switch a request off, remove it or tag it out), and two requests in one scenario sharing a name, which makes Locust merge them into a single statistics row. Two personas using the same request name is not warned about, since keeping the row shared across personas is usually the point.
Validation also runs automatically at the start of loco run and loco ci — a broken config fails fast with a clear message instead of deep inside Locust. Pass --no-validate to skip it.
loco diff — check against a spec
loco --config loconfig.json diff --openapi openapi.json [--exit-zero]
Compares the config against an OpenAPI spec and reports drift (removed / changed / added endpoints). See Keeping the config in sync. Exit 1 on breaking drift.
loco ci — full pipeline
loco --config loconfig.json ci [--set-baseline] [--users N] [--run-time 3m] ...
Runs test → analysis → report. Accepts all flags from run, analyze, and report. Validates the config first (skip with --no-validate).
loco run — run tests only
loco --config loconfig.json run [--storage DIR] [--run-id ID] [--set-baseline] [--users N] [--run-time 3m] ...
loco analyze — run analysis only
loco --config loconfig.json analyze --storage DIR --run-id ID [--baseline <run_id>] [--fail-on DEGRADATION]
loco report — generate report only
loco --config loconfig.json report --storage DIR --run-id ID [--baseline <run_id>] [--title "Title"] [--output report.html]
Common flags
Global flags, written before the subcommand (loco --debug ci):
| Flag | Description |
|---|---|
--config |
Path to the config file (default: loconfig.json) |
--debug |
Print the full traceback when a command fails |
Flags available for all subcommands (run, analyze, report, ci):
| Flag | Description |
|---|---|
--storage |
Artifact directory |
--run-id |
Run ID |
--baseline |
Baseline run ID for comparison |
Additional run and ci flags:
| Flag | Description |
|---|---|
--host |
Override host URL |
--users |
Override user count |
--spawn-rate |
Override spawn rate |
--run-time |
Override test duration |
--tags |
Only run requests with specified tags (comma-separated) |
--exclude-tags |
Exclude requests with specified tags |
--locustfile |
Path to locustfile (instead of scenario) |
--set-baseline |
Save as baseline |
--extra-arg |
Extra Locust argument (can be specified multiple times) |
--locust-cmd |
Path to locust binary |
--no-validate |
Skip the static config validation done before running |
Distributed load — see Distributed load. --users and --spawn-rate stay totals for the whole cluster.
| Flag | Description |
|---|---|
--processes |
Number of worker processes to fork on this machine |
--master |
Run as the master of a cluster |
--worker |
Run as a worker for a master elsewhere |
--master-host |
Master address for a worker (default 127.0.0.1) |
--master-port |
Master port, if not Locust's default |
--expect-workers |
How many workers a master waits for before starting |
--no-shard-data |
Give every process the whole data pool instead of its own slice |
Additional analyze and ci flags:
| Flag | Description |
|---|---|
--rules |
Path to external analysis rules file |
--fail-on |
Exit code 1 threshold: WARNING or DEGRADATION |
Additional report and ci flags:
| Flag | Description |
|---|---|
--title |
HTML report title |
--output |
HTML report output path |
Exit codes and errors
| Code | Meaning |
|---|---|
0 |
Everything passed |
1 |
A gate or rule failed, validation found errors, or the command could not run |
130 |
Interrupted with Ctrl-C (artifacts already written are kept) |
When something goes wrong — a tab in a YAML file, a truncated JSON config, a
missing data pool, a read-only artifact directory — Locomotive prints one line
saying what is wrong and exits 1. A stack trace is the wrong answer for a
config typo: it tells the person who wrote Locomotive where the code broke, and
tells the person whose CI job just went red nothing at all.
$ loco --config loconfig.yaml validate
Error: loconfig.yaml: could not parse YAML: while scanning for the next token
found character '\t' that cannot start any token
  in "loconfig.yaml", line 2, column 1
Run with --debug (or LOCO_DEBUG=1) for the full traceback.
Pass --debug, or set LOCO_DEBUG=1 in the environment, to get the traceback
back when you are the one debugging Locomotive itself.
Using an existing locustfile
If you have an existing locustfile, you can use it instead of scenario:
{
  "load": {
    "locustfile": "tests/locustfile.py",       // path to your locustfile
    "host": "https://staging.myapp.com",
    "users": 500,
    "spawn_rate": 50,
    "run_time": "3m"
  }
}
In this case, the scenario section is not needed — Locomotive uses your locustfile and adds analysis, reports, and gate checks on top.
Artifacts
artifacts/
├── baseline.json           # current baseline run ID
├── history.json             # run history (for report trends)
└── runs/
    └── <run_id>/
        ├── run.json         # run metadata (time, config, commit)
        ├── metrics.json     # aggregated metrics
        ├── analysis.json    # analysis results (statuses, deltas)
        ├── report.html      # HTML report
        ├── generated/       # generated locustfile
        └── raw/             # raw Locust CSV files
Requirements
- Python 3.9+
- Locust 2.11+ (installed automatically; 2.11 is the floor because it is where a worker learns its own index, which distributed data pools depend on)
Contributing
Contributions are welcome — bug reports, docs, and features alike. See CONTRIBUTING.md for dev setup, how to run the tests, and what fits the project's scope. For usage questions, please use GitHub Discussions; for bugs and feature requests, the issue templates will guide you.
License
MIT — see LICENSE. By contributing you agree your contributions are licensed under the same terms (inbound = outbound).
1 maintainer

Download files
Download the file for your platform. If you're not sure which to choose, learn more about installing packages.
Source Distribution
Built Distribution
Filter files by name, interpreter, ABI, and platform.
If you're not sure about the file name format, learn more about wheel file names.
Copy a direct link to the current filters
File details
Details for the file locomotive-0.2.2.tar.gz.
File metadata
- Download URL: locomotive-0.2.2.tar.gz
- Upload date:
- Size: 230.9 kB
- Tags: Source
- Uploaded using Trusted Publishing? Yes
- Uploaded via: twine/7.0.0 CPython/3.13.14
File hashes
| Algorithm | Hash digest | |
|---|---|---|
| SHA256 |
f528ab501ec7e8c33708526fadf1d8111c547f196266358d95ce231192dfa2e8
|
|
| MD5 |
a7e9adc1efba5315e30f6dc5231026cd
|
|
| BLAKE2b-256 |
d4737f7d40123cb83a5dd84ebe5c9b378cbabdc64e9b6fd2a73b29098b7eda14
|
Provenance
The following attestation bundles were made for locomotive-0.2.2.tar.gz:
Publisher:
release.yml on locomotive-lib/locomotive
-
Statement:
-
Statement type:
https://in-toto.io/Statement/v1 -
Predicate type:
https://docs.pypi.org/attestations/publish/v1 -
Subject name:
locomotive-0.2.2.tar.gz -
Subject digest:
f528ab501ec7e8c33708526fadf1d8111c547f196266358d95ce231192dfa2e8 - Sigstore transparency entry: 2340854154
- Sigstore integration time:
-
Permalink:
locomotive-lib/locomotive@5f77df60c9154248d250bb477f0a499a29dc45a8 -
Branch / Tag:
refs/heads/master - Owner: https://github.com/locomotive-lib
-
Access:
public
-
Token Issuer:
https://token.actions.githubusercontent.com -
Runner Environment:
github-hosted -
Publication workflow:
release.yml@5f77df60c9154248d250bb477f0a499a29dc45a8 -
Trigger Event:
push
-
Statement type:
File details
Details for the file locomotive-0.2.2-py3-none-any.whl.
File metadata
- Download URL: locomotive-0.2.2-py3-none-any.whl
- Upload date:
- Size: 121.0 kB
- Tags: Python 3
- Uploaded using Trusted Publishing? Yes
- Uploaded via: twine/7.0.0 CPython/3.13.14
File hashes
| Algorithm | Hash digest | |
|---|---|---|
| SHA256 |
e939772034a08cc0cbf32ea6edb7d55ca3eedda1717c94824fe84740c8b339aa
|
|
| MD5 |
31b37b7bfb780dcca282eb4b34f96cf2
|
|
| BLAKE2b-256 |
c2ba236d61730959ca0aa7c9c28b097ccad9ec1712f2ff3e4f816518e57a9d4a
|
Provenance
The following attestation bundles were made for locomotive-0.2.2-py3-none-any.whl:
Publisher:
release.yml on locomotive-lib/locomotive
-
Statement:
-
Statement type:
https://in-toto.io/Statement/v1 -
Predicate type:
https://docs.pypi.org/attestations/publish/v1 -
Subject name:
locomotive-0.2.2-py3-none-any.whl -
Subject digest:
e939772034a08cc0cbf32ea6edb7d55ca3eedda1717c94824fe84740c8b339aa - Sigstore transparency entry: 2340854165
- Sigstore integration time:
-
Permalink:
locomotive-lib/locomotive@5f77df60c9154248d250bb477f0a499a29dc45a8 -
Branch / Tag:
refs/heads/master - Owner: https://github.com/locomotive-lib
-
Access:
public
-
Token Issuer:
https://token.actions.githubusercontent.com -
Runner Environment:
github-hosted -
Publication workflow:
release.yml@5f77df60c9154248d250bb477f0a499a29dc45a8 -
Trigger Event:
push
-
Statement type:







