Report locust metrics to influxdb.

Project description
locust_influx
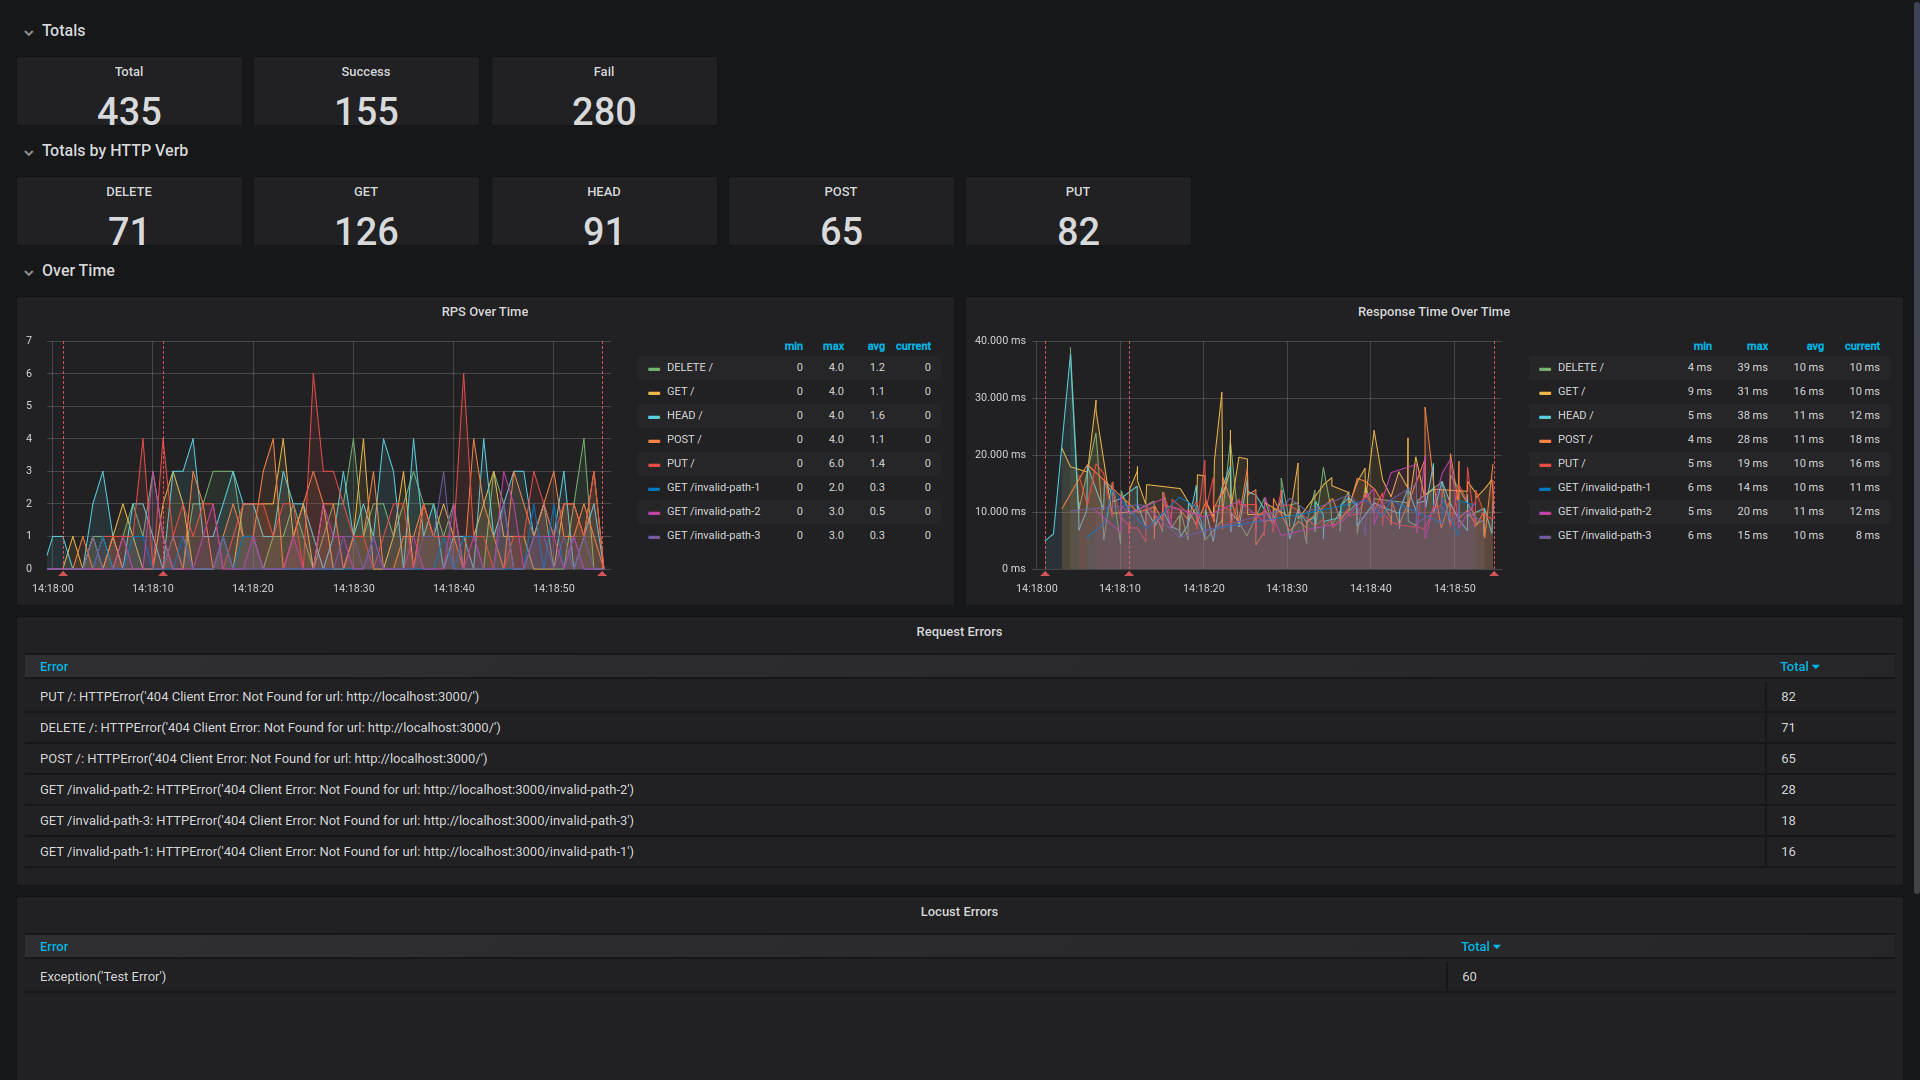
Send information about locust requests to InfluxDB and follow the progress through Grafana charts.
Test and taste it locally
Start an InfluxDB container locally:
docker run -d --name influxdb -d -p 8086:8086 influxdb
Start a Grafana container locally:
docker run -d --name grafana -d -p 3000:3000 grafana/grafana
Crete a new python virtual environment and install locust_influx:
pip install locust_influx
Run the example locustfile contained in this repo (Change the host to point to desired one):
locust -f ./locustfile.py --no-web --clients 10 --hatch-rate 1 --run-time 60s --host http://localhost:8080
Open your local Grafana in the browser at http://localhost:3000/
Import the example dashboard from locust_dashboard.json file.
Release history Release notifications | RSS feed


Download files
Download the file for your platform. If you're not sure which to choose, learn more about installing packages.
Source Distribution
Built Distribution
Filter files by name, interpreter, ABI, and platform.
If you're not sure about the file name format, learn more about wheel file names.
Copy a direct link to the current filters
File details
Details for the file locust_influx-0.2.4.tar.gz.
File metadata
- Download URL: locust_influx-0.2.4.tar.gz
- Upload date:
- Size: 3.7 kB
- Tags: Source
- Uploaded using Trusted Publishing? No
- Uploaded via: twine/3.1.1 pkginfo/1.5.0.1 requests/2.22.0 setuptools/41.6.0 requests-toolbelt/0.9.1 tqdm/4.40.2 CPython/3.7.5
File hashes
| Algorithm | Hash digest | |
|---|---|---|
| SHA256 |
fe1b33c078a47feb4898191de5b2fcaa83facaa4ad3963205c531b78e469bc54
|
|
| MD5 |
ede0aab490334afea536b9a95e0d911a
|
|
| BLAKE2b-256 |
1ae19a600243a05830e0f6e30826d7bd800ca9e31035e012d8283b884902c1ad
|
File details
Details for the file locust_influx-0.2.4-py3-none-any.whl.
File metadata
- Download URL: locust_influx-0.2.4-py3-none-any.whl
- Upload date:
- Size: 7.9 kB
- Tags: Python 3
- Uploaded using Trusted Publishing? No
- Uploaded via: twine/3.1.1 pkginfo/1.5.0.1 requests/2.22.0 setuptools/41.6.0 requests-toolbelt/0.9.1 tqdm/4.40.2 CPython/3.7.5
File hashes
| Algorithm | Hash digest | |
|---|---|---|
| SHA256 |
015051a5adc82e7023019cdae49653034fe20440f5a80bccfcd587985c6e0015
|
|
| MD5 |
c113e9f35a010a9930e8973485fcb829
|
|
| BLAKE2b-256 |
cbf3371035f67449cac2a970c77694355829f210ed4cbb68f316413745ca6d5b
|


