

LoopSentry
Asyncio Event Loop Blocker Detector & Analyzer
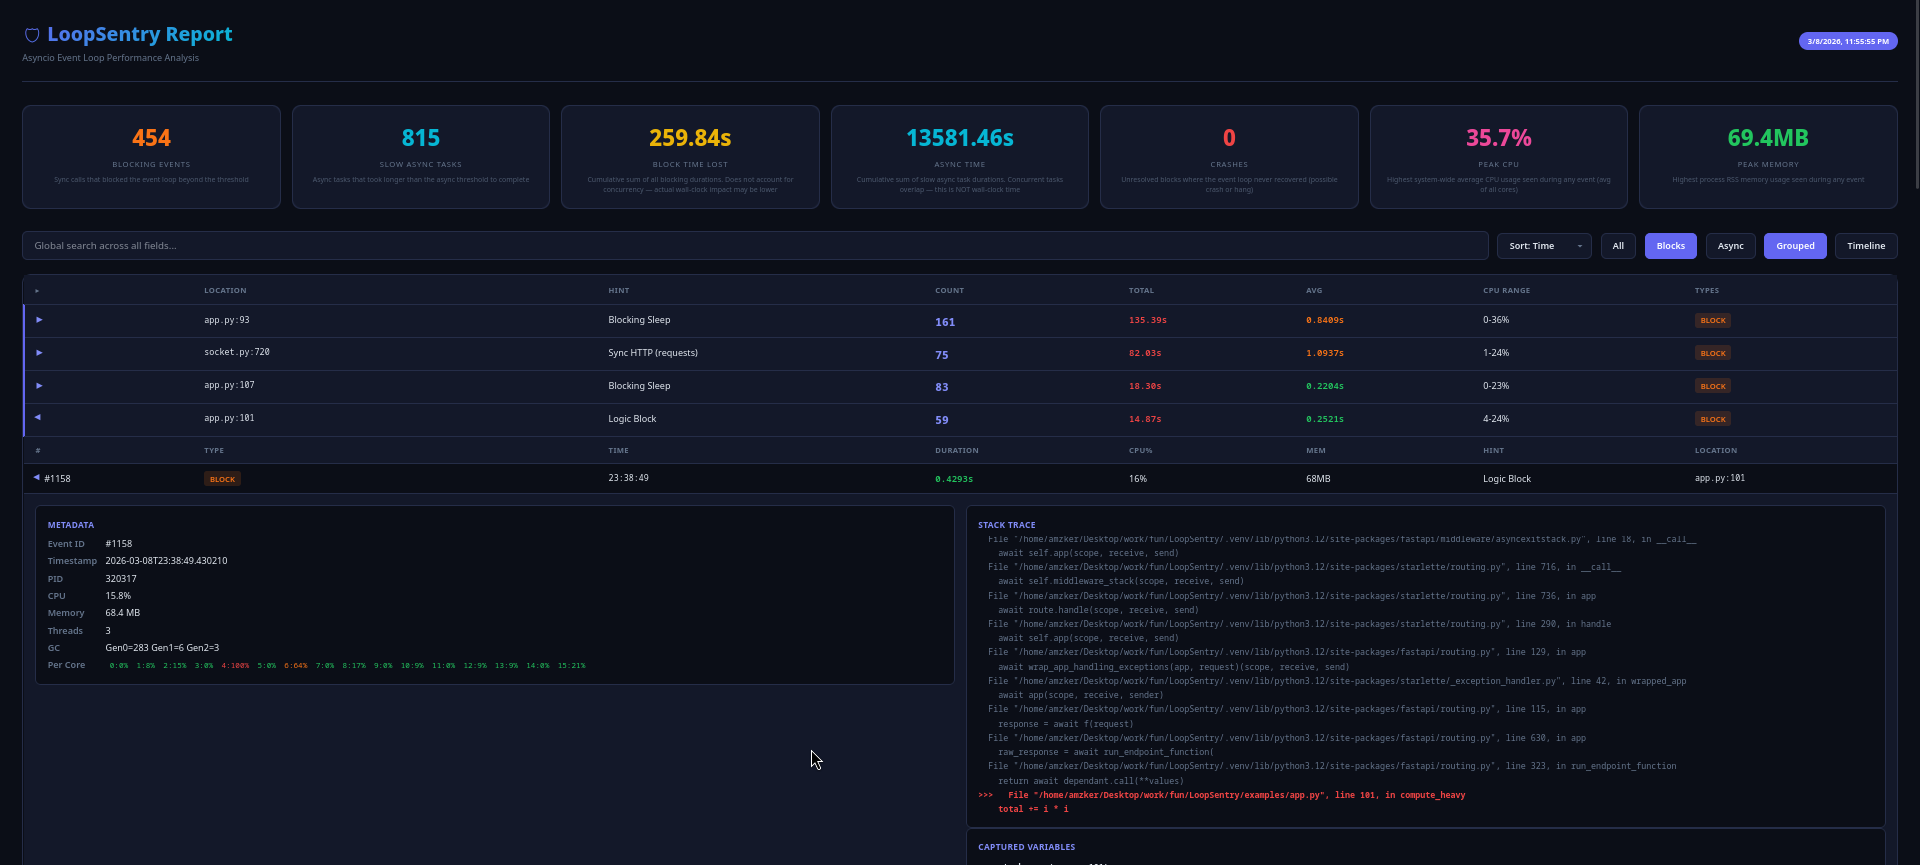
Detect blocking calls, slow async tasks, and performance bottlenecks in your asyncio applications. Captures stack traces, function arguments, CPU/memory/GC metrics. Generates standalone HTML reports and CSV exports.
HTML Report
Installation
pip install loopsentry
OR
uv add loopsentry
Quick Start
import asyncio
from loopsentry import LoopSentry

async def main():
    sentry = LoopSentry(threshold=0.1)
    sentry.start()
    # ... your application
    sentry.stop()

asyncio.run(main())
Configuration
sentry = LoopSentry(
    base_dir="sentry_logs",          # log output directory
    threshold=0.1,                   # blocking detection threshold (seconds)
    async_threshold=1.0,             # slow async task threshold (seconds)
    capture_args=True,               # capture function arguments at block time
    detect_async_bottlenecks=True,   # track slow async tasks
)
| Parameter | Default | Description |
|---|---|---|
base_dir |
"sentry_logs" |
Directory for log output |
threshold |
0.1 |
Seconds before a blocking call is flagged |
async_threshold |
Same as threshold |
Separate threshold for slow async tasks |
capture_args |
False |
Capture local variables from stack frames |
detect_async_bottlenecks |
False |
Monitor async task completion times |
FastAPI / Uvicorn
from contextlib import asynccontextmanager
from fastapi import FastAPI
from loopsentry import LoopSentry

@asynccontextmanager
async def lifespan(app: FastAPI):
    sentry = LoopSentry(
        threshold=0.1,
        async_threshold=2.0,
        capture_args=True,
        detect_async_bottlenecks=True,
    )
    sentry.start()
    yield
    sentry.stop()

app = FastAPI(lifespan=lifespan)
What It Detects
| Pattern | Type | Example |
|---|---|---|
| Blocking sleep | Block | time.sleep() in async context |
| Sync HTTP | Block | requests.get() instead of aiohttp/httpx |
| Sync DB calls | Block | PyMongo, sqlite3 sync operations |
| Subprocess | Block | subprocess.run() |
| CPU loops | Block | Tight loops without yielding |
| Slow coroutines | Async | Tasks exceeding async_threshold |
| Crashes | Crash | Process killed during a block |
CLI
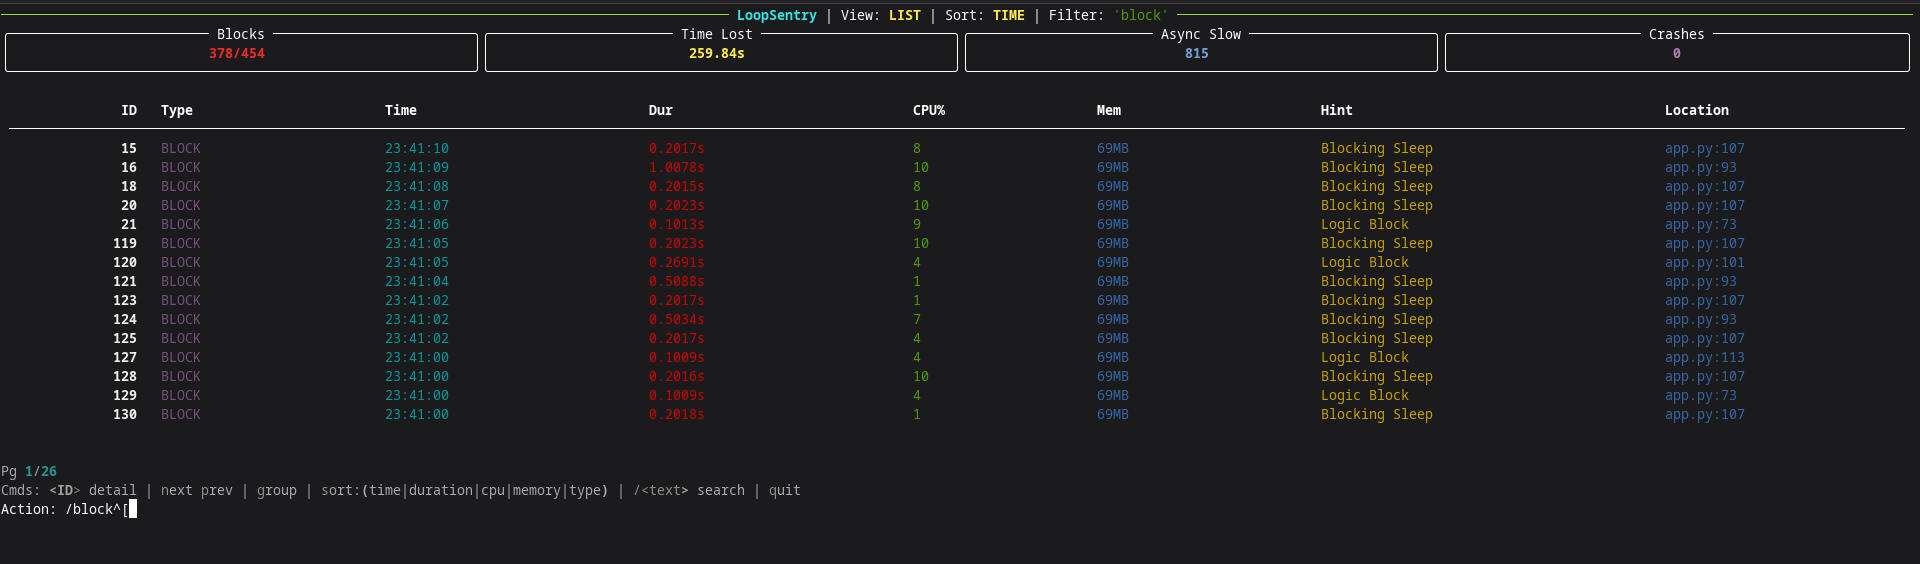
Interactive TUI
loopsentry analyze                          # auto-select latest logs
loopsentry analyze -d sentry_logs/          # specific directory
| Key | Action |
|---|---|
<ID> |
View event detail (stack trace, args, metrics) |
n / p |
Next / Previous page |
g |
Toggle group view (top offenders) |
s |
Cycle sort: time → duration → cpu → memory → type |
s:cpu |
Sort by specific column |
/text |
Search/filter events |
q |
Quit |
Culprit Summary
loopsentry analyze -d sentry_logs/ --summary
Prints a high-density summary of unique culprits/offenders. useful when you just want to see blocks and not full timeline.
Export the unique culprits directly to a CSV file by combining it with the --csv flag:
loopsentry analyze -d sentry_logs/ --summary --csv
loopsentry analyze -d sentry_logs/ --summary --csv -o summary.csv
HTML Report
loopsentry analyze -d sentry_logs/ --html
loopsentry analyze -d sentry_logs/ --html -o report.html
Generates a standalone HTML file — no dependencies, no internet required. Open directly in any browser.
CSV Export
loopsentry analyze -d sentry_logs/ --csv
loopsentry analyze -d sentry_logs/ --csv -o data.csv
Full CLI Reference
loopsentry --version                   # Show version
loopsentry analyze [OPTIONS]

  -d, --dir DIR          Directory to scan
  -f, --file FILE        Specific .jsonl file to scan
  --html                 Generate standalone HTML report
  --csv                  Generate CSV report
  --summary              Print a summary of unique culprit offenders , useful when you just want to see blocks and not full timeline.
  --sort COLUMN          Sort by: time | duration | cpu | memory | type
  -o, --output PATH      Output file path for HTML/CSV
Example
The examples/ directory contains a complete FastAPI application that deliberately triggers every type of blocking pattern LoopSentry detects.
Run the demo:
cd examples/

# Terminal 1 — start the server
uv run app.py

# Terminal 2 — fire test requests
uv run mock_server.py

# Terminal 3 — fire test requests
uv run loadtest.py -d 120 -o example_logs/loadtest

# Terminal 1 — stop server (Ctrl+C), then generate report
loopsentry analyze -d example_logs/ --html
Endpoints in the demo app:
| Endpoint | What it does |
|---|---|
GET /healthy |
Clean async endpoint (no block) |
GET /users/sync |
Sync SQLite query blocking the loop |
POST /hash |
CPU-bound PBKDF2 hashing |
GET /external |
Async HTTP via aiohttp (clean) |
GET /external/sync |
Sync HTTP via requests (blocks loop) |
GET /sleep/{seconds} |
time.sleep() blocking the loop |
GET /compute |
CPU-bound loop (5M iterations) |
GET /mixed |
Sleep + DB + hashing in one request |
How to Interpret the result
blocks smaller than 0.5 sec during high load / stress testing should be ignored. grouped view is just so you can find offender quickly , but in order for you to understand overall health of app , you should switch to timeline mode and see block durations across all events , to get better idea. during heavy load smaller non attention required tasks will also start blocking the event loop , unless those blocks are not associated with massvie cpu usage then you should focus on them later and should focus on blocks where avg block is greater than 0.6-7 seconds. in group view you do not need read each and every separate event , you can just read 1st one and get the idea of blocks.
you also need to take concurrency as variable to mind , check out report_async.html and report.html to understand how to interpret both blocks , also look at their loadtest.html files loadtest_async.html and loadtest.html
async app has proccessed ~11k requests in 2 min , while sync app has around 1k requests in 2min. if you notice in async app there is no block , all of the blocks are from loopsentry itself and that is expected , loopsentry will also have its own blockings given stack frames capture as well as , per core cpu usage etc... processes happens. which is fine given the value it can provide.
License
MIT
1 maintainer

Release files for loopsentry 1.2.0
For a detailed explanation of source distributions (sdists) and built distributions (wheels), please see the package formats documentation.
Source distribution (sdist)
| File | Size | Uploaded | |
|---|---|---|---|
| loopsentry-1.2.0.tar.gz | 3.0 MB | Details |
Built distribution (wheel)
| File | Interpreter | ABI | Platform | Reset |
|---|---|---|---|---|
| loopsentry-1.2.0-py3-none-any.whl | Python 3 | none | any | Details |
Total release size: 3.1 MB
Release files / loopsentry-1.2.0.tar.gz
| Download URL | loopsentry-1.2.0.tar.gz |
|---|---|
| Size | 3.0 MB |
| Tags | Source |
|
SHA-256 checksum How to use checksums |
6c4579a47623acb0b82c938320cf2a35cc379cb237c71bdef8788f384776d6f5
|
|
BLAKE2b-256 checksum How to use checksums |
3155015d611c7605842cb9c619d143a5c7c991a7f0fc39cf25ddfc48ef5a7788
|
| Upload date | |
|
Uploaded using Trusted Publishing? What is trusted publishing? |
No |
| Uploaded via |
uv/0.10.0 {"installer":{"name":"uv","version":"0.10.0","subcommand":["publish"]},"python":null,"implementation":{"name":null,"version":null},"distro":{"name":"Fedora Linux","version":"43","id":"","libc":null},"system":{"name":null,"release":null},"cpu":null,"openssl_version":null,"setuptools_version":null,"rustc_version":null,"ci":null}
|
Release files / loopsentry-1.2.0-py3-none-any.whl
| Download URL | loopsentry-1.2.0-py3-none-any.whl |
|---|---|
| Size | 34.9 kB |
| Tags | Python 3 |
|
SHA-256 checksum How to use checksums |
2a2740581e96c3de61199528f4605b09350e9c512169cf7cee984f46af476210
|
|
BLAKE2b-256 checksum How to use checksums |
4b650efe37a85839d86428606977c2722a3156c7c79bea943d4c8e45f54ee359
|
| Upload date | |
|
Uploaded using Trusted Publishing? What is trusted publishing? |
No |
| Uploaded via |
uv/0.10.0 {"installer":{"name":"uv","version":"0.10.0","subcommand":["publish"]},"python":null,"implementation":{"name":null,"version":null},"distro":{"name":"Fedora Linux","version":"43","id":"","libc":null},"system":{"name":null,"release":null},"cpu":null,"openssl_version":null,"setuptools_version":null,"rustc_version":null,"ci":null}
|














