Label lines in matplotlib.

Project description
matplotlib-label-lines


Easily label line(s) using matplotlib.
The code is heavily based on http://stackoverflow.com/questions/16992038/inline-labels-in-matplotlib (original code from NauticalMile).
Install
Just do:
pip install matplotlib-label-lines
You can try it online on binder 
import numpy as np
from matplotlib import pyplot as plt
from scipy.stats import loglaplace,chi2
from labellines import labelLine, labelLines
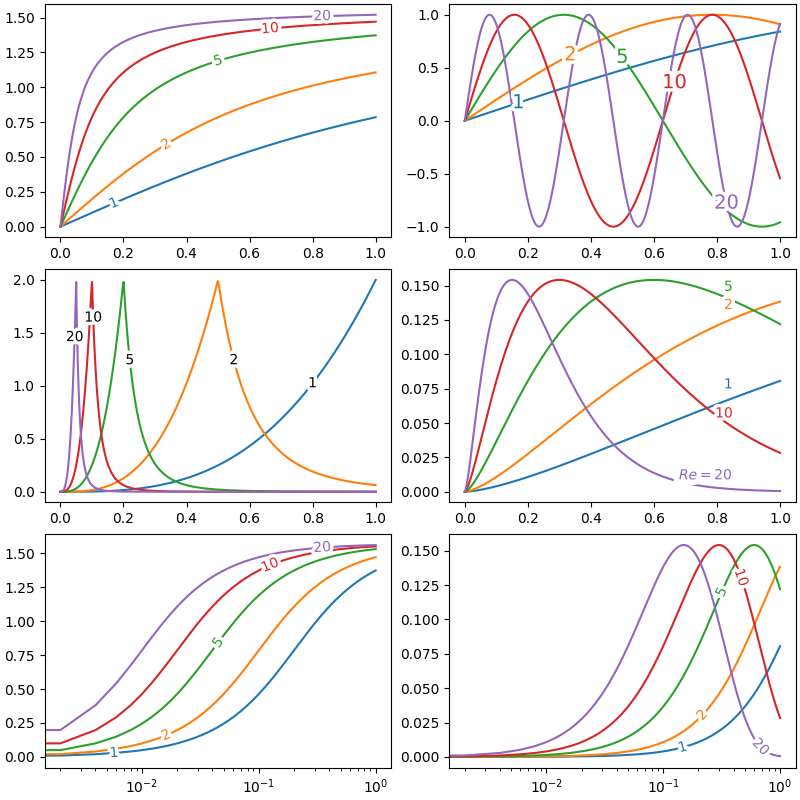
X = np.linspace(0,1,500)
A = [1,2,5,10,20]
funcs = [np.arctan,np.sin,loglaplace(4).pdf,chi2(5).pdf]
plt.subplot(321)
for a in A:
plt.plot(X,np.arctan(a*X),label=str(a))
labelLines(plt.gca().get_lines(),zorder=2.5)
plt.subplot(322)
for a in A:
plt.plot(X,np.sin(a*X),label=str(a))
labelLines(plt.gca().get_lines(),align=False,fontsize=14)
plt.subplot(323)
for a in A:
plt.plot(X,loglaplace(4).pdf(a*X),label=str(a))
xvals = [0.8,0.55,0.22,0.104,0.045]
labelLines(plt.gca().get_lines(),align=False,xvals=xvals,color='k')
plt.subplot(324)
for a in A:
plt.plot(X,chi2(5).pdf(a*X),label=str(a))
lines = plt.gca().get_lines()
l1=lines[-1]
labelLine(l1,0.6,label=r'$Re=${}'.format(l1.get_label()),ha='left',va='bottom',align = False)
labelLines(lines[:-1],align=False)
# labelLines also supports log-scaled x-axes
plt.subplot(325)
for a in A:
plt.semilogx(X,np.arctan(5*a*X),label=str(a))
labelLines(plt.gca().get_lines(),zorder=2.5)
plt.subplot(326)
for a in A:
plt.semilogx(X,chi2(5).pdf(a*X),label=str(a))
labelLines(plt.gca().get_lines(), xvals=(0.1, 1), zorder=2.5)
plt.show()
Release history Release notifications | RSS feed


Download files
Download the file for your platform. If you're not sure which to choose, learn more about installing packages.
Source Distribution
Built Distribution
Filter files by name, interpreter, ABI, and platform.
If you're not sure about the file name format, learn more about wheel file names.
Copy a direct link to the current filters
File details
Details for the file matplotlib-label-lines-0.3.7.tar.gz.
File metadata
- Download URL: matplotlib-label-lines-0.3.7.tar.gz
- Upload date:
- Size: 5.8 kB
- Tags: Source
- Uploaded using Trusted Publishing? No
- Uploaded via: twine/3.1.1 pkginfo/1.5.0.1 requests/2.22.0 setuptools/45.2.0 requests-toolbelt/0.9.1 tqdm/4.43.0 CPython/3.8.1
File hashes
| Algorithm | Hash digest | |
|---|---|---|
| SHA256 |
7302102bd2b9f5171b0a69ae1d2ba5d02a0f55375c9d0bc86e8ba35ba4764e85
|
|
| MD5 |
1a2bf6283fb4c4b4a7415cb2ddcdc230
|
|
| BLAKE2b-256 |
56c1b0722dcc6fe77a8b6809e3f0583a1cc58772b25cae414817e5d0bd34e8bd
|
File details
Details for the file matplotlib_label_lines-0.3.7-py3-none-any.whl.
File metadata
- Download URL: matplotlib_label_lines-0.3.7-py3-none-any.whl
- Upload date:
- Size: 6.2 kB
- Tags: Python 3
- Uploaded using Trusted Publishing? No
- Uploaded via: twine/3.1.1 pkginfo/1.5.0.1 requests/2.22.0 setuptools/45.2.0 requests-toolbelt/0.9.1 tqdm/4.43.0 CPython/3.8.1
File hashes
| Algorithm | Hash digest | |
|---|---|---|
| SHA256 |
3d06b9c9c70e2a96af4ab0acd5c8d7c86b3f3cd808637f16b3c8c4fd7019fb30
|
|
| MD5 |
fa2fca926d3d7ca4aad720a5c76bb1d1
|
|
| BLAKE2b-256 |
f5a233d84d9ca7f0b52be32077dd090535a304bc3e89d0fc6c6e56f4eb64c452
|


