
pltx - Enhanced Matplotlib for Scientific Visualization
A matplotlib wrapper with publication-quality styling and colorblind accessibility features.


I got bored to always create some custom formatting for my plots, run into reviewers asking for improving readability. I want just to import and use it with minor modifications. Here I made something one can install and have pretty looking plots ready to go (just some personal styling on top of matplotlib).
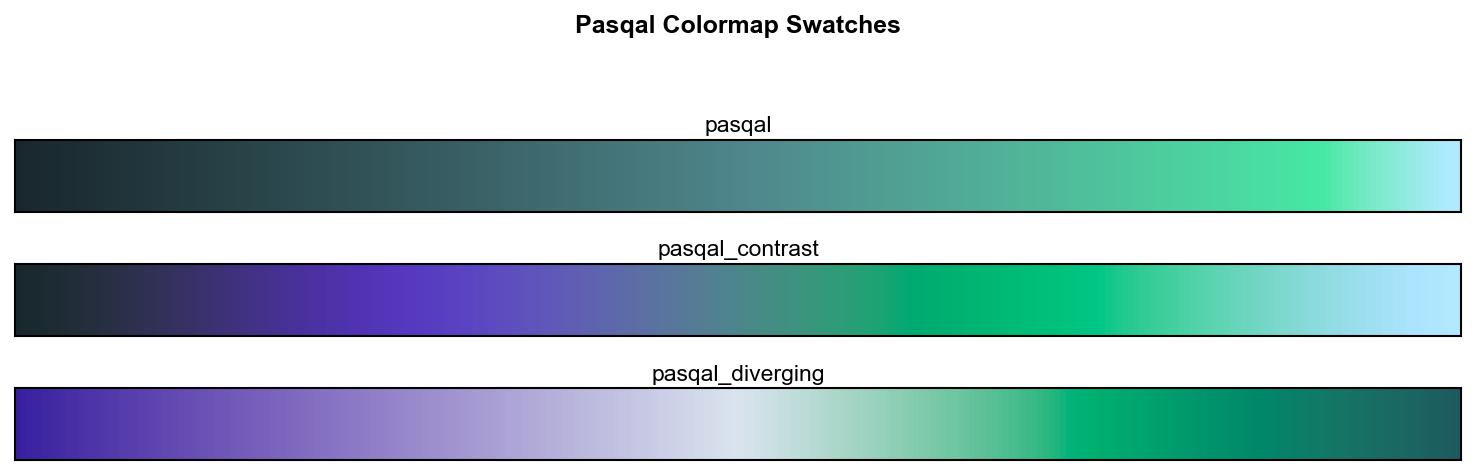
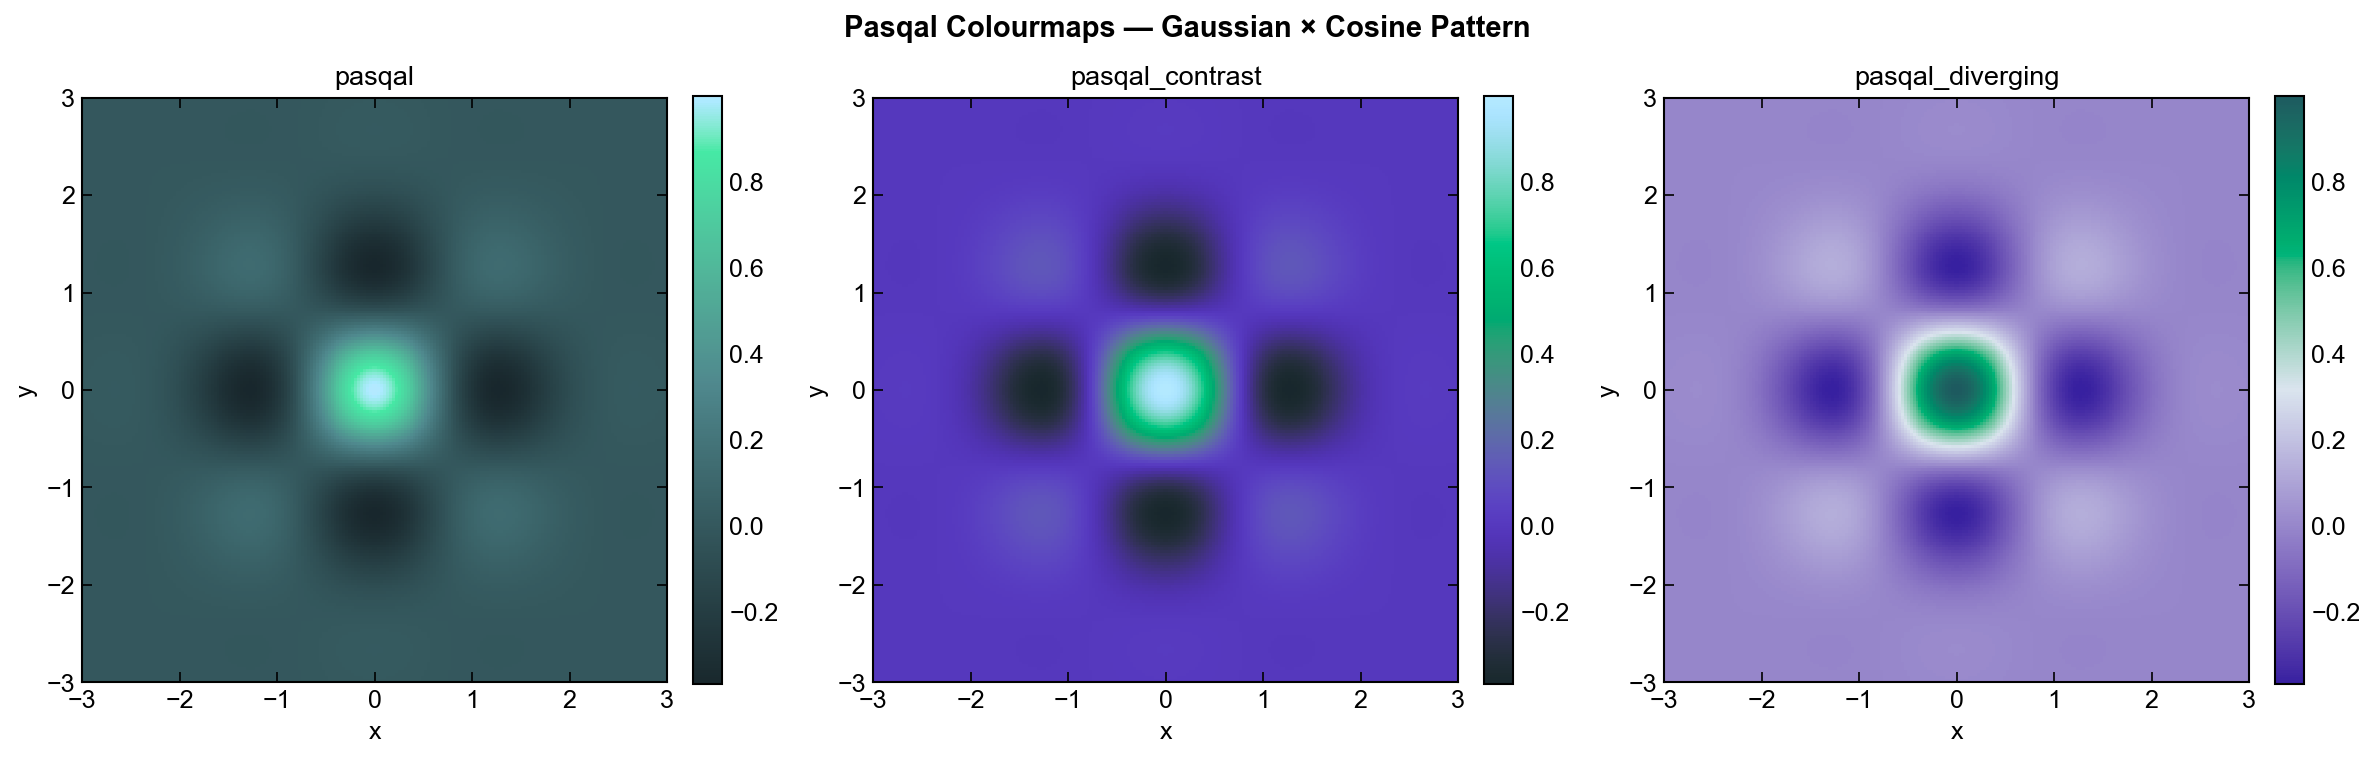
Credits to Mathieu Garrigues for Pasqal colormaps (pasqal, pasqal_contrast, pasqal_diverging).
Key Features
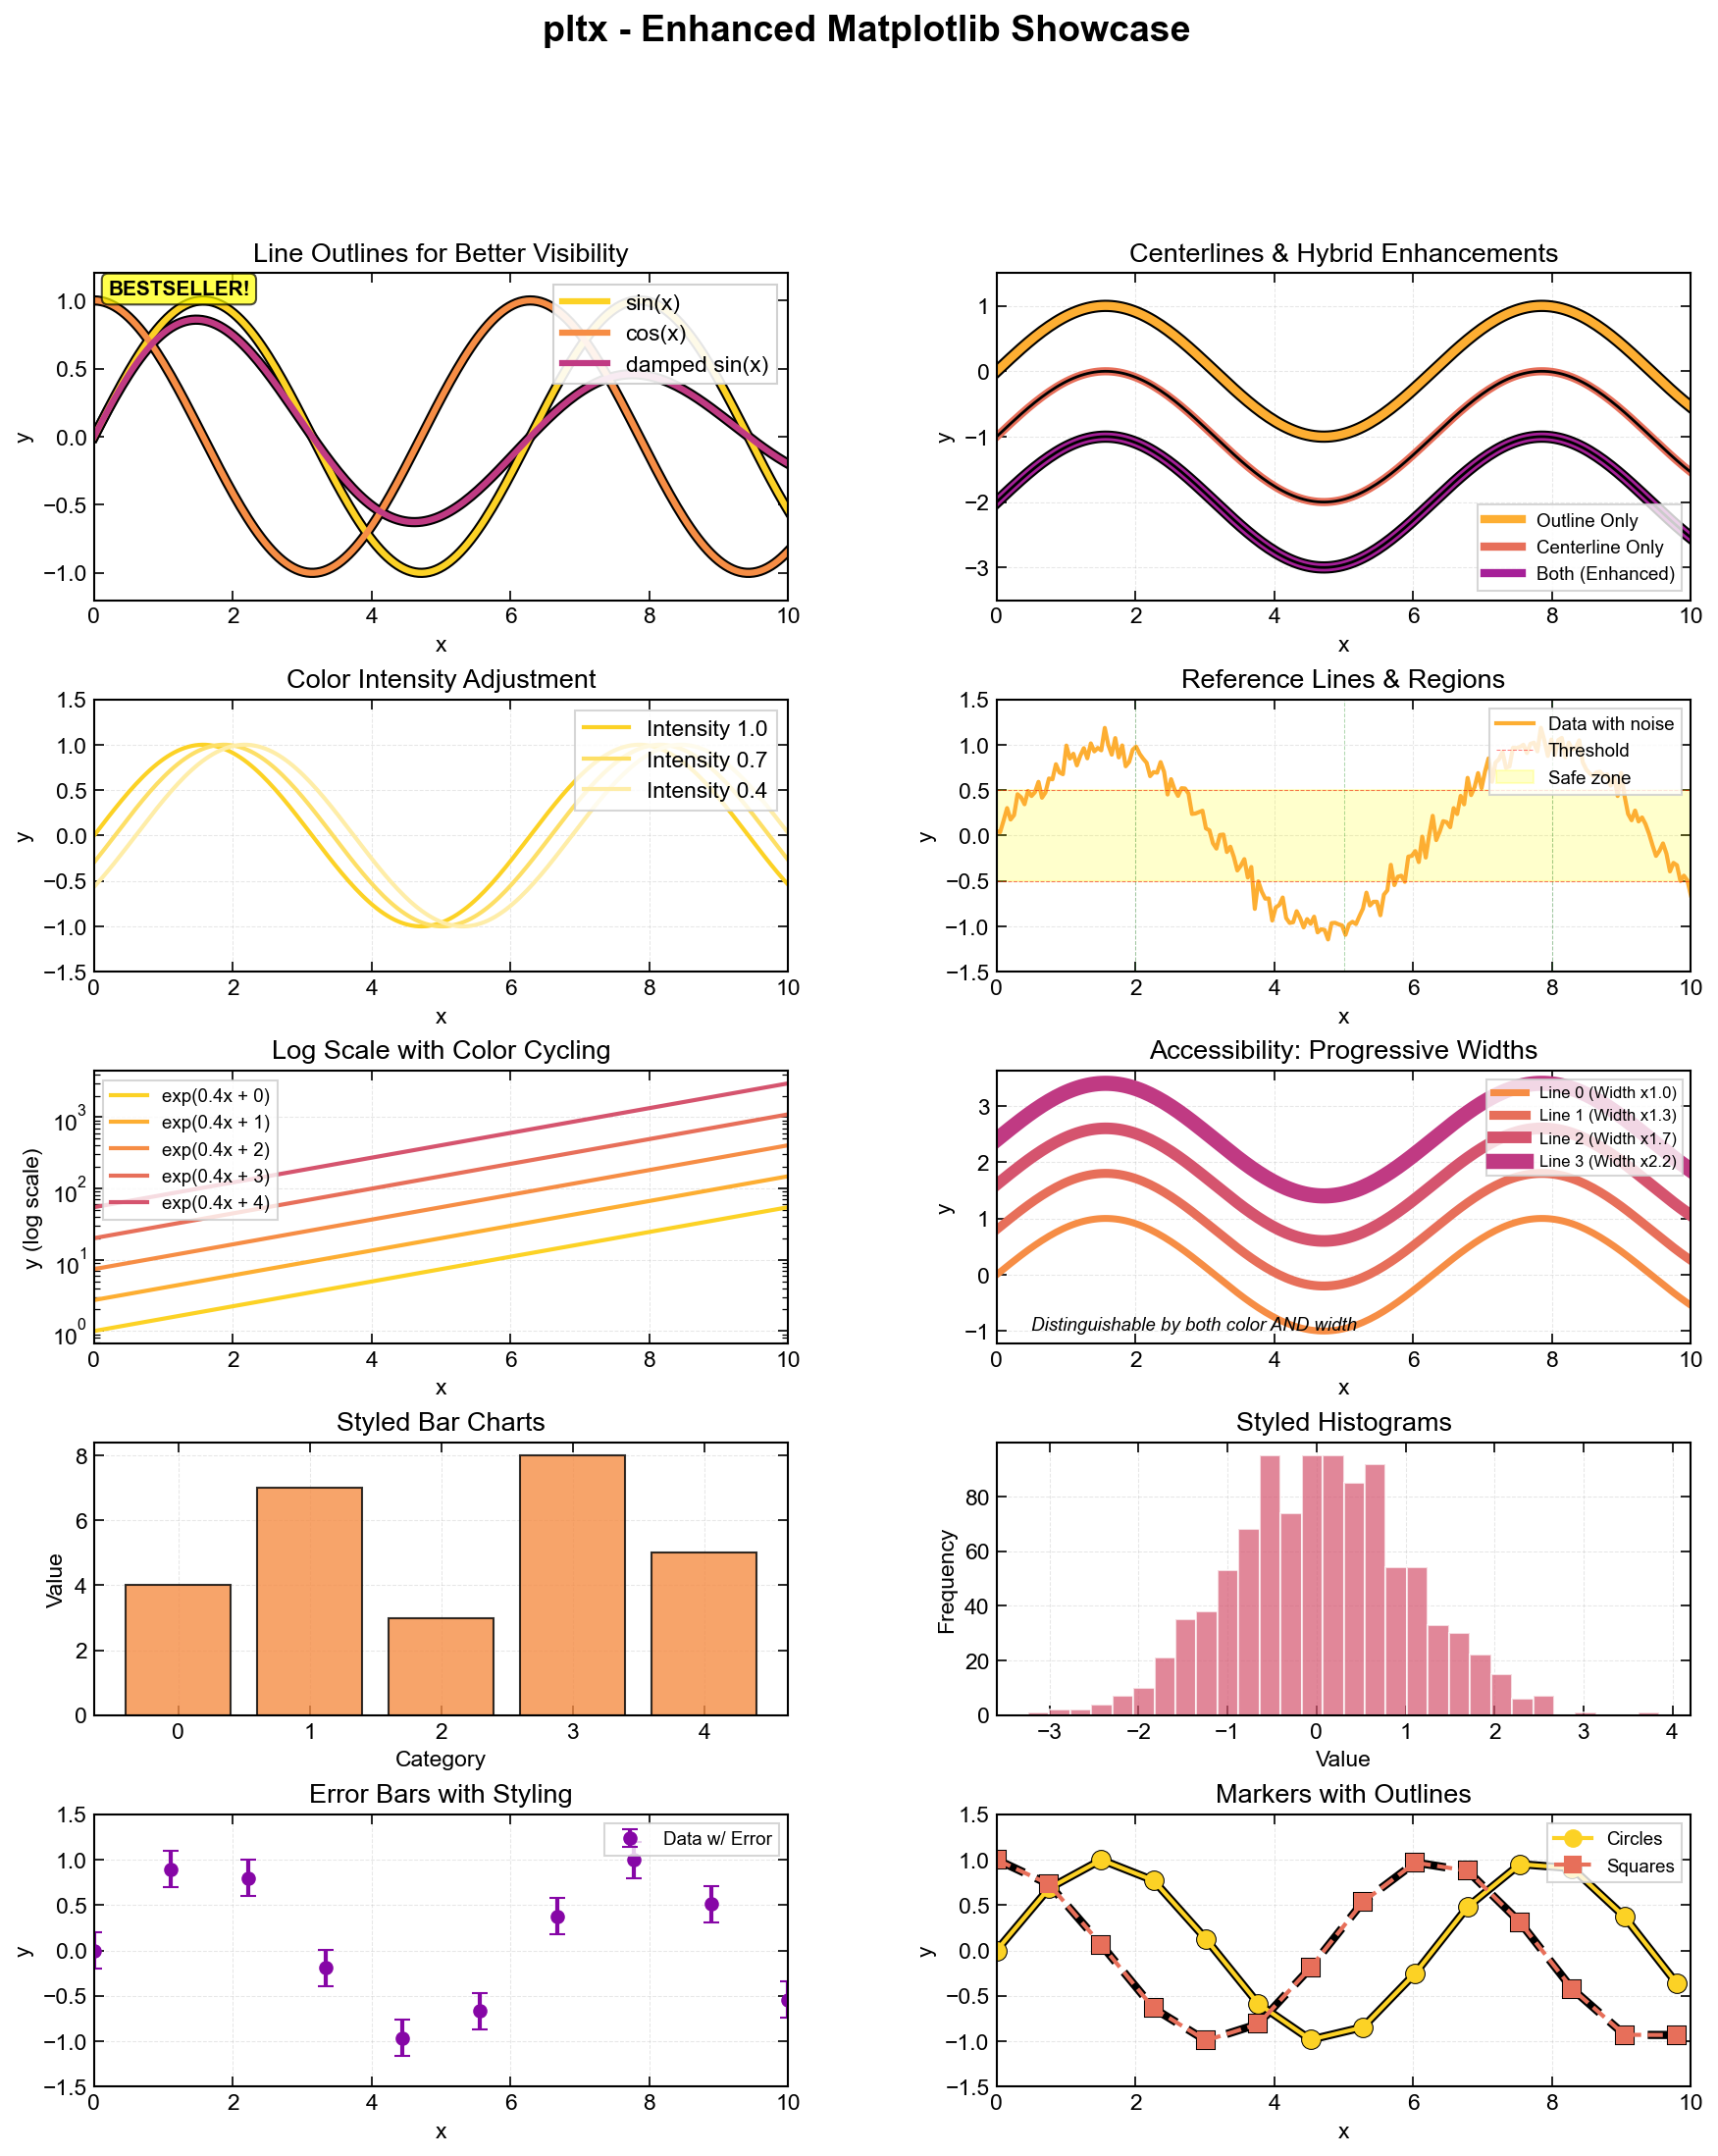
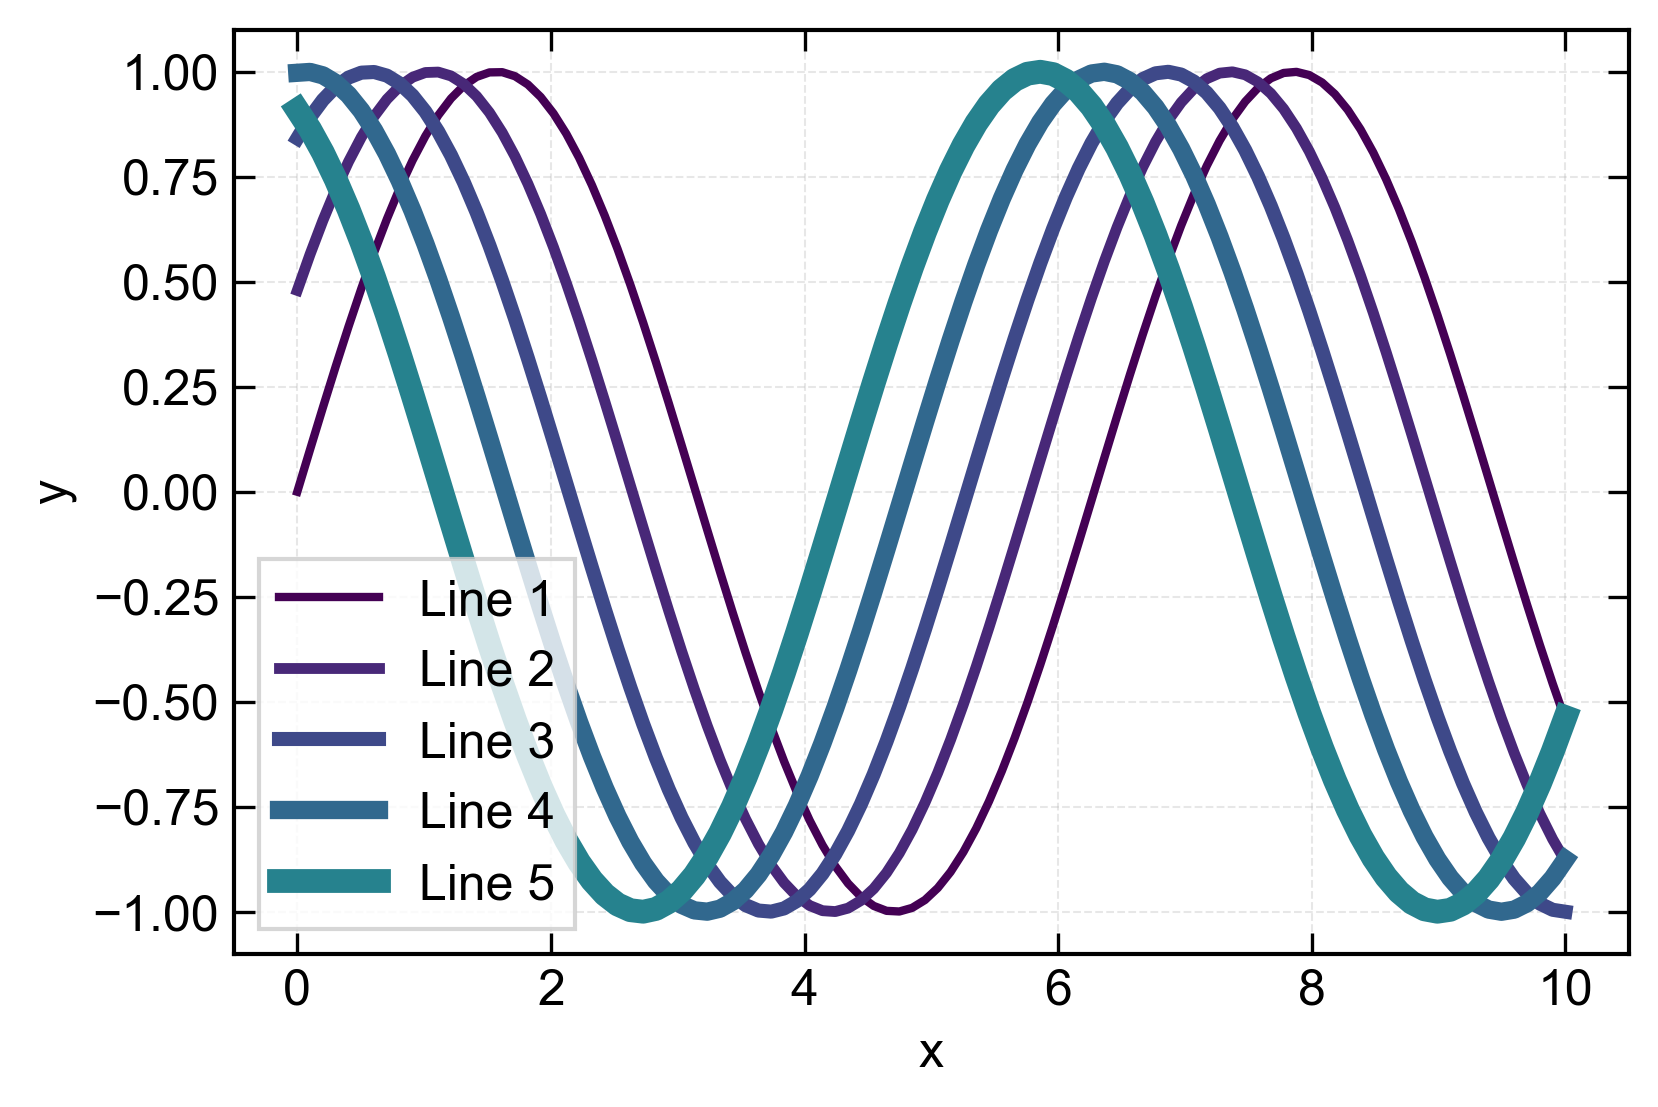
- Colorblind Accessible - Progressive line width variation distinguishes lines by thickness AND color
- Journal-Ready Presets - Nature, LaTeX, presentation, and poster styles in one function call
- Line Visibility - Optional outlines and centerlines for better contrast
- Drop-in Replacement - Works with all matplotlib plot types
- Auto Color Cycling - Intelligent palette management with intensity control
Example Gallery
Quick Start
For a new user, the fastest path is:
import pltx.pyplot as plt
plt.initialize_style()
Then use plt.plot_styled(...) (or regular matplotlib calls) and your figures get consistent defaults immediately.
import pltx.pyplot as plt
import numpy as np

# Enable colorblind-friendly progressive widths
plt.initialize_style(
    palette_name='pasqal',
    vary_linewidth=True,              # Lines get progressively thicker
    linewidth_progression_factor=1.3  # 30% increase per line
)

# Plot with automatic styling
x = np.linspace(0, 10, 100)
for i in range(5):
    plt.plot_styled(x, np.sin(x + i*0.5),
                   color_idx=i,
                   centerline=True,  # Add thin line on top
                   label=f'Line {i+1}')

plt.setup_axis(xlabel='x', ylabel='y', grid=True)
plt.legend()
plt.savefig('plot.png', dpi=300)
Pasqal Colormaps
Three custom Pasqal colormaps are auto-registered on import — no setup needed:
pasqal— main brand colourmap (dark teal to bright green)pasqal_contrast— higher-contrast variant (purple to cyan)pasqal_diverging— diverging colourmap (blue-purple through white to teal-green)
# Use as palette for line plots
plt.initialize_style(palette_name='pasqal')

# Or use directly with any matplotlib function
ax.imshow(data, cmap='pasqal_diverging')
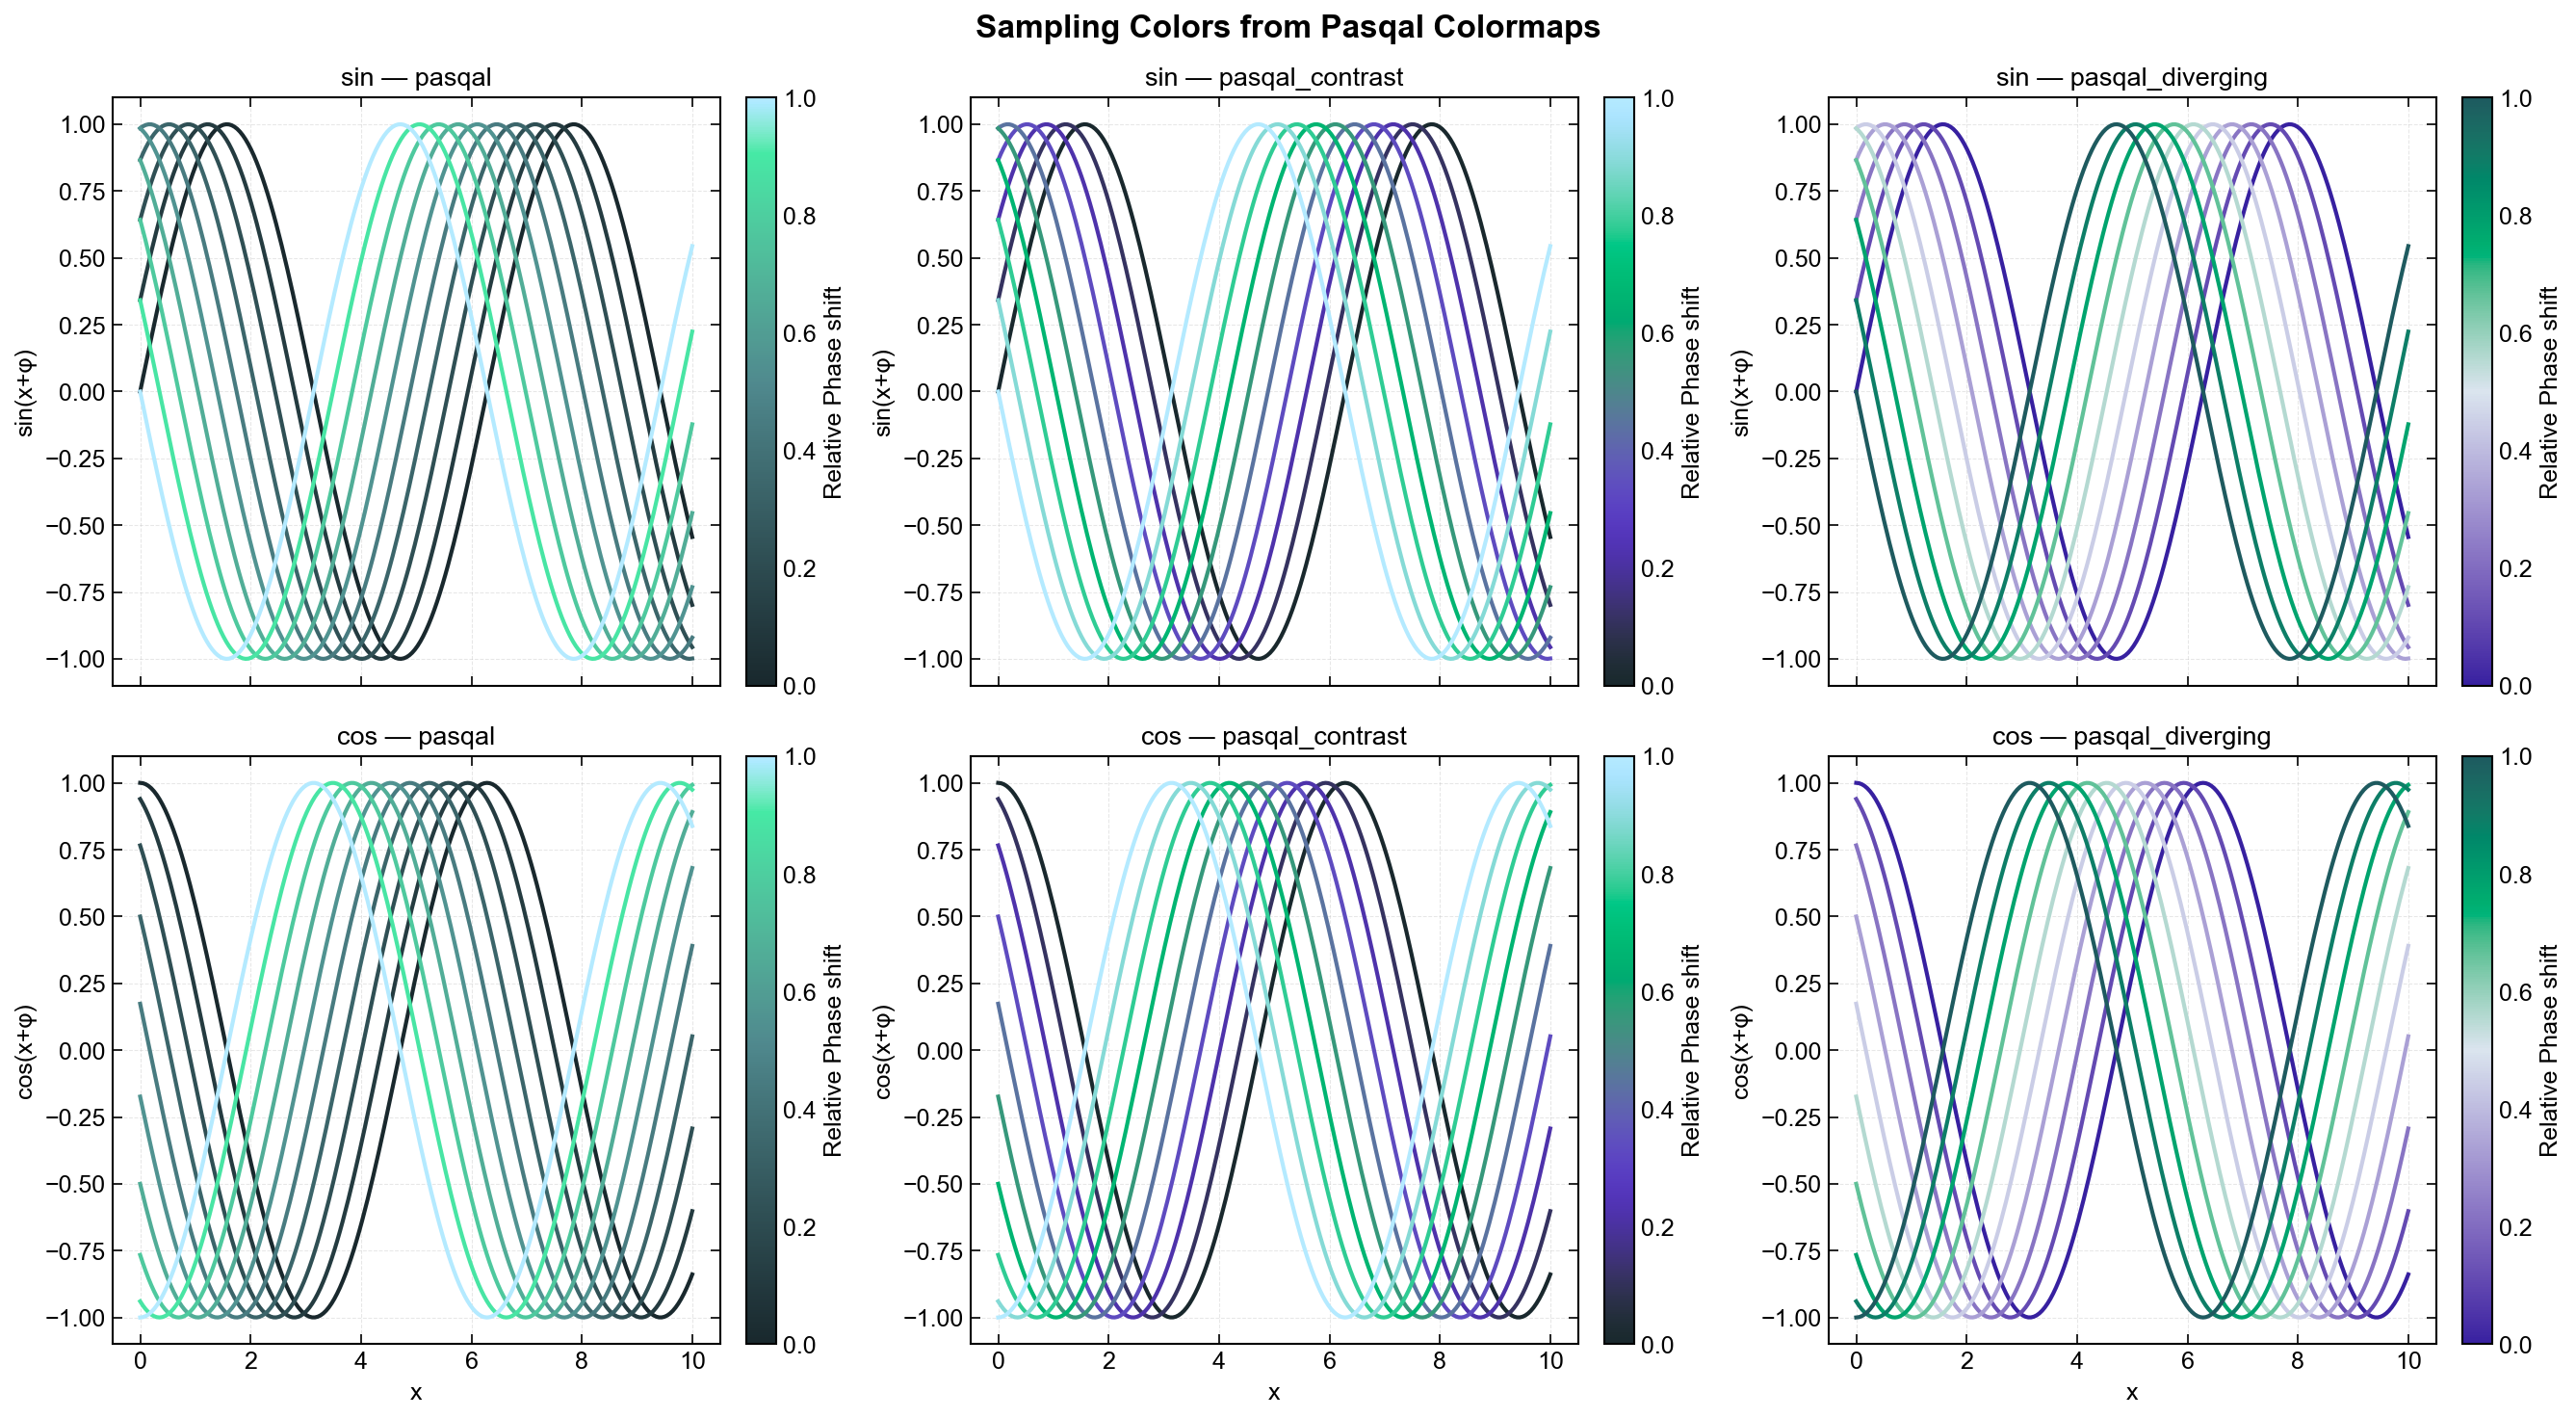
Regenerate these images with python examples/generate_readme_images.py.
Installation
pip install matplotlibx

# With optional seaborn support for extended palettes
pip install matplotlibx[all]
Key Features in Detail
1. Progressive Line Width (Colorblind Accessible)
Each line automatically gets thicker - distinguishable by both color and width:
plt.initialize_style(
    vary_linewidth=True,
    base_linewidth=2.0,
    linewidth_progression_factor=1.3  # 1.2=gentle, 1.3=moderate, 1.5=strong
)
Result: Line 0: 2.0pt -> Line 1: 2.6pt -> Line 2: 3.4pt -> Line 3: 4.4pt
2. Line Enhancements
# Outline (thick line behind)
plt.plot_styled(x, y, color_idx=0, outline=True)

# Centerline (thin line on top)
plt.plot_styled(x, y, color_idx=0, centerline=True)

# Both (maximum contrast)
plt.plot_styled(x, y, color_idx=0, outline=True, centerline=True)
3. Journal Presets
from pltx.rcparams import apply_style_preset

apply_style_preset('nature')        # Nature journal (Arial, 7-9pt, 3.5")
apply_style_preset('latex')         # LaTeX documents (Computer Modern, 10pt, usetex)
apply_style_preset('presentation')  # Slides (16-18pt, thick lines)
apply_style_preset('poster')        # Posters (24-28pt)
4. Works with All Plot Types
from pltx.colors import get_color

# Bar plots
colors = [get_color(i) for i in range(5)]
plt.bar(categories, values, color=colors)

# Scatter plots
plt.plot_styled(x, y, marker='o', linestyle='', color_idx=0)

# All matplotlib functions available!
Real-World Examples
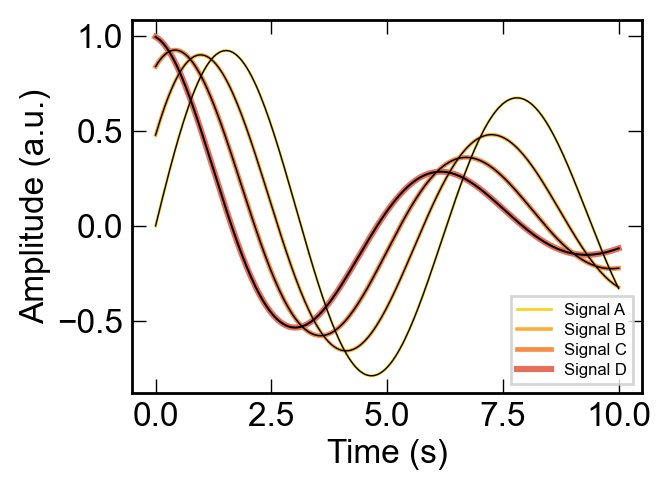
Nature Journal Submission
from pltx.rcparams import apply_style_preset
import pltx.pyplot as plt

# Apply Nature style + accessibility
apply_style_preset('nature')
plt.initialize_style(
    vary_linewidth=True,
    base_linewidth=1.0,
    linewidth_progression_factor=1.3
)

# Single column figure
fig, ax = plt.subplots(figsize=(3.5, 2.6))

for i in range(4):
    plt.plot_styled(x, data[i],
                   color_idx=i,
                   centerline=True,  # Better in print
                   label=labels[i])

plt.setup_axis(xlabel='Time (s)', ylabel='Amplitude (a.u.)')
plt.legend()
plt.savefig('figure1.pdf', dpi=300)
LaTeX Document Figure
from pltx.rcparams import apply_style_preset
import pltx.pyplot as plt
import numpy as np

# Computer Modern fonts, usetex=True, amsmath loaded
apply_style_preset('latex')

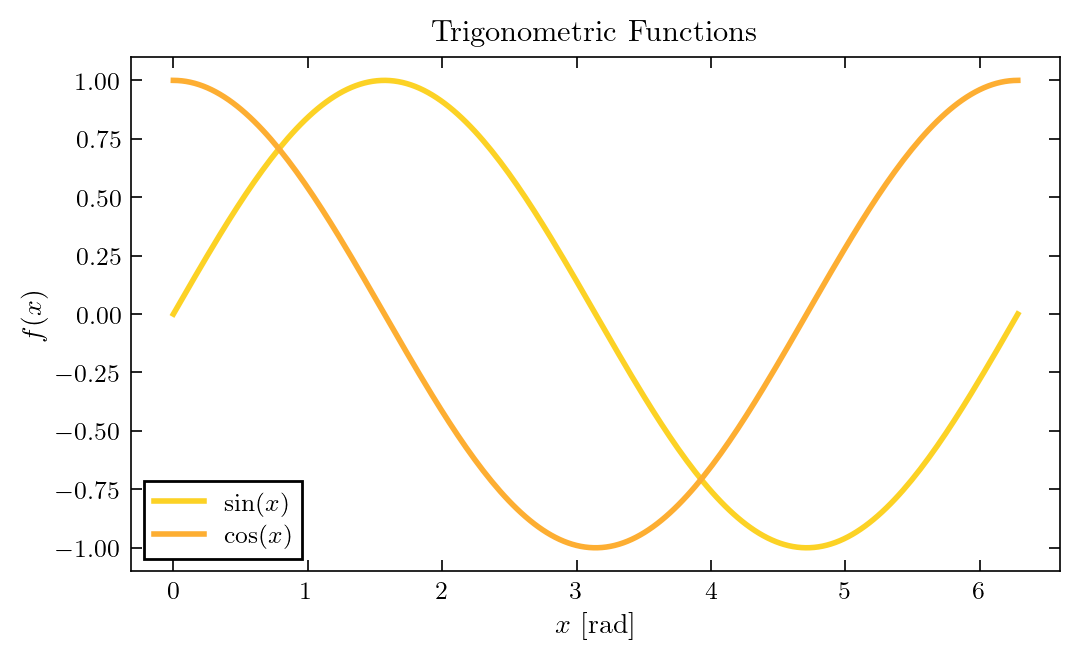
fig, ax = plt.subplots()  # 5.5" x 3.4" (golden ratio)

x = np.linspace(0, 2 * np.pi, 200)
plt.plot_styled(x, np.sin(x), label=r'$\sin(x)$', ax=ax)
plt.plot_styled(x, np.cos(x), label=r'$\cos(x)$', ax=ax)

plt.setup_axis(ax, xlabel=r'$x$ [rad]', ylabel=r'$f(x)$',
               title=r'Trigonometric Functions')
ax.legend()
plt.savefig('figure.pdf')  # 300 DPI PDF, ready for \includegraphics
Documentation
- FULL_DOCUMENTATION.md - Complete API reference and detailed guide
- examples/ - Working examples (demo.py, showcase.py, simple_example.py)
- notebooks/new_user_mpl_vs_matplotlibx.ipynb - Side-by-side default matplotlib vs matplotlibx
- notebooks/showcase_pasqal.ipynb - Pasqal colormaps demo (heatmaps, swatches, line plots)
- notebooks/showcase_latex.ipynb - LaTeX preset demo (Computer Modern, math labels, multi-panel)
Quick Reference
| Feature | Command |
|---|---|
| Progressive width | vary_linewidth=True |
| Outline | outline=True |
| Centerline | centerline=True |
| Nature style | apply_style_preset('nature') |
| LaTeX style | apply_style_preset('latex') |
| Pasqal colormaps | palette_name='pasqal' / 'pasqal_contrast' / 'pasqal_diverging' |
| Color cycling | color_idx=i |
| Axis setup | setup_axis(xlabel=..., ylabel=...) |
Feature Comparison
| Feature | matplotlib | pltx |
|---|---|---|
| Colorblind accessible | Manual | vary_linewidth=True |
| Line visibility | Complex code | outline=True |
| Journal styles | Research guidelines | One function call |
| Color palettes | Manual setup | Automatic |
Progressive Width Factors
| Factor | Increase | Best For |
|---|---|---|
| 1.2 | 20% | 8-10 lines |
| 1.3 | 30% | 4-6 lines (DEFAULT) |
| 1.5 | 50% | 2-4 lines |
Style Presets
| Preset | Fonts | Figure Size | Use Case |
|---|---|---|---|
| nature | Arial 7-9pt | 3.5"x2.6" | Nature journal |
| latex | Computer Modern 9-11pt | 5.5"x3.4" | LaTeX documents (usetex) |
| presentation | 16-18pt | 10"x6" | Slides |
| poster | 24-28pt | 12"x8" | Posters |
| default | 12-13pt | 6"x4" | General |
Dependencies
Required:
- matplotlib >= 3.5.0
- numpy >= 1.20.0
Optional:
- seaborn >= 0.11.0 (for extended palettes; falls back to matplotlib colormaps)
Why pltx?
- Accessible - Works for colorblind viewers (~8% of males)
- Publication-Ready - Journal-specific presets
- Easy to Use - Drop-in replacement for matplotlib
- Flexible - Works with all plot types
- Well-Documented - Comprehensive guides and examples
Quick Tips
- Always use
vary_linewidth=Truefor multi-line plots - Choose factor based on number of lines (1.2 for many, 1.5 for few)
- Test in grayscale to verify accessibility
- Use presets to match your target medium
- Combine features for maximum effect
Testing
The package includes a comprehensive test suite using pytest.
# Install test dependencies
pip install pytest

# Run all tests
pytest tests
The test suite covers color palette logic, style initialization, enhanced plotting functions, and style context management.
Version: 0.1.2 Python: 3.10+ Created: 2026-01-09 Author: Igor Sokolov
For complete documentation, see FULL_DOCUMENTATION.md
1 maintainer

Metadata
1 maintainer
Release files for matplotlibx 0.1.3
For a detailed explanation of source distributions (sdists) and built distributions (wheels), please see the package formats documentation.
Source distribution (sdist)
| File | Size | Uploaded | |
|---|---|---|---|
| matplotlibx-0.1.3.tar.gz | 39.0 kB | Details |
Built distribution (wheel)
| File | Interpreter | ABI | Platform | Reset |
|---|---|---|---|---|
| matplotlibx-0.1.3-py3-none-any.whl | Python 3 | none | any | Details |
Total release size: 76.5 kB
Release files / matplotlibx-0.1.3.tar.gz
| Download URL | matplotlibx-0.1.3.tar.gz |
|---|---|
| Size | 39.0 kB |
| Tags | Source |
|
SHA-256 checksum How to use checksums |
b8f7ee817eae9229a0b624bf13ead3bffb8696c3f63c8d6b67871b72f42ab2b8
|
|
BLAKE2b-256 checksum How to use checksums |
5ce33046e10494323a38cac02eba93ebb6636cda797898795192c925df9ce56a
|
| Upload date | |
|
Uploaded using Trusted Publishing? What is trusted publishing? |
No |
| Uploaded via |
twine/6.2.0 CPython/3.10.11
|
Release files / matplotlibx-0.1.3-py3-none-any.whl
| Download URL | matplotlibx-0.1.3-py3-none-any.whl |
|---|---|
| Size | 37.5 kB |
| Tags | Python 3 |
|
SHA-256 checksum How to use checksums |
b043c0f24918324a9211d5a1ea5a892e0929e9dbf76ccb37fa26a7b8d6ee8b60
|
|
BLAKE2b-256 checksum How to use checksums |
308e8a2ebfbedf13386d4ce3d354017bf258358f28afc95cf06599e9a22efd72
|
| Upload date | |
|
Uploaded using Trusted Publishing? What is trusted publishing? |
No |
| Uploaded via |
twine/6.2.0 CPython/3.10.11
|














