Enhanced Matplotlib wrapper with publication-quality styling and colorblind accessibility

Project description
pltx - Enhanced Matplotlib for Scientific Visualization
A matplotlib wrapper with publication-quality styling and colorblind accessibility features.

I got bored to always create some custom formatting for my plots, run into reviewers asking for improving readability. I want just to import and use it with minor modifications. Here I made something one can install and have pretty looking plots ready to go (just some personal styling on top of matplotlib).
Credits to Mathieu Garrigues for Pasqal colormaps (pasqal, pasqal_contrast, pasqal_diverging).
Key Features
- Colorblind Accessible - Progressive line width variation distinguishes lines by thickness AND color
- Journal-Ready Presets - Nature, LaTeX, presentation, and poster styles in one function call
- Line Visibility - Optional outlines and centerlines for better contrast
- Drop-in Replacement - Works with all matplotlib plot types
- Auto Color Cycling - Intelligent palette management with intensity control
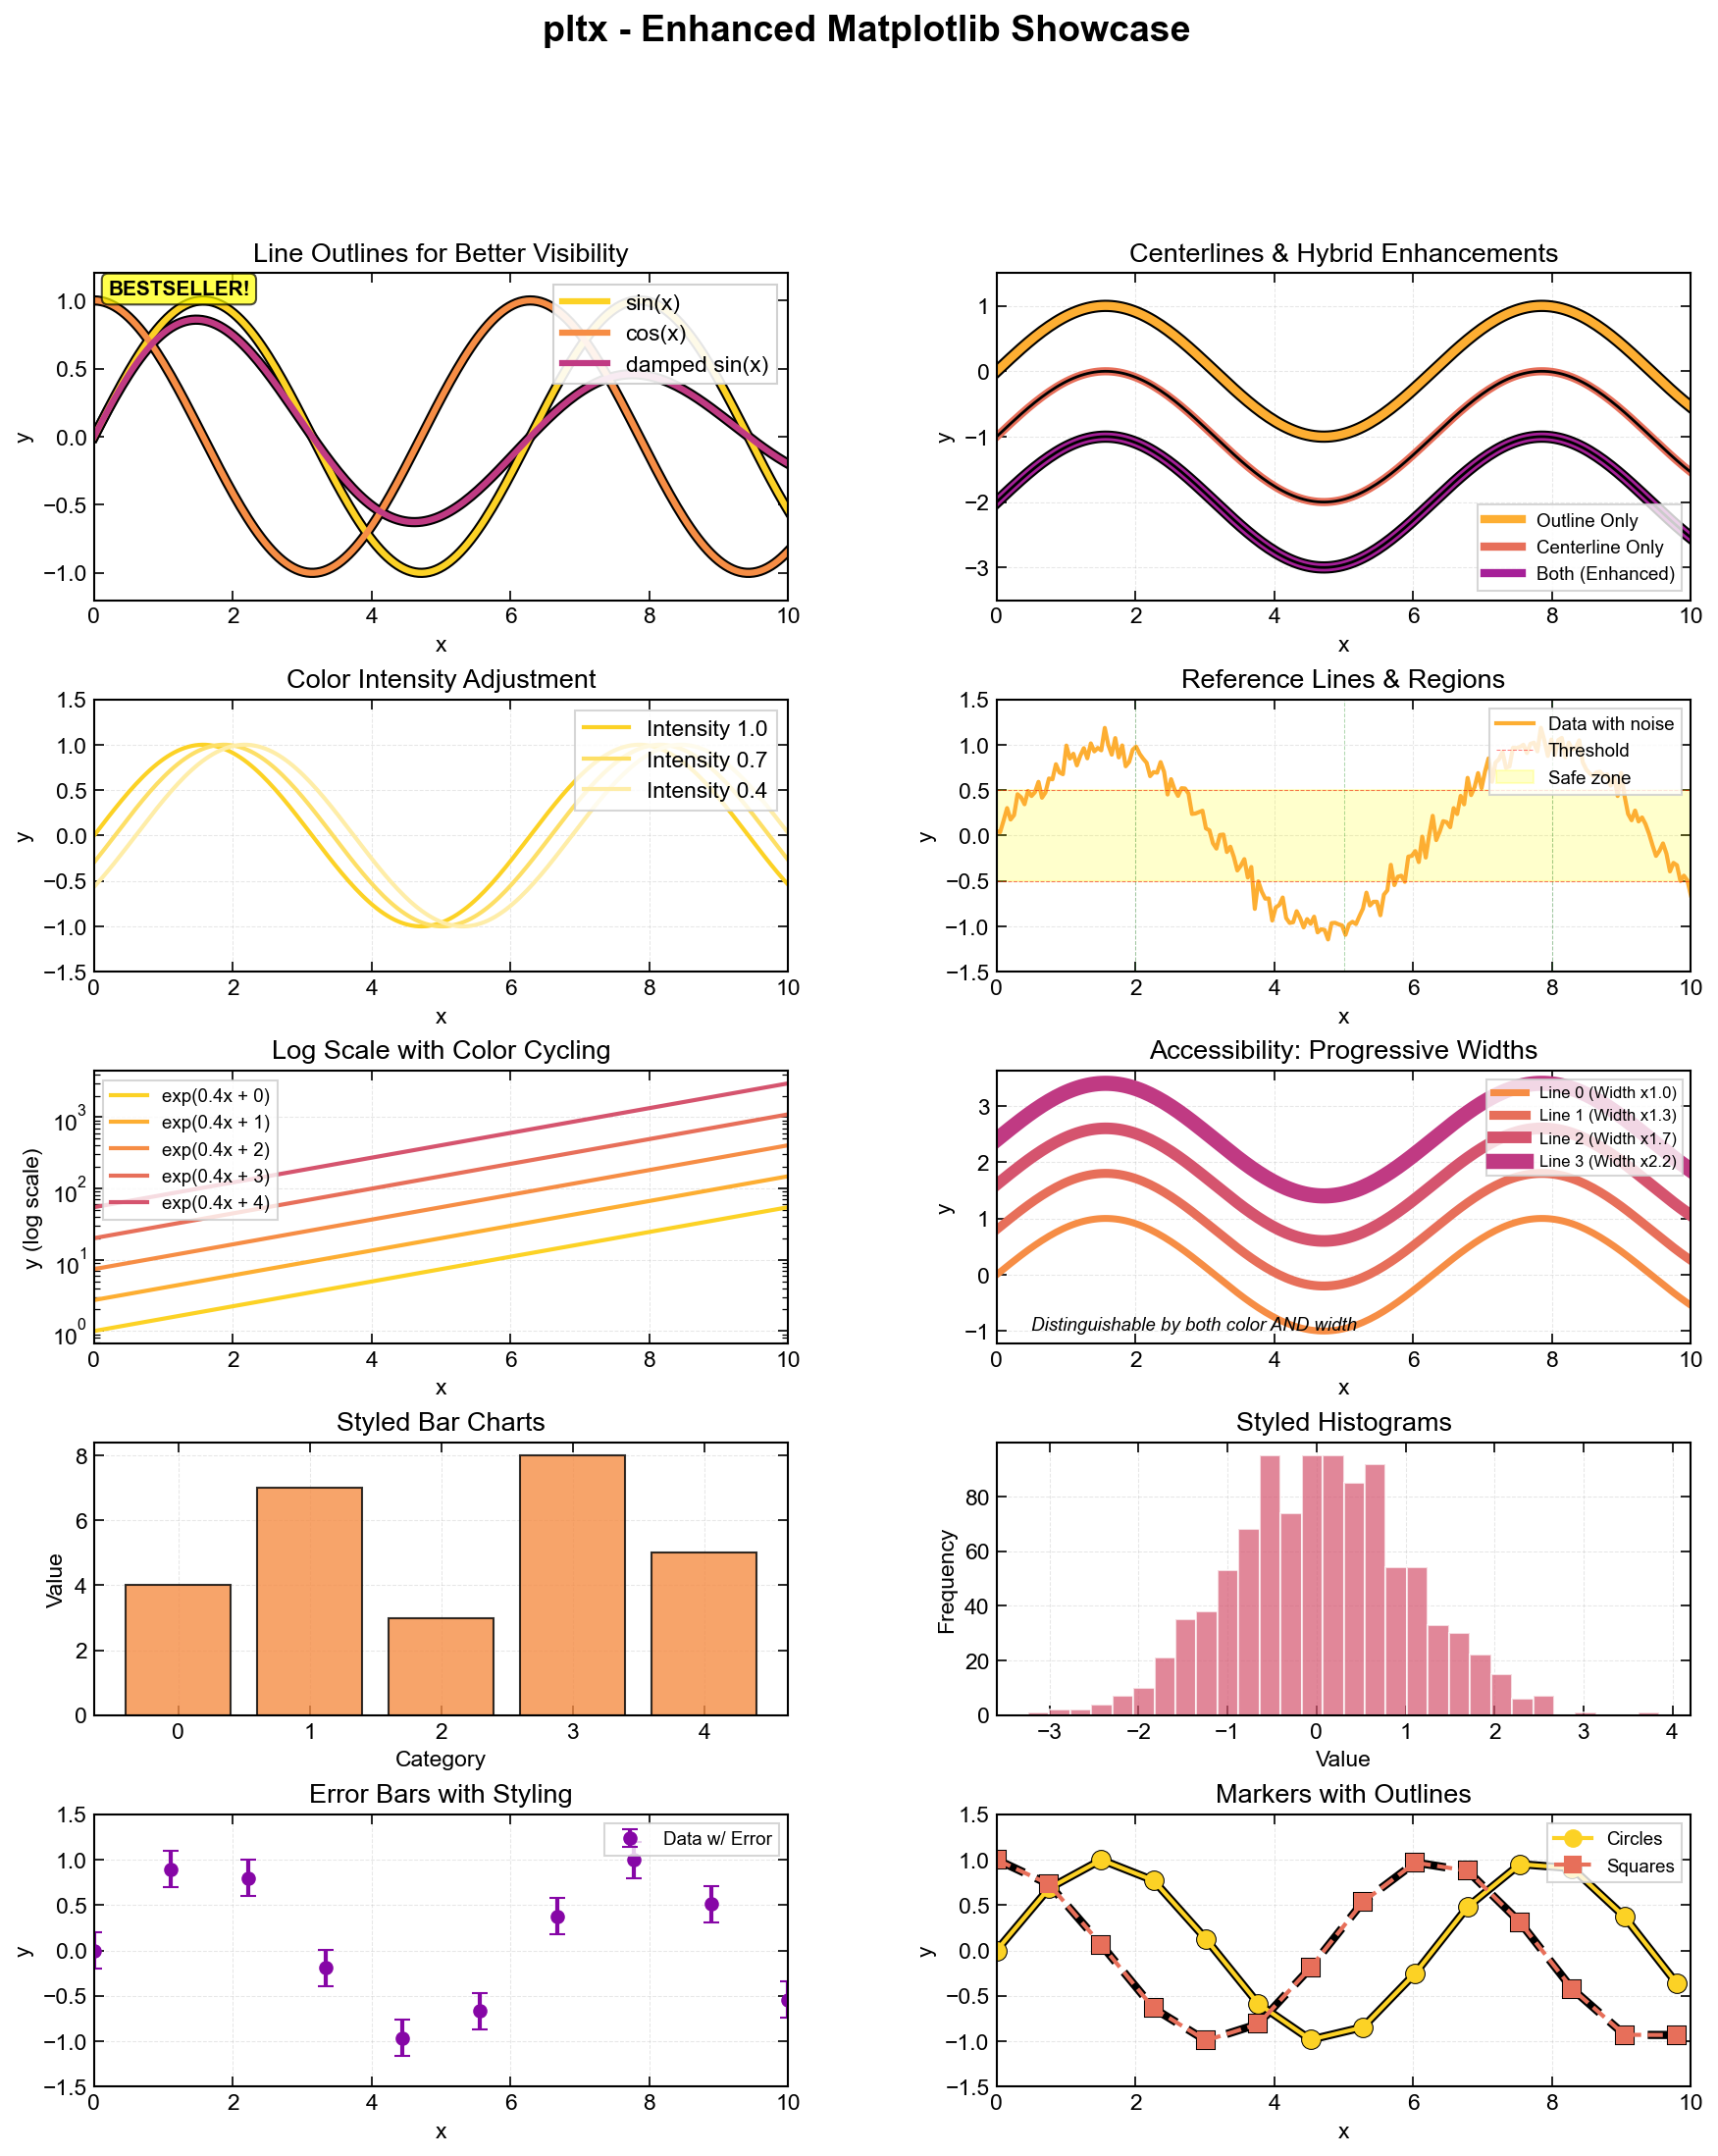
Example Gallery
Quick Start
For a new user, the fastest path is:
import pltx.pyplot as plt
plt.initialize_style()
Then use plt.plot_styled(...) (or regular matplotlib calls) and your figures get consistent defaults immediately.
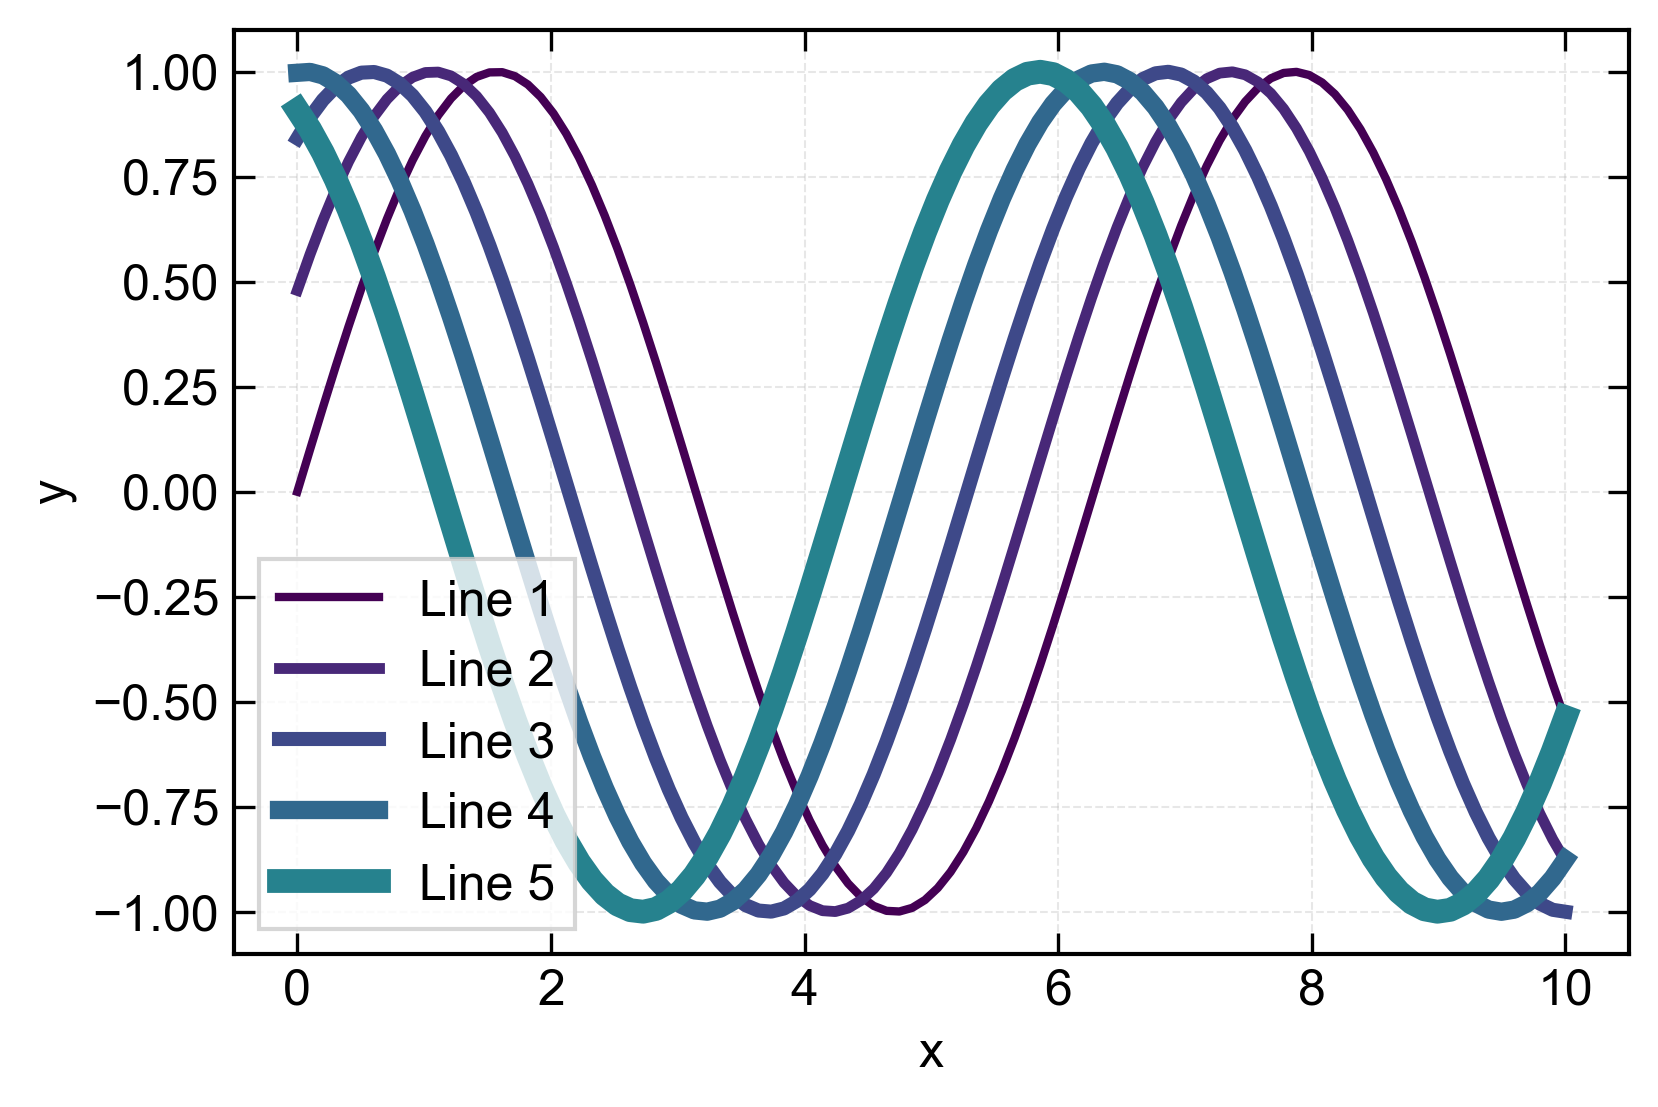
import pltx.pyplot as plt
import numpy as np

# Enable colorblind-friendly progressive widths
plt.initialize_style(
    palette_name='pasqal',
    vary_linewidth=True,              # Lines get progressively thicker
    linewidth_progression_factor=1.3  # 30% increase per line
)

# Plot with automatic styling
x = np.linspace(0, 10, 100)
for i in range(5):
    plt.plot_styled(x, np.sin(x + i*0.5),
                   color_idx=i,
                   centerline=True,  # Add thin line on top
                   label=f'Line {i+1}')

plt.setup_axis(xlabel='x', ylabel='y', grid=True)
plt.legend()
plt.savefig('plot.png', dpi=300)
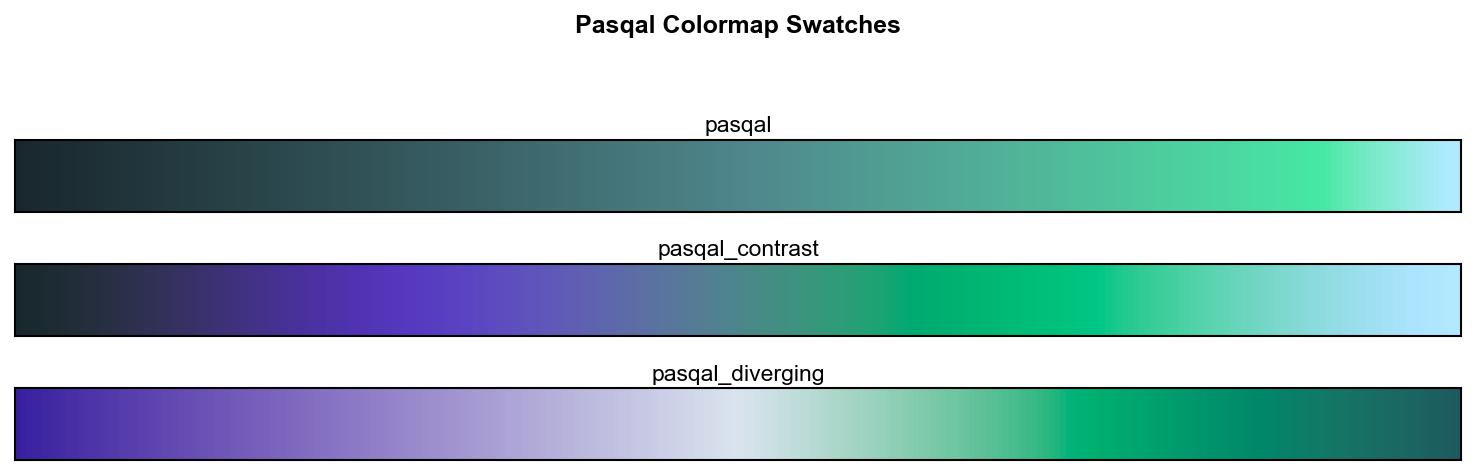
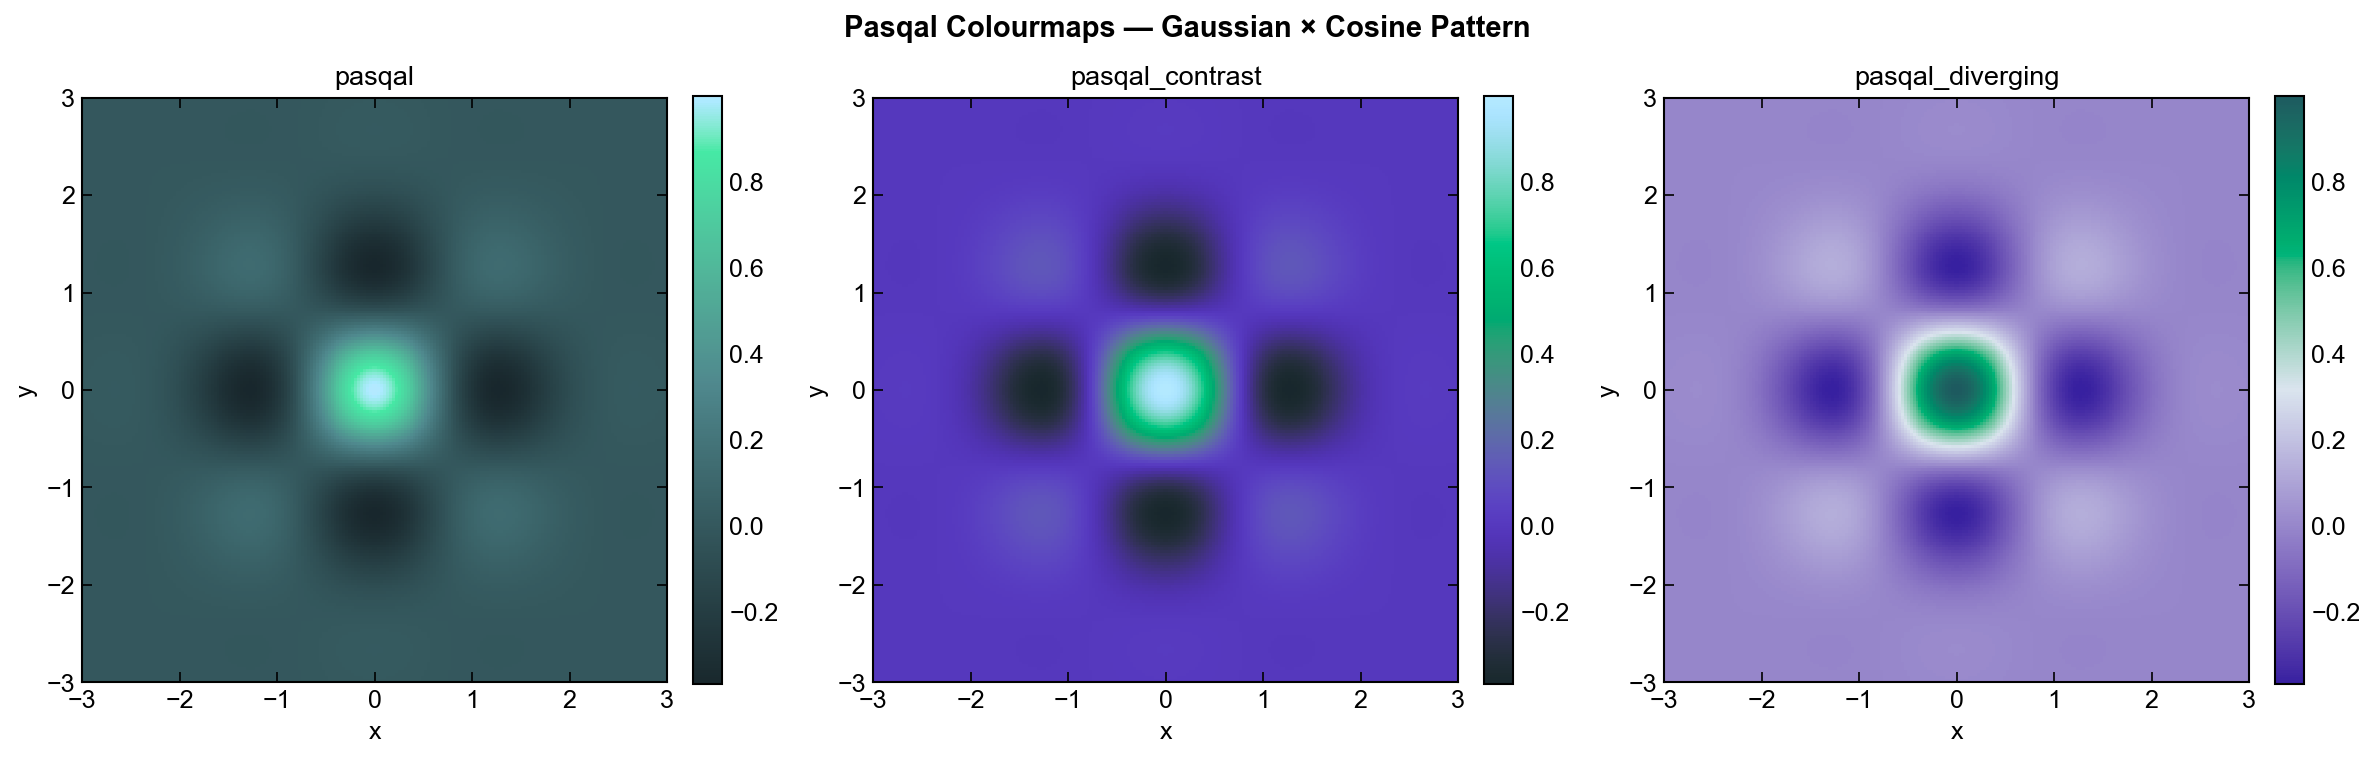
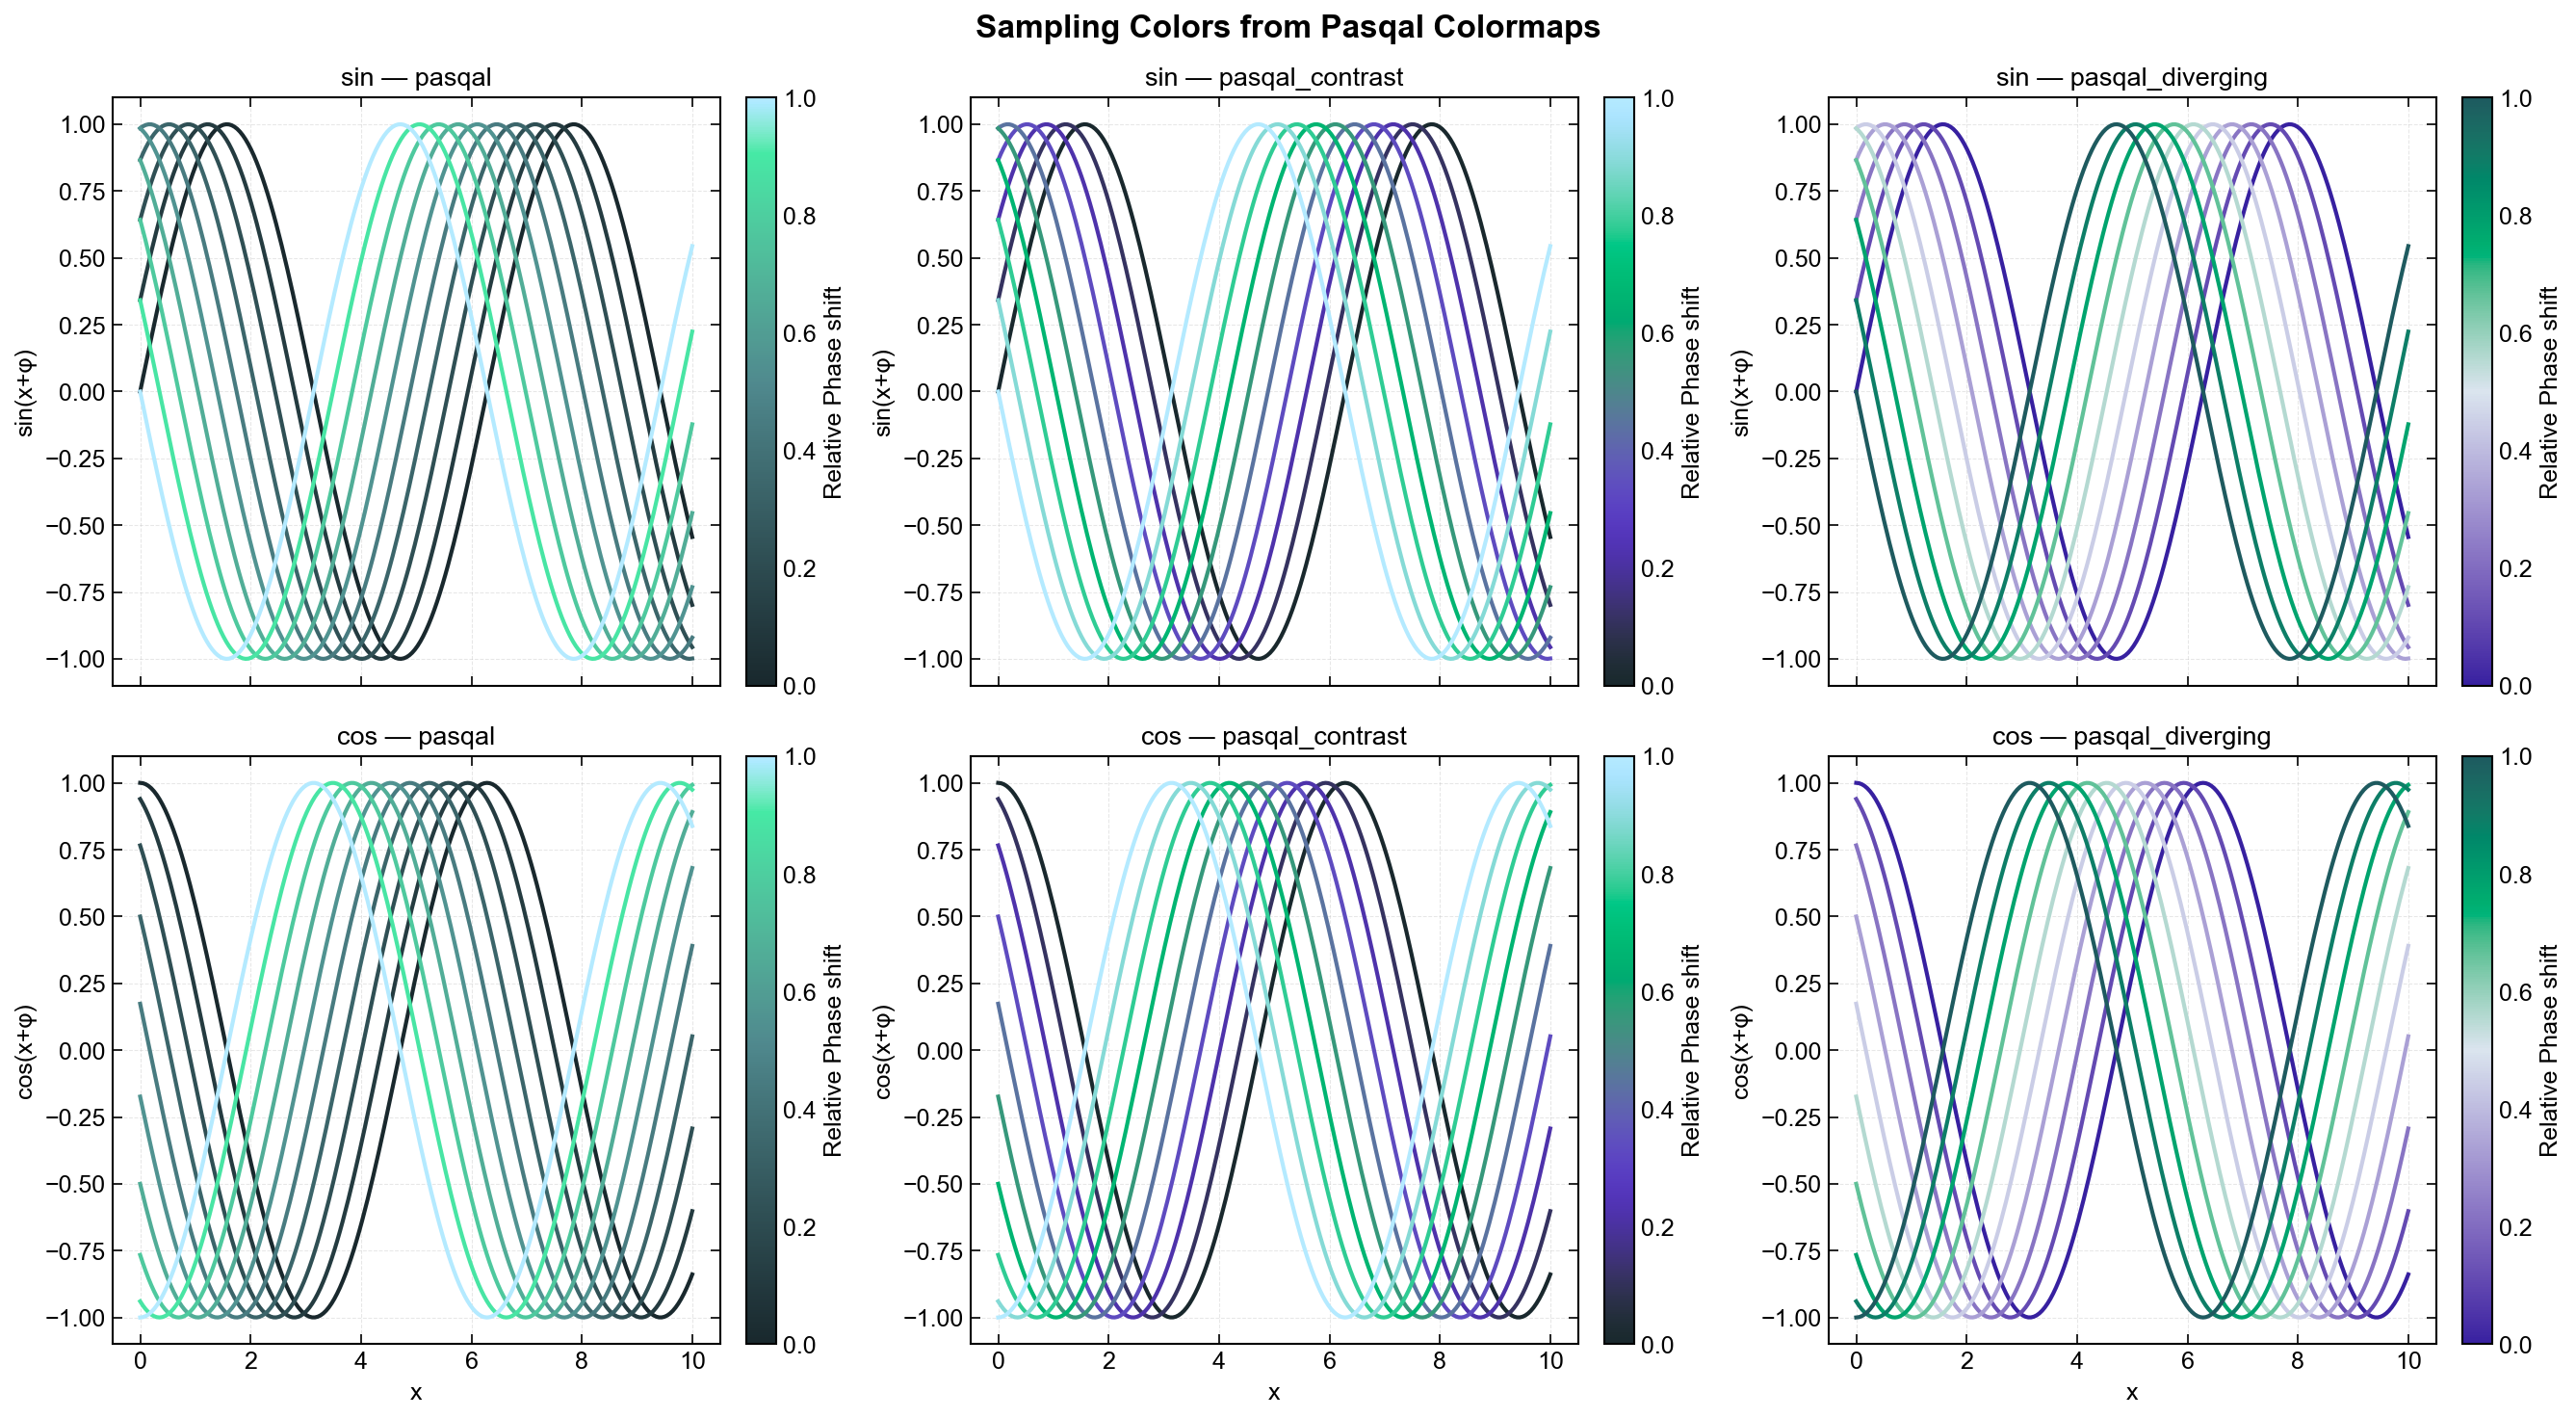
Pasqal Colormaps
Three custom Pasqal colormaps are auto-registered on import — no setup needed:
pasqal— main brand colourmap (dark teal to bright green)pasqal_contrast— higher-contrast variant (purple to cyan)pasqal_diverging— diverging colourmap (blue-purple through white to teal-green)
# Use as palette for line plots
plt.initialize_style(palette_name='pasqal')

# Or use directly with any matplotlib function
ax.imshow(data, cmap='pasqal_diverging')
Regenerate these images with python examples/generate_readme_images.py.
Installation
pip install matplotlibx

# With optional seaborn support for extended palettes
pip install matplotlibx[all]
Key Features in Detail
1. Progressive Line Width (Colorblind Accessible)
Each line automatically gets thicker - distinguishable by both color and width:
plt.initialize_style(
    vary_linewidth=True,
    base_linewidth=2.0,
    linewidth_progression_factor=1.3  # 1.2=gentle, 1.3=moderate, 1.5=strong
)
Result: Line 0: 2.0pt -> Line 1: 2.6pt -> Line 2: 3.4pt -> Line 3: 4.4pt
2. Line Enhancements
# Outline (thick line behind)
plt.plot_styled(x, y, color_idx=0, outline=True)

# Centerline (thin line on top)
plt.plot_styled(x, y, color_idx=0, centerline=True)

# Both (maximum contrast)
plt.plot_styled(x, y, color_idx=0, outline=True, centerline=True)
3. Journal Presets
from pltx.rcparams import apply_style_preset

apply_style_preset('nature')        # Nature journal (Arial, 7-9pt, 3.5")
apply_style_preset('latex')         # LaTeX documents (Computer Modern, 10pt, usetex)
apply_style_preset('presentation')  # Slides (16-18pt, thick lines)
apply_style_preset('poster')        # Posters (24-28pt)
4. Works with All Plot Types
from pltx.colors import get_color

# Bar plots
colors = [get_color(i) for i in range(5)]
plt.bar(categories, values, color=colors)

# Scatter plots
plt.plot_styled(x, y, marker='o', linestyle='', color_idx=0)

# All matplotlib functions available!
Real-World Examples
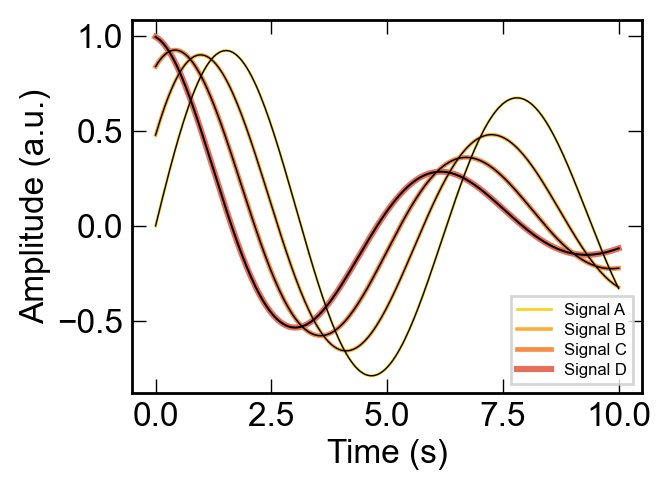
Nature Journal Submission
from pltx.rcparams import apply_style_preset
import pltx.pyplot as plt

# Apply Nature style + accessibility
apply_style_preset('nature')
plt.initialize_style(
    vary_linewidth=True,
    base_linewidth=1.0,
    linewidth_progression_factor=1.3
)

# Single column figure
fig, ax = plt.subplots(figsize=(3.5, 2.6))

for i in range(4):
    plt.plot_styled(x, data[i],
                   color_idx=i,
                   centerline=True,  # Better in print
                   label=labels[i])

plt.setup_axis(xlabel='Time (s)', ylabel='Amplitude (a.u.)')
plt.legend()
plt.savefig('figure1.pdf', dpi=300)
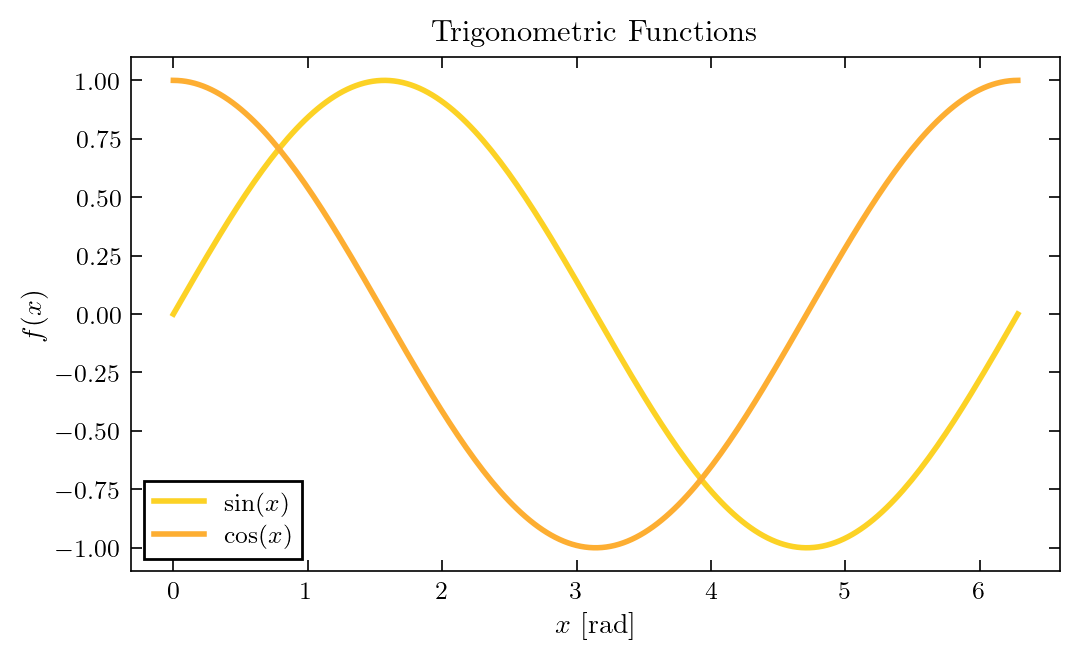
LaTeX Document Figure
from pltx.rcparams import apply_style_preset
import pltx.pyplot as plt
import numpy as np

# Computer Modern fonts, usetex=True, amsmath loaded
apply_style_preset('latex')

fig, ax = plt.subplots()  # 5.5" x 3.4" (golden ratio)

x = np.linspace(0, 2 * np.pi, 200)
plt.plot_styled(x, np.sin(x), label=r'$\sin(x)$', ax=ax)
plt.plot_styled(x, np.cos(x), label=r'$\cos(x)$', ax=ax)

plt.setup_axis(ax, xlabel=r'$x$ [rad]', ylabel=r'$f(x)$',
               title=r'Trigonometric Functions')
ax.legend()
plt.savefig('figure.pdf')  # 300 DPI PDF, ready for \includegraphics
Documentation
- FULL_DOCUMENTATION.md - Complete API reference and detailed guide
- examples/ - Working examples (demo.py, showcase.py, simple_example.py)
- notebooks/new_user_mpl_vs_matplotlibx.ipynb - Side-by-side default matplotlib vs matplotlibx
- notebooks/showcase_pasqal.ipynb - Pasqal colormaps demo (heatmaps, swatches, line plots)
- notebooks/showcase_latex.ipynb - LaTeX preset demo (Computer Modern, math labels, multi-panel)
Quick Reference
| Feature | Command |
|---|---|
| Progressive width | vary_linewidth=True |
| Outline | outline=True |
| Centerline | centerline=True |
| Nature style | apply_style_preset('nature') |
| LaTeX style | apply_style_preset('latex') |
| Pasqal colormaps | palette_name='pasqal' / 'pasqal_contrast' / 'pasqal_diverging' |
| Color cycling | color_idx=i |
| Axis setup | setup_axis(xlabel=..., ylabel=...) |
Feature Comparison
| Feature | matplotlib | pltx |
|---|---|---|
| Colorblind accessible | Manual | vary_linewidth=True |
| Line visibility | Complex code | outline=True |
| Journal styles | Research guidelines | One function call |
| Color palettes | Manual setup | Automatic |
Progressive Width Factors
| Factor | Increase | Best For |
|---|---|---|
| 1.2 | 20% | 8-10 lines |
| 1.3 | 30% | 4-6 lines (DEFAULT) |
| 1.5 | 50% | 2-4 lines |
Style Presets
| Preset | Fonts | Figure Size | Use Case |
|---|---|---|---|
| nature | Arial 7-9pt | 3.5"x2.6" | Nature journal |
| latex | Computer Modern 9-11pt | 5.5"x3.4" | LaTeX documents (usetex) |
| presentation | 16-18pt | 10"x6" | Slides |
| poster | 24-28pt | 12"x8" | Posters |
| default | 12-13pt | 6"x4" | General |
Dependencies
Required:
- matplotlib >= 3.5.0
- numpy >= 1.20.0
Optional:
- seaborn >= 0.11.0 (for extended palettes; falls back to matplotlib colormaps)
Why pltx?
- Accessible - Works for colorblind viewers (~8% of males)
- Publication-Ready - Journal-specific presets
- Easy to Use - Drop-in replacement for matplotlib
- Flexible - Works with all plot types
- Well-Documented - Comprehensive guides and examples
Quick Tips
- Always use
vary_linewidth=Truefor multi-line plots - Choose factor based on number of lines (1.2 for many, 1.5 for few)
- Test in grayscale to verify accessibility
- Use presets to match your target medium
- Combine features for maximum effect
Testing
The package includes a comprehensive test suite using pytest.
# Install test dependencies
pip install pytest

# Run all tests
pytest tests
The test suite covers color palette logic, style initialization, enhanced plotting functions, and style context management.
Version: 0.1.2 Python: 3.10+ Created: 2026-01-09 Author: Igor Sokolov
For complete documentation, see FULL_DOCUMENTATION.md


Download files
Download the file for your platform. If you're not sure which to choose, learn more about installing packages.
Source Distribution
Built Distribution
Filter files by name, interpreter, ABI, and platform.
If you're not sure about the file name format, learn more about wheel file names.
Copy a direct link to the current filters
File details
Details for the file matplotlibx-0.1.3.tar.gz.
File metadata
- Download URL: matplotlibx-0.1.3.tar.gz
- Upload date:
- Size: 39.0 kB
- Tags: Source
- Uploaded using Trusted Publishing? No
- Uploaded via: twine/6.2.0 CPython/3.10.11
File hashes
| Algorithm | Hash digest | |
|---|---|---|
| SHA256 |
b8f7ee817eae9229a0b624bf13ead3bffb8696c3f63c8d6b67871b72f42ab2b8
|
|
| MD5 |
450468eda3a38ae82e74837a470a3cda
|
|
| BLAKE2b-256 |
5ce33046e10494323a38cac02eba93ebb6636cda797898795192c925df9ce56a
|
File details
Details for the file matplotlibx-0.1.3-py3-none-any.whl.
File metadata
- Download URL: matplotlibx-0.1.3-py3-none-any.whl
- Upload date:
- Size: 37.5 kB
- Tags: Python 3
- Uploaded using Trusted Publishing? No
- Uploaded via: twine/6.2.0 CPython/3.10.11
File hashes
| Algorithm | Hash digest | |
|---|---|---|
| SHA256 |
b043c0f24918324a9211d5a1ea5a892e0929e9dbf76ccb37fa26a7b8d6ee8b60
|
|
| MD5 |
937fc2fd040fa18d9aa0d8827bd32e37
|
|
| BLAKE2b-256 |
308e8a2ebfbedf13386d4ce3d354017bf258358f28afc95cf06599e9a22efd72
|


