Browse, plot, and compare MITgcm MDS binary output from the CLI or an optional GUI.

Project description

Browse, plot, and compare MITgcm MDS (.data/.meta) binary output. Use the CLI on a cluster or the optional GUI on your laptop or PC.


Site: rhettadam.github.io/mdsview
MITgcm (MIT General Circulation Model) is a widely used ocean and climate model. A typical run writes out many 3-D fields (temperature, salinity, sea surface height, velocities) at regular time steps, often from MPI jobs on a cluster. The default binary format is MDS: each field is a .meta file (dimensions, precision, iteration) plus a .data file (raw array, usually big-endian float32). Tiled MPI output adds more filename suffixes but the same basic layout.
After a run you usually have a directory with hundreds or thousands of these file pairs and no built-in viewer. MITgcm ships MITgcmutils for reading and writing MDS in Python, but you still need scripts to list what's there, pick an iteration and level, plot a slice, or subtract two snapshots. mdsview fills that gap: catalog a run folder without loading .data, plot 2-D slices with grid coordinates, diff two times or two variables (DiD), and export figures or new MDS files from the terminal on a headless node or from a local GUI.
For huge LLC runs or lazy xarray loading, use xmitgcm. mdsview targets quick inspection of run directories.
Install
From PyPI:
pip install mdsview              # CLI (headless)
pip install "mdsview[gui]"       # + desktop GUI (CustomTkinter)
From source:
git clone https://github.com/rhettadam/mdsview.git
cd mdsview
pip install -e .
pip install -e ".[gui]"
On Windows, if mdsview is not on PATH:
python -m mdsview.cli info -d C:\path\to\run
Requires Python 3.9+, NumPy, matplotlib, MITgcmutils, cmocean, Pillow. GUI needs CustomTkinter.
Quick start
mdsview info -d /path/to/run
mdsview plot -v T -i 480 -l 4 -d /path/to/run
mdsview plot -v T -i 480 -l 4 --save-figure t.png --no-show -d /path/to/run   # headless
mdsview gui -d /path/to/run
-d FOLDER is the run directory (default: .). -v NAME is the field prefix (T, S, Eta, …). Most commands accept --json. Run mdsview COMMAND --help for options.
Sample data
Synthetic run directories for testing without MITgcm:
mdsview generate-sample -o sample_data --preset demo
See sample_data/SAMPLE_README.txt after generation. Other presets and options: mdsview generate-sample --help.
CLI
info
List variables or show metadata. Reads .meta only, safe with thousands of snapshots.
mdsview info
mdsview info -v T
mdsview info -v T --show-meta
mdsview info -v T --json
plot
One 2-D slice. With --level, reads a single horizontal slab, not the full volume.
mdsview plot -v T -i 480 -l 4
mdsview plot -v Eta -i last
mdsview plot -v T -i 0 -l 10 --cmap haline --vmin 0 --vmax 30 --save-figure out.png --no-show
mdsview plot -v T -i 0 --no-coords    # index axes, not XC/YC
diff
field(LATER) − field(EARLIER). Default is one slice; --save-field without --level loads full volumes.
mdsview diff -v T --later 2520 --earlier 0 -l 20
mdsview diff -v T --later 2520 --earlier 0 -l 20 --plot --save-figure diff.png --no-show
mdsview diff -v T --later 2520 --earlier 0 --save-field T_diff
mdsview diff -v T 480 0 -l 4          # positional iters also work
dod
Difference-of-differences: (B@t1 − A@t1) − (B@t2 − A@t2). Stats stream level-by-level; full 3-D output uses a memmap temp file.
mdsview dod -a T -b S --time1 0 --time2 2520
mdsview dod -a T -b S --time1 0 --time2 2520 -l 20 --plot --save-figure dod.png --no-show
mdsview dod -a T -b S --time1 0 --time2 2520 --save-field DiD_TS
mdsview dod -a UVEL -b VVEL --time1 0 --time2 120 --rec 0
combine
Stack iterations into one array. Loads every listed iteration; use for small tests only.
mdsview combine -v T --iterations 0,360,720 --save-field T_stack
generate-sample
Create synthetic .data/.meta for tests. See Sample data.
Plot options
Used by plot, diff, and dod:
-l,--level K: vertical index (0 = top)--cmap: defaultthermal(plot) orbalance(diff/dod); matplotlib + cmocean names--vmin,--vmax--save-figure FILE,--no-show
Diff/dod plots use a symmetric diverging scale. Full list: mdsview/colormaps.py.
GUI
pip install "mdsview[gui]"
mdsview gui -d /path/to/run
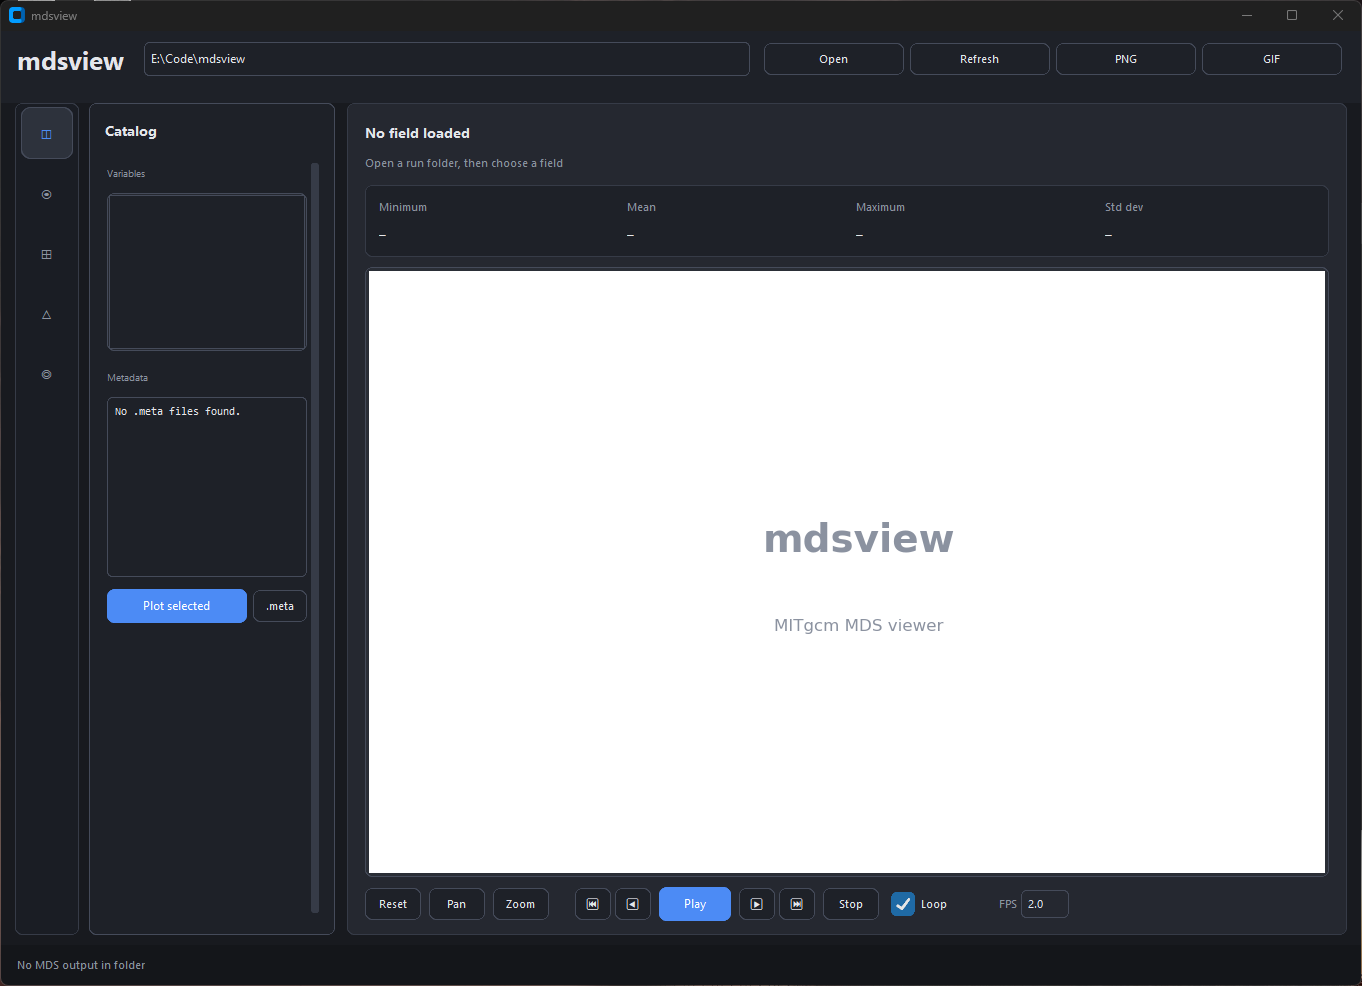
Run directory at the top. Left icons switch panels; controls sit beside the plot. Stats (min, mean, max, std) update with each field.
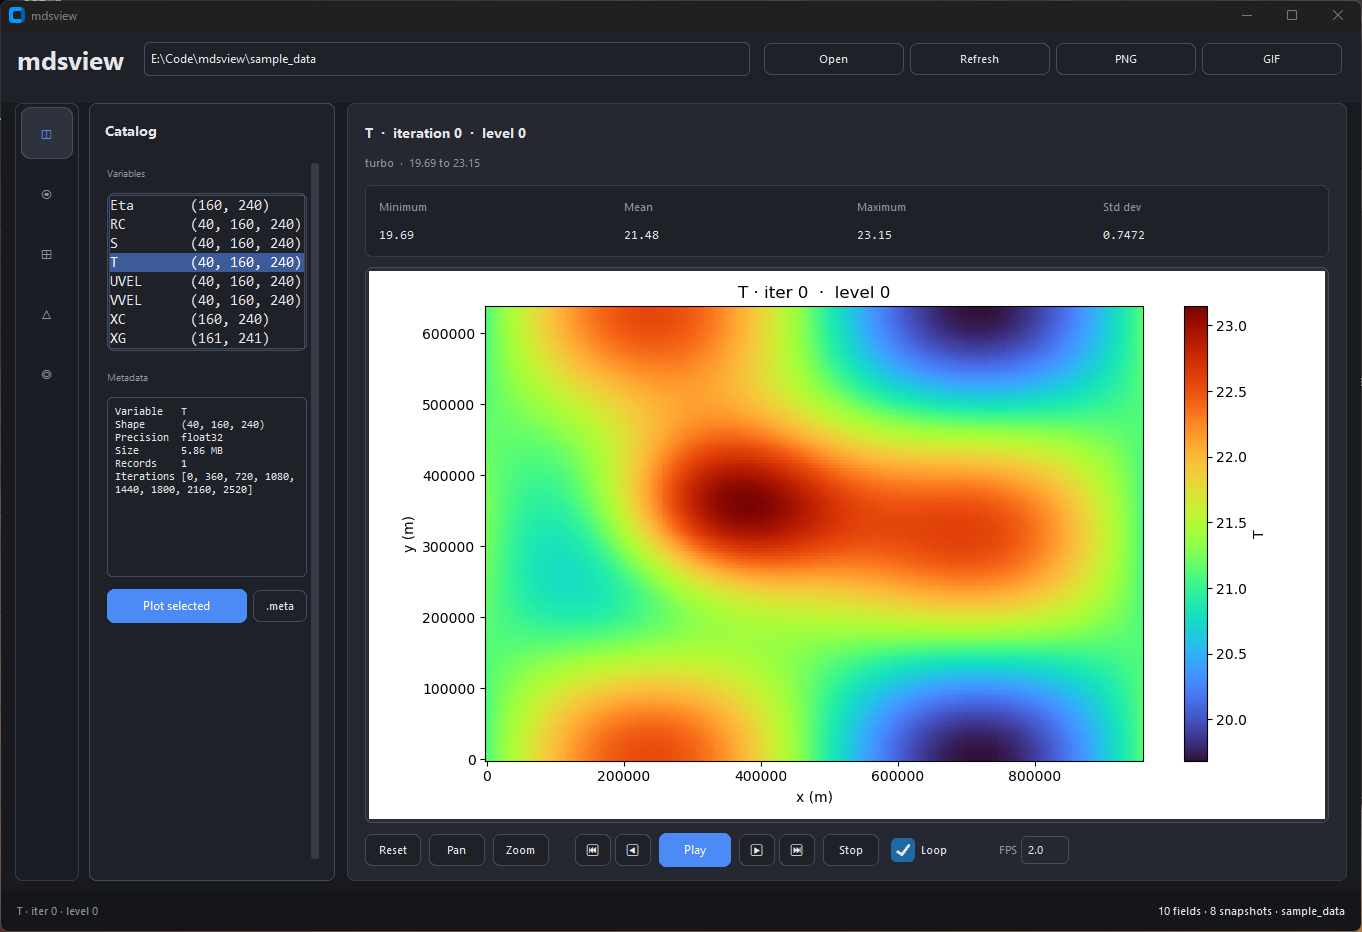
Lists every variable in the run. Selecting one shows metadata below; double-click or Plot selected opens it in Field.
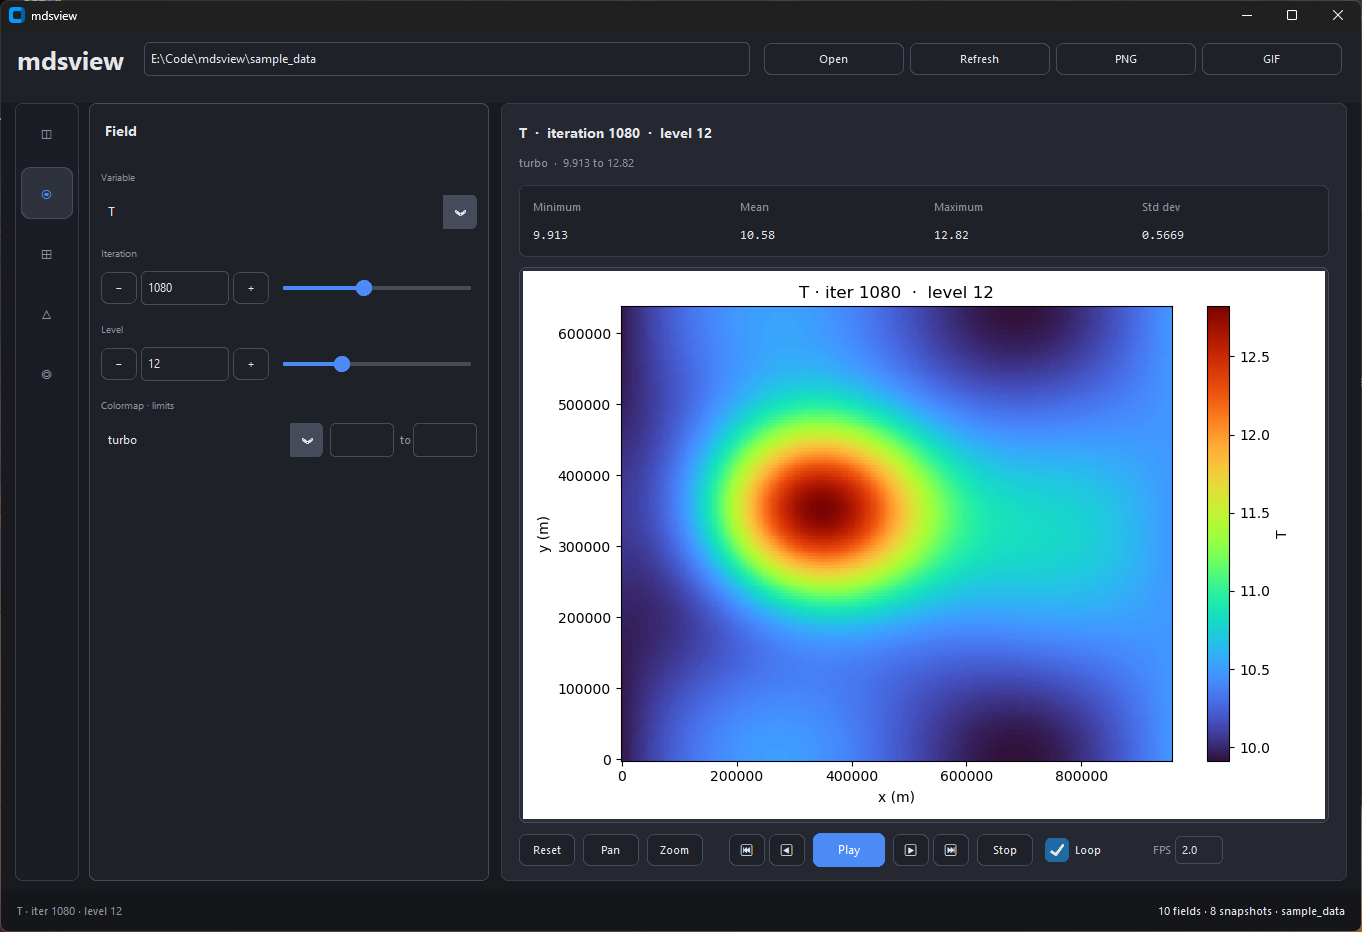
Pick variable, iteration, and level. Sliders auto-refresh the plot. Footer controls step through time or export a GIF.
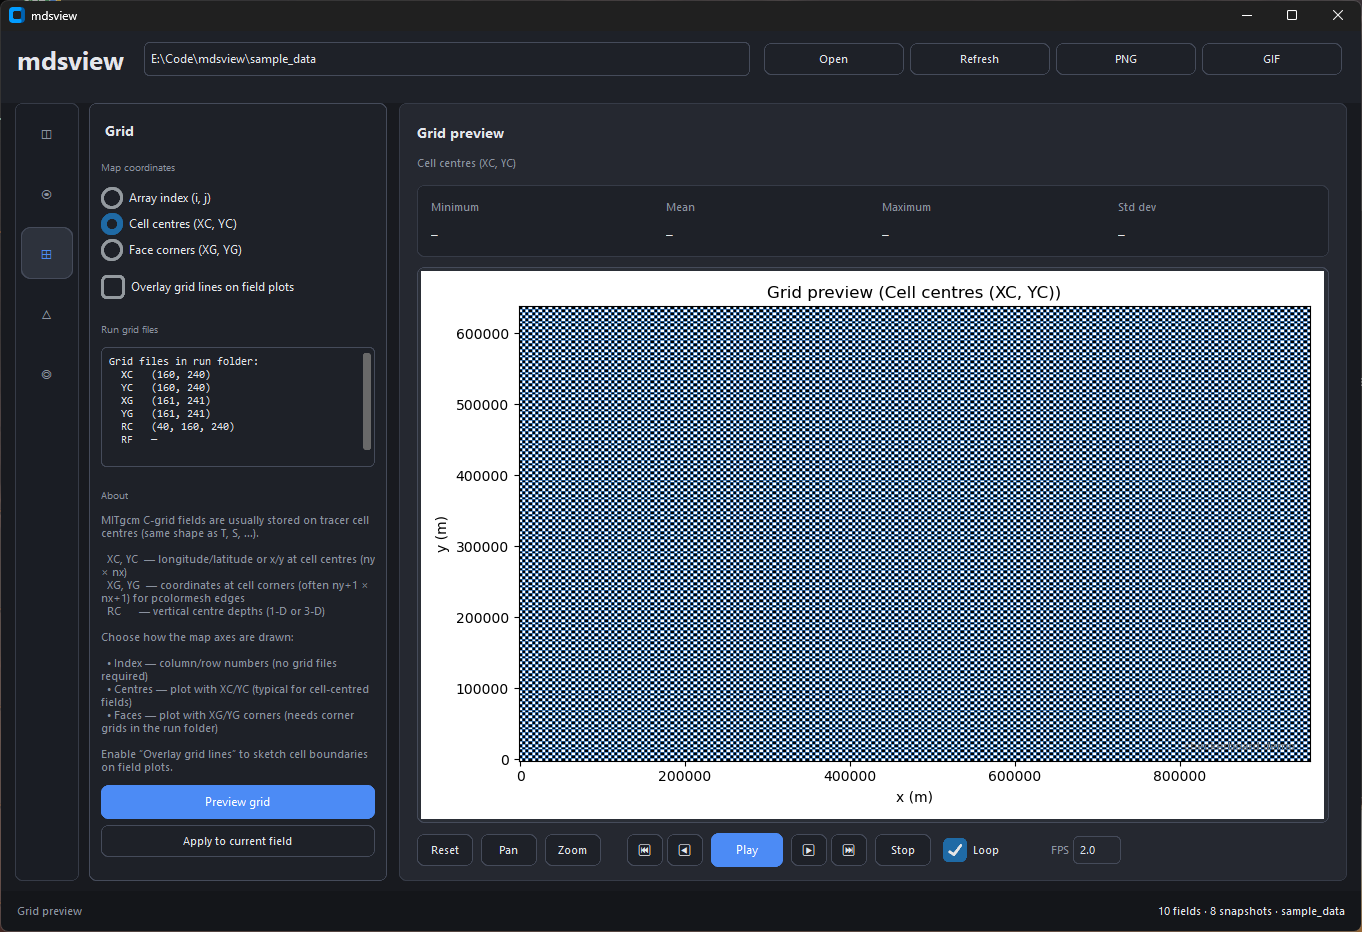
Preview XC/YC (or other grid files) and optionally overlay grid lines on field plots.
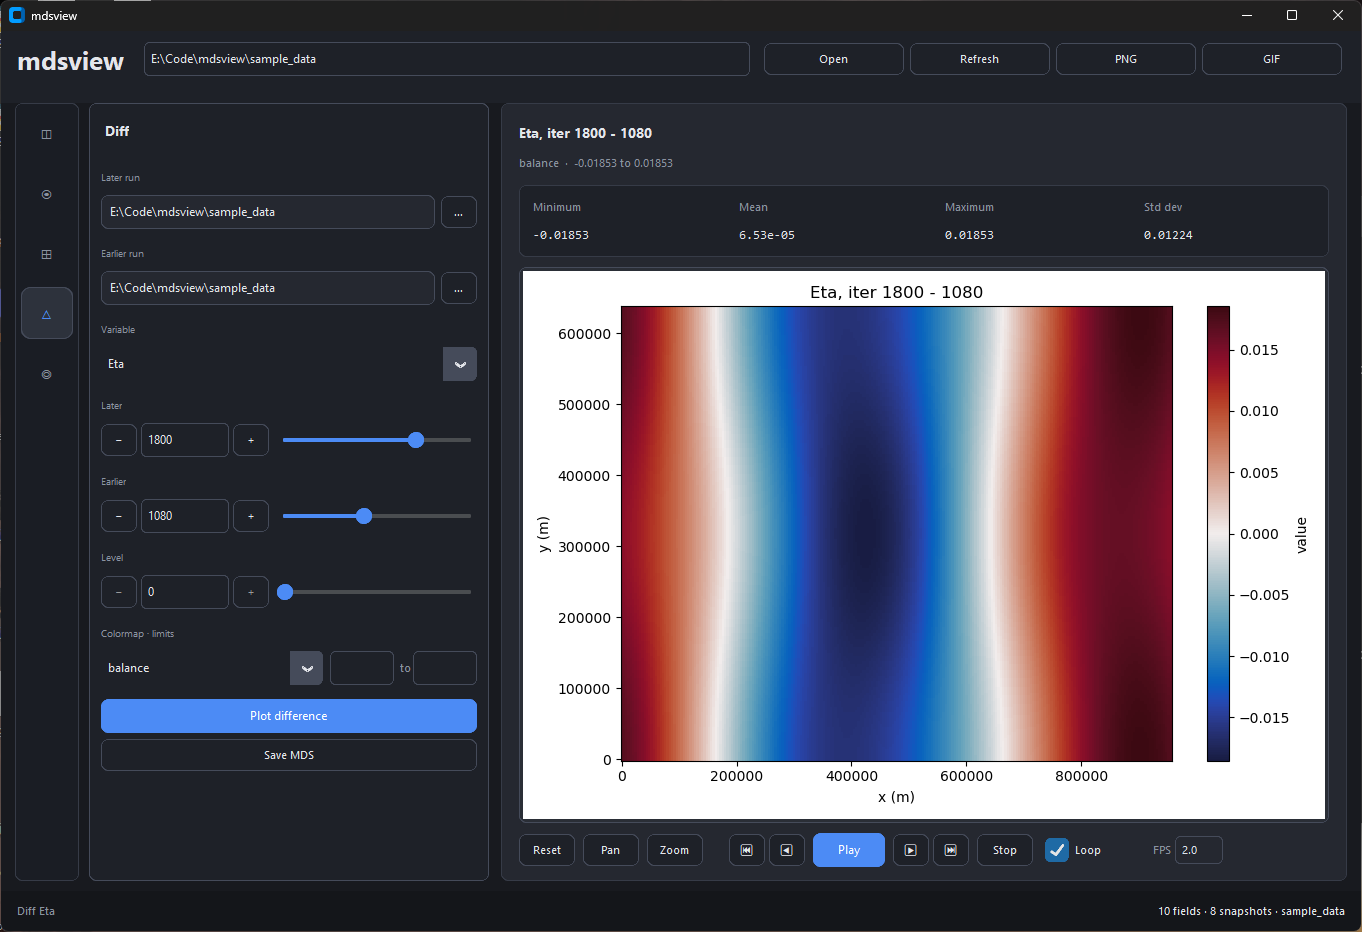
Subtract an earlier snapshot from a later one. Later and earlier can live in different run directories.
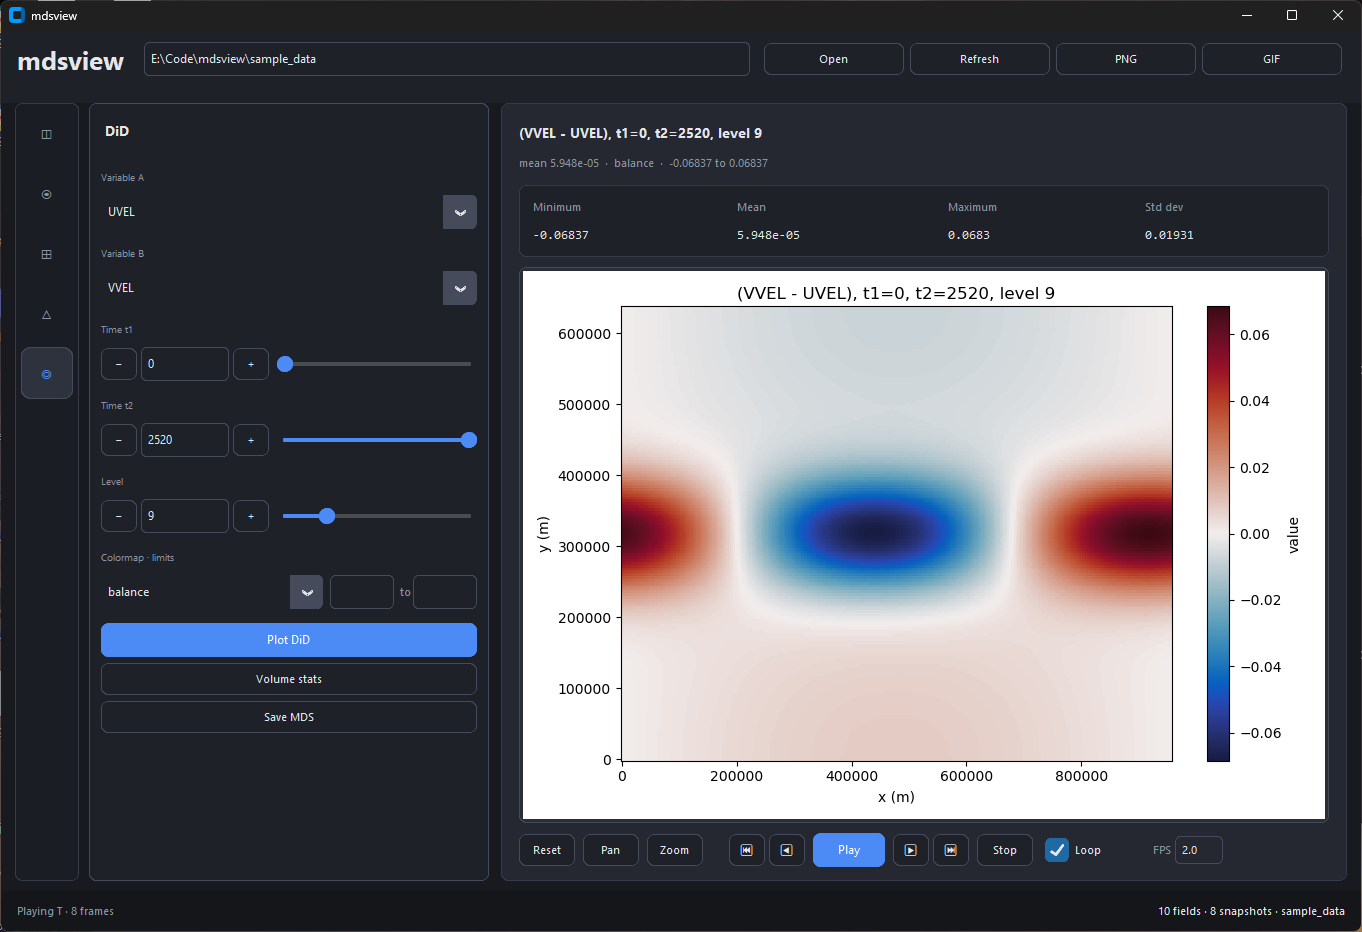
Plot or export the difference-of-differences between two variables at two times. Volume stats runs the same streaming calculation as mdsview dod without --plot.
Top bar: Open (Ctrl+O), Refresh (Ctrl+R), PNG (Ctrl+S), GIF (export dialog). Matplotlib pan/zoom sits under the plot.
HPC / batch
CLI uses the Agg backend by default (no display). Use --save-figure and --no-show:
mdsview info -d /scratch/run001
mdsview plot -v T -i last -l 20 -d /scratch/run001 --save-figure t.png --no-show
mdsview dod -a T -b S --time1 0 --time2 2520 --json -d /scratch/run001
Exit codes: 0 ok, 1 error, 2 bad args, 130 interrupt. Errors go to stderr. Tracebacks: MDSVIEW_DEBUG=1.
Memory
info:.metafilenames onlyplot/diffwith-l: one slab per snapshotdodstats: level-by-leveldod/diff --save-field(no level): full volume;combine: all listed iters in RAM
Python API
from mdsview import io, ops, plotting

slab = io.read_level_slice("/path/to/run", "T", 480, level=4)
diff2d, meta = ops.diff_slice("/path/to/run", "T", later=480, earlier=0, level=4)
plotting.plot_field("/path/to/run", "T", 480, level=4, save="t.png", show=False)
Limitations
- Standard MDS only, not
pkg/mnctiles (usegluemncfirst) dod --recfor multi-record files; other commands may need extending- No 3-D volume rendering; LLC unfolding is partial (needs XC/YC in the run dir)
License
MIT License. See LICENSE. Copyright (c) 2026 Rhett R. Adam.
Release history Release notifications | RSS feed


Download files
Download the file for your platform. If you're not sure which to choose, learn more about installing packages.
Source Distribution
Built Distribution
Filter files by name, interpreter, ABI, and platform.
If you're not sure about the file name format, learn more about wheel file names.
Copy a direct link to the current filters
File details
Details for the file mdsview-0.2.1.tar.gz.
File metadata
- Download URL: mdsview-0.2.1.tar.gz
- Upload date:
- Size: 82.6 kB
- Tags: Source
- Uploaded using Trusted Publishing? No
- Uploaded via: twine/6.2.0 CPython/3.13.9
File hashes
| Algorithm | Hash digest | |
|---|---|---|
| SHA256 |
6077c38839ee199dd02234be746a4edad5222b2b6cf9d967ade84b97ce01ce81
|
|
| MD5 |
958380a065ed194ce0c94d6c0208cdbd
|
|
| BLAKE2b-256 |
2f1378e45695ce36f58500260d3971d2a50f54a326863bd95f773de2a7838c3b
|
File details
Details for the file mdsview-0.2.1-py3-none-any.whl.
File metadata
- Download URL: mdsview-0.2.1-py3-none-any.whl
- Upload date:
- Size: 80.0 kB
- Tags: Python 3
- Uploaded using Trusted Publishing? No
- Uploaded via: twine/6.2.0 CPython/3.13.9
File hashes
| Algorithm | Hash digest | |
|---|---|---|
| SHA256 |
68db39991148c41f66c7dd014fd15d5485b3dc818b8ced3c6780f7555b914f90
|
|
| MD5 |
15a8603da077b350f3e511851b5b7e7f
|
|
| BLAKE2b-256 |
07c4bc43bf21bedf885171b9c10333608cfe08e6dc4c1fb88a7359c9035f5b42
|


