
MIPY: Missing-data Imputation in Python



MIPY finds out which imputation method works best on your data, fills in the missing values with it, and gives you the tables, figures and a report to show for it. It is built for high-dimensional longitudinal data: many variables (for example hundreds of proteins) measured repeatedly on the same patients, as in the serum proteomics series GSE65622.
import mipy
res = mipy.analyze("my_data.csv")      # one line: benchmark, impute, figures, report
That call:
- reads the table and works out which column is the patient ID, which is the visit, which are features, clinical covariates and survival times (and tells you, so you can correct it);
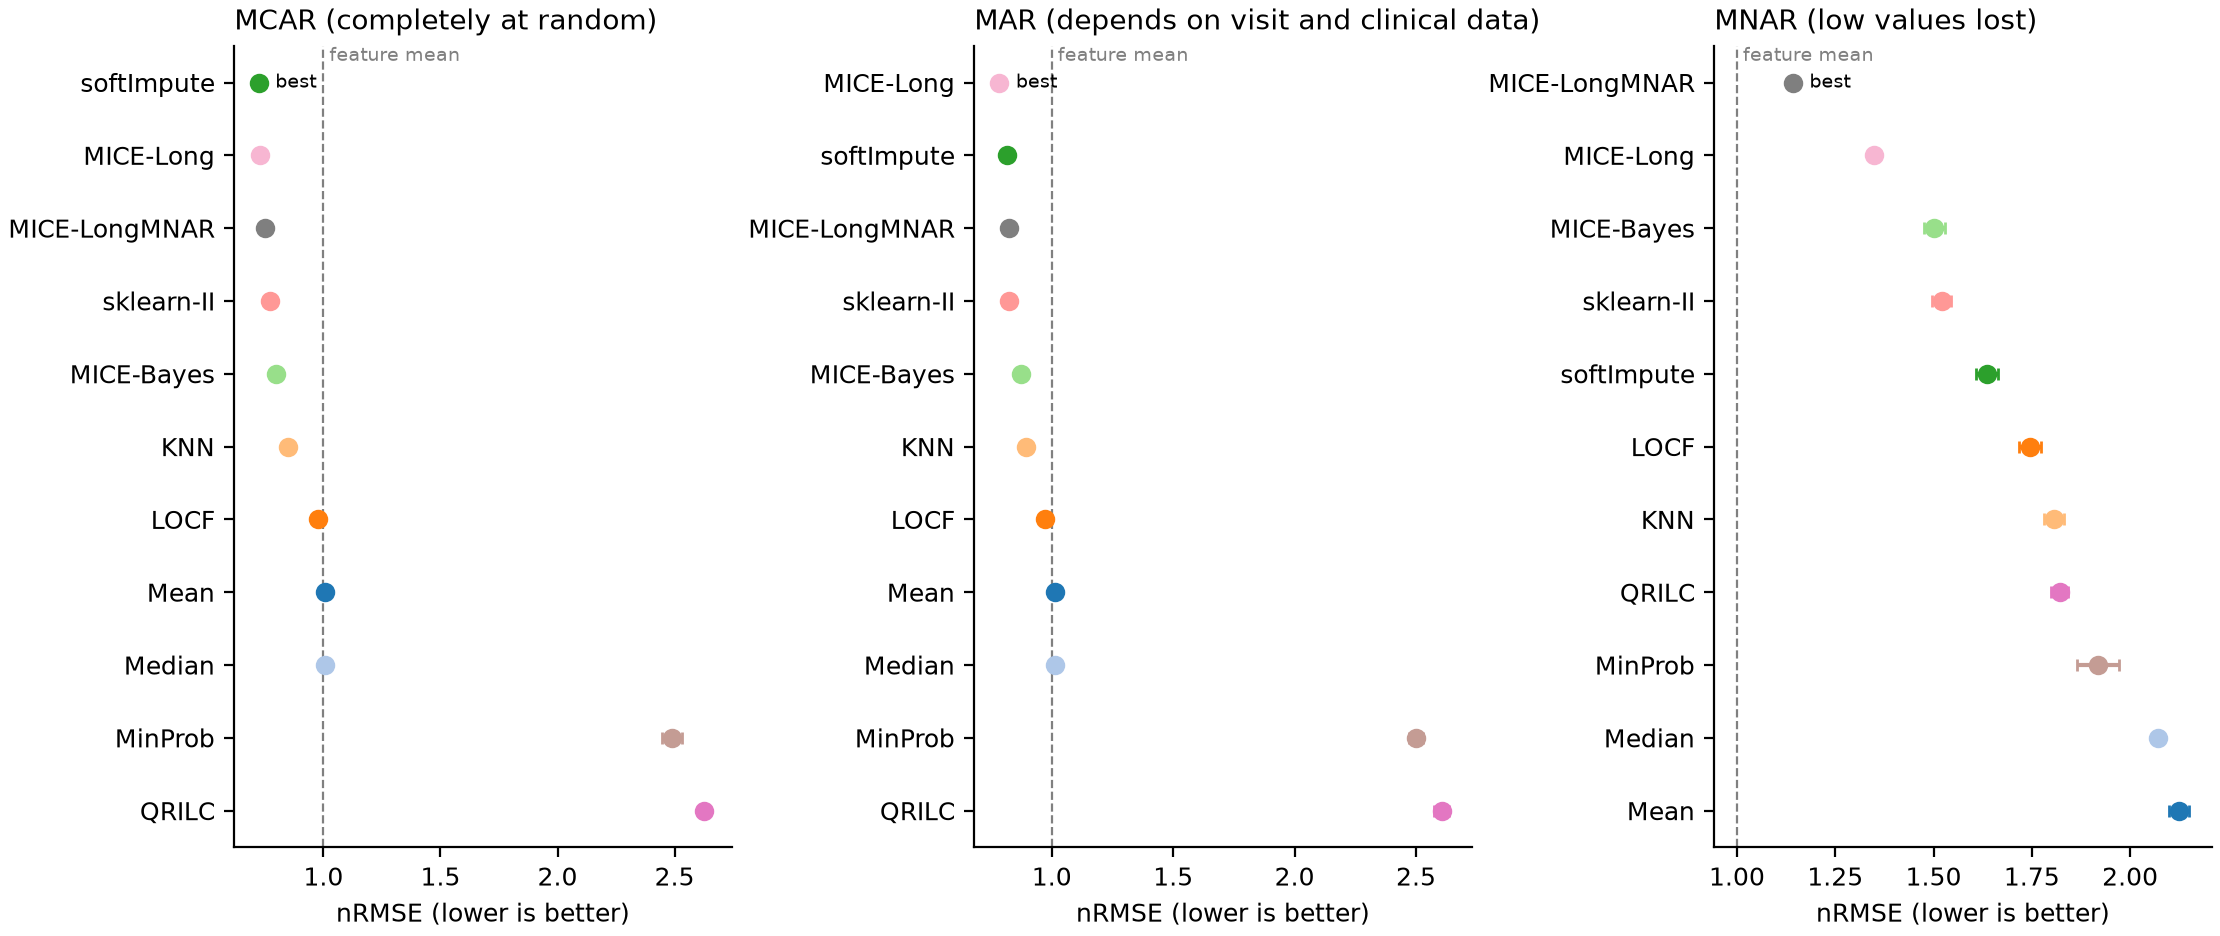
- hides 20% of the values you do have, under three assumptions about why values go missing (completely at random, depending on visit and clinical data, or because they are low), repeats this three times, and asks every method to fill them in;
- scores each method against the hidden true values (nRMSE within each feature; 1.00 = filling in the feature's mean), with Monte Carlo standard errors, the share of features where the method beats the mean, whether each patient's visit-to-visit variation is kept, and, for multiple imputation, whether the 95% intervals are honest;
- fills in your real missing values with the best method (and gives m completed tables from the best multiple-imputation method);
- runs an exploratory survival screen when the table has a survival time and an event column;
- writes everything into one folder, with an HTML report that explains each result in plain language.
Install
pip install mipy-impute
Python 3.9 or newer, on Windows, macOS or Linux. Optional extras add methods:
pip install "mipy-impute[ml]"        # miceforest (LightGBM)
pip install "mipy-impute[automl]"    # HyperImpute and GAIN (needs PyTorch)
pip install "mipy-impute[bigdata]"   # polars and DuckDB for very large tables
Methods whose package is missing are skipped with a message that says what to install; nothing fails.
Try it in one minute
import mipy

df = mipy.example_cohort()             # synthetic cohort laid out like GSE65622
res = mipy.analyze(df, out="example_results", methods="quick", repeats=1)
res.show()                             # tables and figures; inline in Jupyter
Or from a terminal (Command Prompt, PowerShell, or a shell):
mipy example example.csv
mipy analyze example.csv --methods quick --repeats 1 --open
Your own data
One row per patient visit, like this (any column names work):
| Patient_ID | sampling_point | EN-RAGE | GDF-15 | ... | RFS | event | trg_score |
|---|---|---|---|---|---|---|---|
| 1 | 1 | 59.08 | 1203.4 | ... | 2727 | 0 | 4 |
| 1 | 2 | 52.19 | ... | 2697 | 0 | 4 | |
| 2 | 1 | 980.1 | ... | 1579 | 1 | 2 |
- an ID column and a visit column (optional, but needed by the longitudinal methods),
- many numeric feature columns with empty cells where values are missing
(
NA,n/a,<LOD,NDand similar entries are read as missing), - optional clinical columns (few distinct values: stage, grade, batch),
- optional survival columns (a time and a 0/1 event).
CSV, Excel, TSV and Parquet files work, and so do pandas DataFrames. Check how MIPY reads a file before running anything:
mipy check my_data.csv
If a column is detected wrongly, say which is which:
res = mipy.analyze("my_data.xlsx", id_col="Patient_ID", time_col="sampling_point",
                   features="EN-RAGE:Prot_496",            # a range of columns, or a list
                   clinical=["trg_score", "ypn_stage"], survival=("RFS", "event"),
                   out="my_results")
More in docs/your_data.md.
What you get
my_results/
  report.html            all results, figures embedded, with explanations
  figures/               fig01_missingness ... fig09_survival  (PNG and PDF)
  tables/                accuracy_summary.csv, decision.csv, ... and mipy_results.xlsx
  completed_data/        completed_<best method>.csv and completed_<MI method>_draw1..5.csv
  run_log.txt            every step, warnings and error details
| Figure | Shows |
|---|---|
| missingness | where values are missing, and whether low-level features miss more often |
| masking | which values each masking design hid |
| accuracy | nRMSE of every method under every mechanism, with Monte Carlo intervals |
| nrmse_per_feature | the spread of the error across features |
| sd_ratio | whether each patient's visit-to-visit variation is kept |
| coverage | calibration of multiple imputation (95% intervals) |
| runtime | seconds per run |
| imputed_vs_observed | your real missing values as filled in, against the observed values |
| survival | exploratory Cox screen (when survival columns exist) |
In Python, res holds the same results: res.summary, res.decision,
res.completed (filled in with res.completed_method), res.completed_draws
(from res.mi_method), res.survival, res.tables, res.figures,
res.warnings; res.open_report() opens the report in your browser.
New in 2.2.0
Added for the revised MIPY paper: a longitudinal missing-at-random design, the ablation of MICE-Long, and multiple imputation judged on an analysis estimand.
import mipy
from mipy.masking import Amputer

prep = mipy.prepare_data(mipy.example_cohort())
X, patient, time = prep.X, prep.patient, prep.time

# MAR-L: loss at a visit depends on the same feature at the patient's previous visit
amp = Amputer(X, time=time, rate=0.2, patient=patient).ampute("MARL", 1)

# MICE-Long, and its ablation variants (one component added or removed)
print(sorted(mipy.imputers.ABLATION))
ctx = mipy.ImputeContext(patient=patient, time=time, m=5)
completed, draws = mipy.imputers.run("MICE-Long", amp["X"], ctx)

# multiple imputation judged on each feature's within-patient change (first to last visit)
tab = mipy.mi.change_estimand(X, draws, amp["mask"], patient, time)
print(mipy.mi.summarise_change(tab))
The GSE65622 analysis files can be built from GEO's public series matrix
(download GSE65622_series_matrix.txt.gz from
GEO):
from mipy.datasets import build_gse65622
tables = build_gse65622("GSE65622_series_matrix.txt.gz", out="data")   # writes RFS_data.csv, MFS_data.csv
The established longitudinal methods of the paper (jomo, two-fold FCS) run in
R through mipy.rbridge.write_long_inputs and run_r_long; see
CHANGELOG.md.
Choosing methods
methods= |
Methods | Time on 288 visits x 507 proteins, 9 maskings* |
|---|---|---|
"quick" |
Mean, LOCF, KNN, softImpute, MinProb, QRILC, MICE-Long | about 5 min |
"standard" (default) |
quick + Median, MICE-Bayes, sklearn-II, MICE-LongMNAR | 10 to 20 min |
"complete" |
standard + missForest, miceforest, HyperImpute, GAIN | 2 h or more |
"all" |
complete + the multiple-imputation versions and the exact imputeLCMD variants | longer |
*one process on a 2-core machine; the example cohort takes about 3 minutes
with "standard". n_workers="auto" runs several methods at once, and runs
already finished are reused if you stop and start again.
| Method | Family | Multiple imputation | Uses patients | Peer-reviewed description |
|---|---|---|---|---|
| Mean, Median | naive | no | no | no |
| LOCF | longitudinal rule | no | yes | no |
| KNN | neighbour | no | no | yes (Troyanskaya et al. 2001) |
| softImpute | low-rank | no | no | yes (Mazumder et al. 2010) |
| MICE-Bayes | chained equations | yes | no | adapted (van Buuren & Groothuis-Oudshoorn 2011) |
| missForest | chained equations | no | no | adapted (Stekhoven & Buhlmann 2012) |
| sklearn-II | chained equations | no | no | no (scikit-learn IterativeImputer) |
| miceforest | chained equations | no | no | no |
| HyperImpute | AutoML | no | no | yes (Jarrett et al. 2022) |
| GAIN | generative | no | no | yes (Yoon et al. 2018) |
| MinProb, QRILC | left-censored | no | no | adapted (Lazar et al. 2016) |
| MICE-Long | longitudinal chained | yes | yes | new in MIPY |
| MICE-LongMNAR | selection-model MNAR | yes | yes | new in MIPY |
| softImpute-MI, missForest-MI, miceforest-MI | MI versions | yes | no | new in MIPY |
Adapted: a published method changed in engine, stopping rule or unit of
application. MICE-Bayes uses Bayesian ridge in place of mice's least squares,
missForest uses extremely randomised trees and five fixed sweeps in place of
the stopping rule, and MinProb and QRILC work per protein rather than per
sample. The exact imputeLCMD versions are MinProb-R and QRILC-R.
- MICE-Long: chained equations that use each patient's previous visit, next visit and own mean, with a patient-level bootstrap (proper multiple imputation).
- MICE-LongMNAR: the same with selection-model draws for values lost
below a detection limit;
settings={"gamma": ...}sets the sensitivity parameter. - softImpute, missForest, mice's
norm.bootand imputeLCMD's MinProb and QRILC are implemented in Python and checked against the R packages (identical parameters; cell-level agreement r > 0.99 for softImpute).
Lower-level functions
done  = mipy.impute(df, method="softImpute", id_col="Patient_ID", time_col="sampling_point", log2=True)
draws = mipy.impute(df, method="MICE-Long", id_col="Patient_ID", time_col="sampling_point", m=5, log2=True)
bench = mipy.benchmark(df, methods=["Mean", "softImpute", "MICE-Long"], id_col="Patient_ID",
                       time_col="sampling_point", log2=True, mechanisms=("MCAR", "MNAR"), repeats=3)

from mipy.mi import pool_estimates      # Rubin's rules over the m completions
pooled = pool_estimates(estimates, by="term")   # columns: draw, term, beta, se
mipy.list_methods() lists every method with the function it calls and its
evidence; mipy.literature() lists 14 Python imputation packages and the
publication behind each.
Reproducing the MIPY paper
notebooks/MIPY_v2_pipeline.ipynb runs the full GSE65622 analysis of the
paper (all methods, multiple imputation, MNAR sensitivity with logistic and
probit designs, agreement with R, data handling up to a million patients, a
synthetic second cohort and, since 2.2.0, the MAR-L design, the ablation of
MICE-Long, the established longitudinal methods in R and the within-patient
change estimand) and writes every number, table and figure. The result files
of the revision analyses (30 October 2026) are in
paper/output_revision_2026-10-30.
The GSE65622 analysis files are not in the repository; the pipeline builds
them from GEO's series matrix when it finds that file in its data folder.
Tests
pip install "mipy-impute[all,test]"
pytest
Citation
See CITATION.cff.
If you use MIPY, please cite the MIPY paper and the publication of each method
you report (mipy.list_methods() gives the reference key).
Licence
MIT
1 maintainer

Metadata
1 maintainer
Release files for mipy-impute 2.2.0
For a detailed explanation of source distributions (sdists) and built distributions (wheels), please see the package formats documentation.
Source distribution (sdist)
| File | Size | Uploaded | Provenance | Actions |
|---|---|---|---|---|
| mipy_impute-2.2.0.tar.gz | 509.5 kB | Without provenance | Details for mipy_impute-2.2.0.tar.gz |
Built distribution (wheel)
| File | Interpreter | ABI | Platform | Actions Reset |
|---|---|---|---|---|
| mipy_impute-2.2.0-py3-none-any.whl | Python 3 | none | any | Details for mipy_impute-2.2.0-py3-none-any.whl |
Total release size: 611.1 kB
Release files / mipy_impute-2.2.0.tar.gz
| Download URL | mipy_impute-2.2.0.tar.gz |
|---|---|
| Size | 509.5 kB |
| Tags | Source |
|
SHA-256 checksum How to use checksums |
7c5448f876e5f9b4732b436a9f409642ac7dcf36f534b16c9921139897ed6b02
|
|
BLAKE2b-256 checksum How to use checksums |
f7193be1dfc912f88cf7872a1e4a9793b7fbdd38834007f746b9303a60b6f325
|
| Upload date | |
|
Uploaded using Trusted Publishing? What is trusted publishing? |
No |
| Uploaded via |
twine/7.0.0 CPython/3.11.16
|
Release files / mipy_impute-2.2.0-py3-none-any.whl
| Download URL | mipy_impute-2.2.0-py3-none-any.whl |
|---|---|
| Size | 101.6 kB |
| Tags | Python 3 |
|
SHA-256 checksum How to use checksums |
7d7ee384ff1fe39e50a8e5a85a679c58a6ceb717e784a797638dae9c4c015cbc
|
|
BLAKE2b-256 checksum How to use checksums |
ebd4409c50de75d42f10528b377bf974ff0105f17ac515d02f15b4af8d949b2d
|
| Upload date | |
|
Uploaded using Trusted Publishing? What is trusted publishing? |
No |
| Uploaded via |
twine/7.0.0 CPython/3.11.16
|
Security for mipy-impute 2.2.0
Provenance
Provenance describes where a file came from. On PyPI, provenance is shared via attestations, which provide a verifiable record of the build or publishing details. View details, limitations and caveats.
No provenance found
None of the files in this release were uploaded with provenance metadata.
A note on package security
PyPI is a repository for distributing packages, not a service for auditing them. While third-party security researchers and our staff do their best to detect and remove malicious packages, PyPI cannot guarantee the quality, security or suitability of any given package.
To learn more about protecting yourself from malicious actors, visit our package security documentation.














