PyQtGraph-based backend for MNE-Python's raw data browser

Project description
MNE Qt Browser
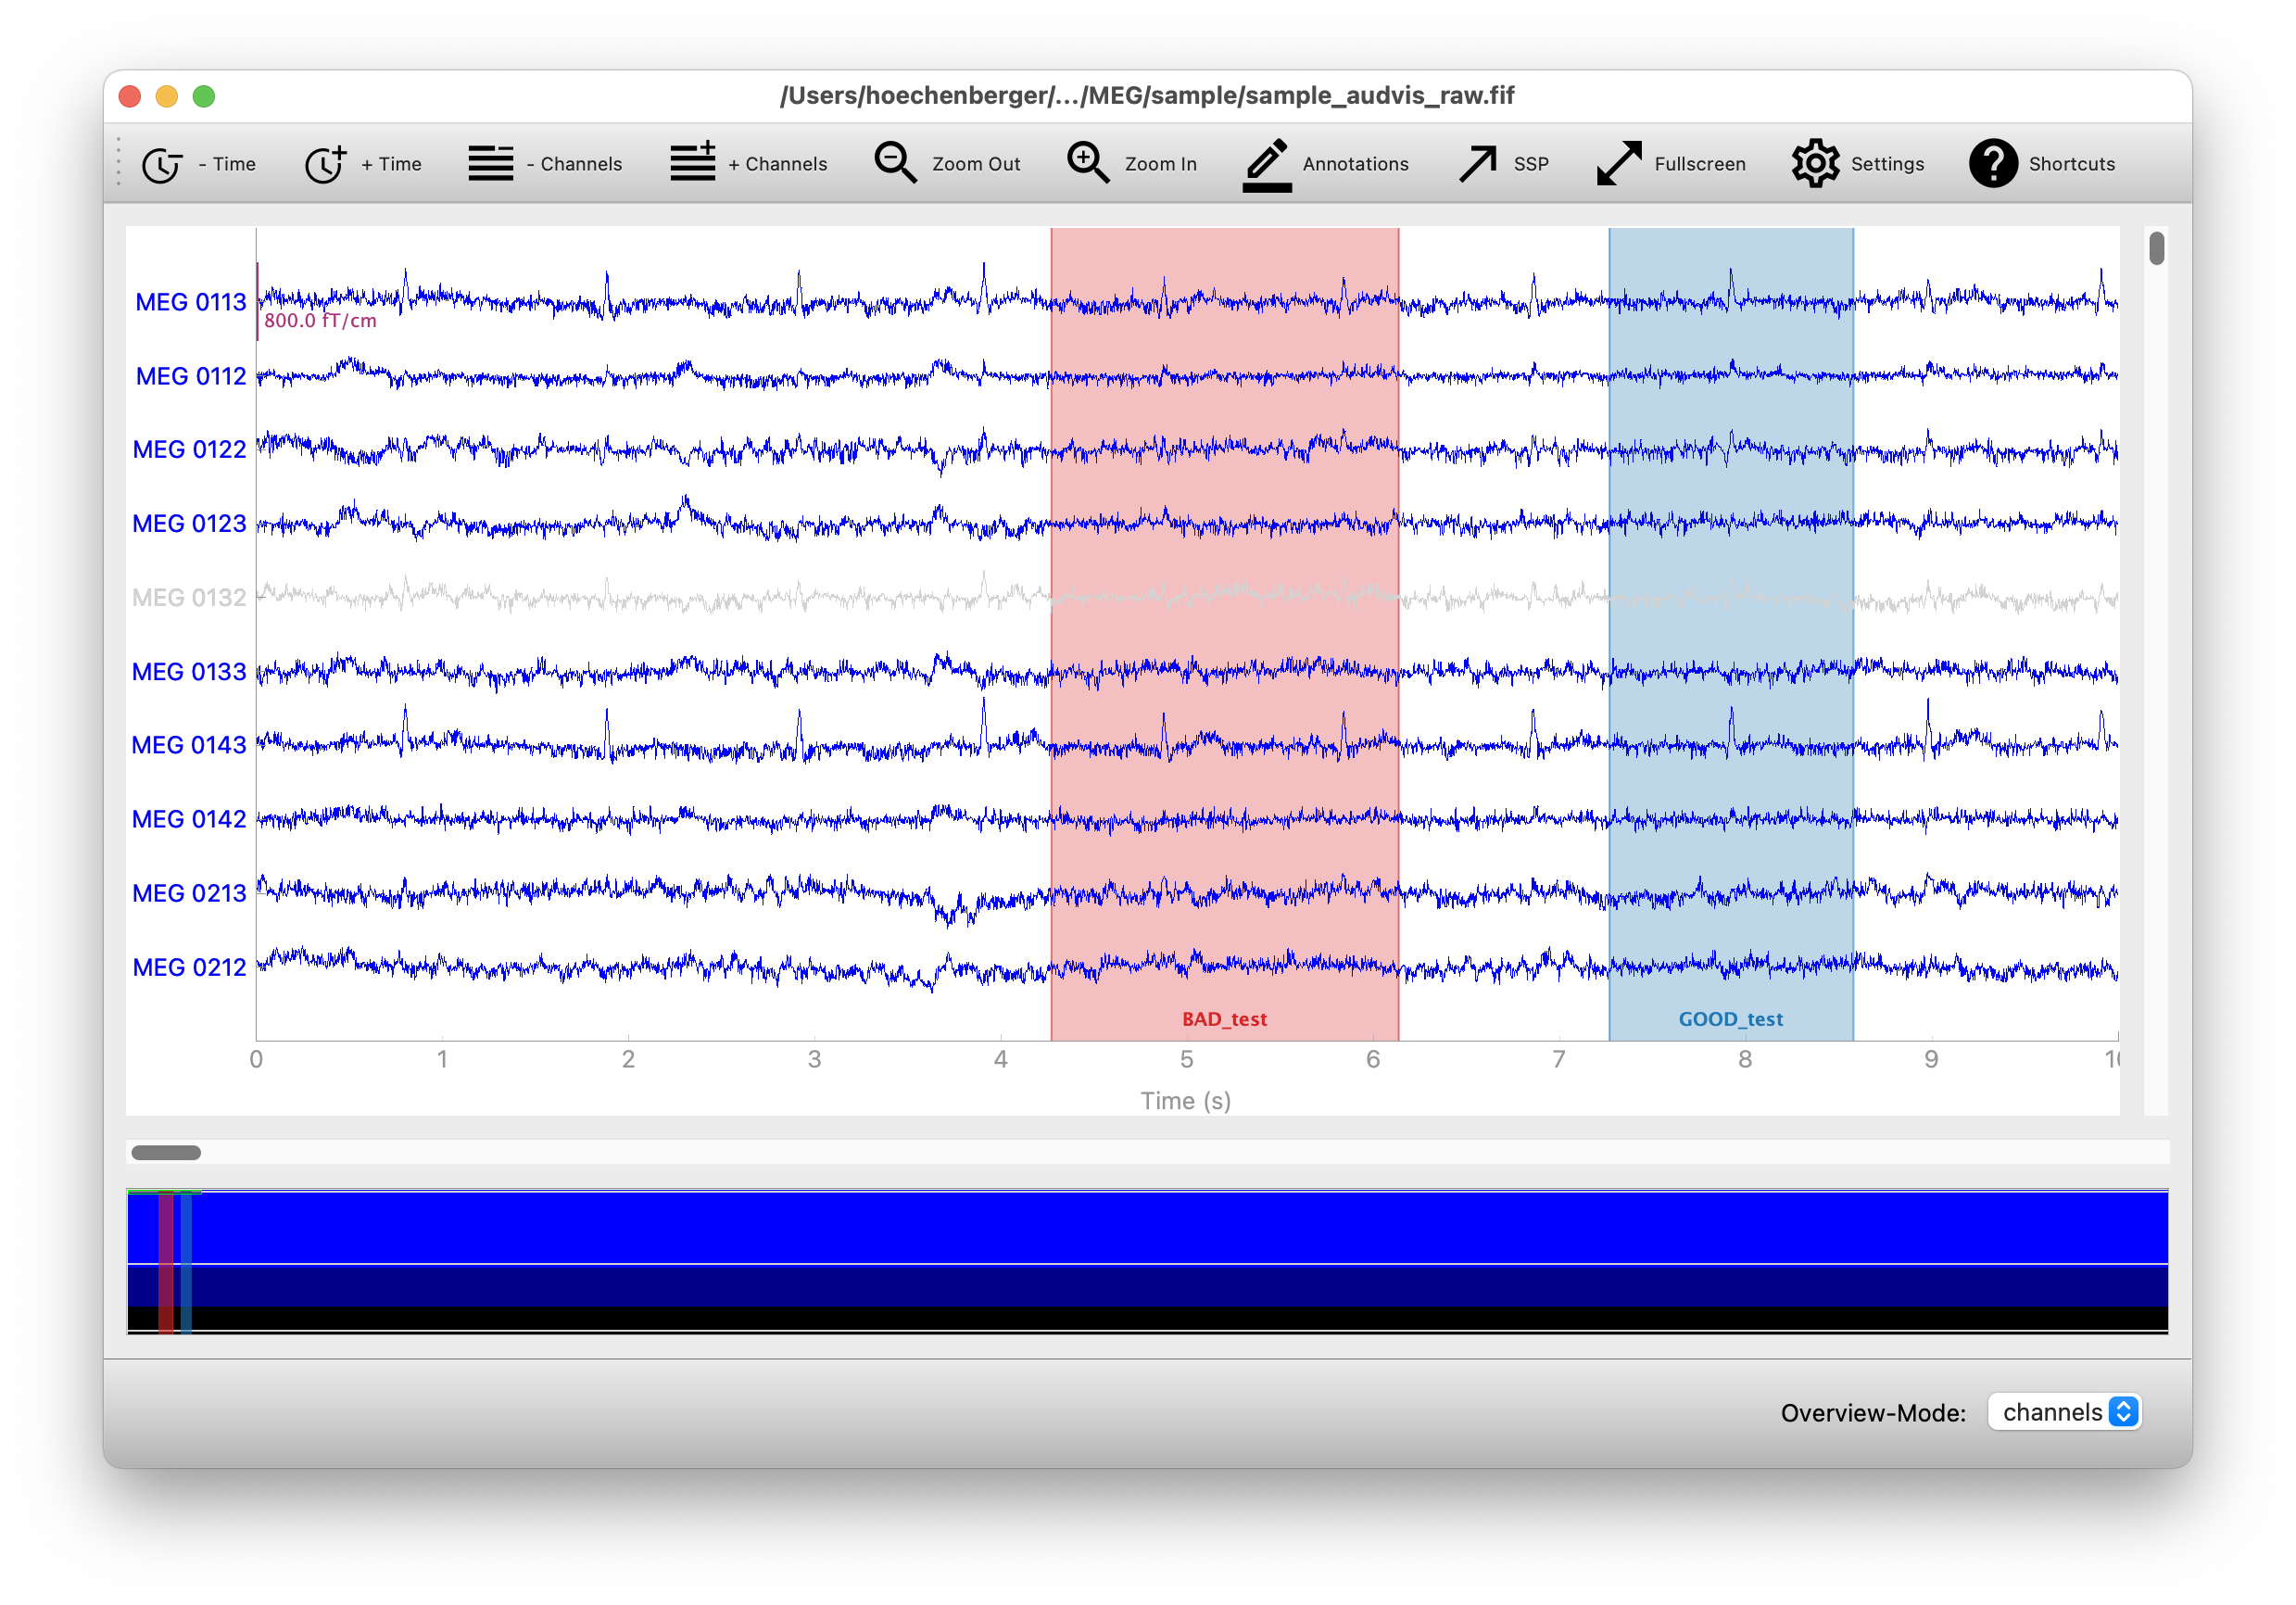
MNE Qt Browser is an alternative backend for plotting multichannel time series data (such as EEG or MEG) with MNE-Python. The backend is based on PyQtGraph, which in turn uses Qt under the hood.
Installation
MNE Qt Browser is not a standalone package—it requires MNE-Python to be installed. The easiest way to use it is by installing MNE-Python through the official installers, which include the browser by default.
The browser is also supported by MNELAB, a graphical user interface for MNE-Python. The recommended way to install MNELAB is via the official installers as well. In this case, MNE Qt Browser will be installed automatically—you just need to enable it in the settings by selecting Qt as the plot backend.
If you already have the mne package installed in your Python environment, you can also install mne-qt-browser separately (e.g., using pip, uv, or conda).
Usage
The backend supports plotting for the following MNE-Python methods:
mne.io.Raw.plot()mne.Epochs.plot()mne.preprocessing.ICA.plot_sources(raw)mne.preprocessing.ICA.plot_sources(epochs)
The following example demonstrates how to read and plot the MNE sample dataset:
import mne

raw = mne.io.read_raw(
    mne.datasets.sample.data_path() / "MEG" / "sample" / "sample_audvis_raw.fif"
)

raw.plot(block=True)
If the plot does not appear, check the troubleshooting section below for possible solutions.
MNE ≥ 1.0.0 will automatically use the Qt backend for plotting if it is available. If you want to set the backend explicitly, you can do so by calling:
mne.viz.set_browser_backend("qt") # or "matplotlib"
You can set the backend to "qt" or "matplotlib". If you want to make this setting permanent, you can modify your MNE configuration file by running:
mne.set_config("MNE_BROWSER_BACKEND", "qt") # or "matplotlib"
Troubleshooting
Running from a script
If you run a script containing raw.plot() as follows, the plot will close immediately after the script finishes:
python example_script.py
To keep the plot open, you can either use blocking mode:
raw.plot(block=True)
Alternatively, you can run the script in interactive mode:
python -i example_script.py
IPython
When using an interactive IPython console, calling raw.plot() in non-blocking mode may cause the plot window to freeze or become unresponsive. This happens because IPython must be configured to run the Qt event loop to handle plot interactions.
To fix this, you can either use blocking mode, which runs its own event loop:
raw.plot(block=True)
Alternatively, enable Qt event loop integration in your IPython session by running the following magic command before you plot:
%gui qt
Development and testing
You can run the included benchmarks locally with:
pytest -m benchmark mne_qt_browser
To run the PyQtGraph tests, use:
pytest mne_qt_browser/tests/test_pg_specific.py
You can also run additional tests from the MNE-Python repository. The following command assumes that you have cloned the MNE-Python repository in the parent directory of this repository:
pytest -m pgtest ../mne-python/mne/viz/tests
These tests require PyOpenGL to be installed. If OpenGL is not available on your system, you may encounter errors. To suppress these, add the following line to mne/conftest.py after the existing error:: line:
ignore:.*PyOpenGL was not found.*:RuntimeWarning
Project details
Release history Release notifications | RSS feed


Download files
Download the file for your platform. If you're not sure which to choose, learn more about installing packages.
Source Distribution
Built Distribution
Filter files by name, interpreter, ABI, and platform.
If you're not sure about the file name format, learn more about wheel file names.
Copy a direct link to the current filters
File details
Details for the file mne_qt_browser-0.7.5.tar.gz.
File metadata
- Download URL: mne_qt_browser-0.7.5.tar.gz
- Upload date:
- Size: 60.2 kB
- Tags: Source
- Uploaded using Trusted Publishing? No
- Uploaded via: twine/6.1.0 CPython/3.13.12
File hashes
| Algorithm | Hash digest | |
|---|---|---|
| SHA256 |
2a7fcf892f9fa31b8a678f600d946dc3090d2c1576aa3643851f0c97d98dd269
|
|
| MD5 |
d196f248a4fa72b0ee1a961e1949c4b2
|
|
| BLAKE2b-256 |
47fa9ce7fc78ce7393b7d4844e48310673adc40326b6002c06049241ec8f0701
|
File details
Details for the file mne_qt_browser-0.7.5-py3-none-any.whl.
File metadata
- Download URL: mne_qt_browser-0.7.5-py3-none-any.whl
- Upload date:
- Size: 76.9 kB
- Tags: Python 3
- Uploaded using Trusted Publishing? No
- Uploaded via: twine/6.1.0 CPython/3.13.12
File hashes
| Algorithm | Hash digest | |
|---|---|---|
| SHA256 |
c4919c4d4f7547c951d389d76aac3a3dd110edb30706705b68eadb7bf8c6d4b2
|
|
| MD5 |
df28e23f39e0af9ddbf5f182a461e531
|
|
| BLAKE2b-256 |
c7379cafc6698fbd084fd84469b01dfc68bac1f05ecb61427515aa257007c63c
|


