

Welcome to modelsight
Better insights into Machine Learning models performance.
Modelsight is a collection of functions that create publication-ready graphics for the visual evaluation of cross-validated binary classifiers adhering to the scikit-learn interface.
While the majority of modelsight functionalities are compatible with any binary classifier that follows scikit-learn's interface, it's worth noting that, as of now, some features are exclusive to ExplainableBoostingClassifier from the interpretml package.
| Overview | |
|---|---|
| Open Source |  |
| CI/CD |    |
| Code |   |
💫 Features
Our objective is to enhance the visual assessment of cross-validated binary classifiers by introducing a set of functions tailored for generating publication-ready plots.
To effectively utilize modelsight, you should provide a dictionary where the keys represent model names, and the values consist of CVModellingOutput objects. CVModellingOutput is a custom data class designed to encapsulate the results of a cross-validation process for a specific binary classifier. For detailed information about CVModellingOutput, please refer to the API reference.
Before using the functionalities offered by this library, ensure that your cross-validation data adheres to this structure.
| Module | Status | Links |
|---|---|---|
| Calibration | maturing | Tutorial · API Reference |
| Curves | maturing | Tutorial · API Reference |
👓 Install modelsight
- Operating system: macOS X · Linux
- Python version: 3.10 (only 64-bit)
- Package managers: pip
pip
Using pip, modelsight releases are available as source packages and binary wheels. You can see all available wheels here.
$ pip install modelsight
⚡ Quickstart
The following code will cross-validate five different binary classifiers and produce a dictionary of CVModellingOutput.
import numpy as np
import pandas as pd
import matplotlib.pyplot as plt
from sklearn.datasets import load_breast_cancer
from sklearn.model_selection import train_test_split
from sklearn.model_selection import StratifiedKFold, RepeatedStratifiedKFold
from sklearn.metrics import roc_curve
from sklearn.svm import SVC
from sklearn.ensemble import RandomForestClassifier
from sklearn.neighbors import KNeighborsClassifier
from sklearn.linear_model import LogisticRegression
from interpret.glassbox import ExplainableBoostingClassifier

from tests.utils import (
    select_features,
    get_feature_selector,
    get_calibrated_model
)

from modelsight._typing import CVModellingOutput, Estimator

# Load data
X, y = load_breast_cancer(return_X_y=True, as_frame=True)

# Define factory for binary classifiers
class BinaryModelFactory:
    def get_model(self, model_name: str) -> Estimator:
        if model_name == "EBM":
            return ExplainableBoostingClassifier(random_state=cv_config.get("SEED"),
                                        interactions=6,
                                        learning_rate=0.02,
                                        min_samples_leaf=5,
                                        n_jobs=-1)
        elif model_name == "LR":
            return LogisticRegression(penalty="elasticnet",
                                 solver="saga",
                                 l1_ratio=0.3,
                                 max_iter=10000,
                                 random_state=cv_config.get("SEED"))
        elif model_name == "SVC":
            return SVC(probability=True,
                   class_weight="balanced",
                   random_state=cv_config.get("SEED"))
        elif model_name == "RF":
            return RandomForestClassifier(random_state=cv_config.get("SEED"),
                                     n_estimators=5,
                                     max_depth=3,
                                     n_jobs=-1)
        elif model_name == "KNN":
            return KNeighborsClassifier(n_jobs=-1)
        else:
            raise ValueError(f"{model_name} is not a valid estimator name.")

cv_config = {
    "N_REPEATS": 2,
    "N_SPLITS": 10,
    "SHUFFLE": True,
    "SCALE": False,
    "CALIBRATE": True,
    "CALIB_FRACTION": 0.15,
    "SEED": 1303
}

# define outer and inner cross-validation schemes
outer_cv = RepeatedStratifiedKFold(n_repeats=cv_config.get("N_REPEATS"),
                                   n_splits=cv_config.get("N_SPLITS"),
                                   random_state=cv_config.get("SEED"))

inner_cv = StratifiedKFold(n_splits=cv_config.get("N_SPLITS"),
                           shuffle=cv_config.get("SHUFFLE"),
                           random_state=cv_config.get("SEED"))

# define models names, factory and cv results dictionary
models_names = ["EBM", "LR", "SVC", "RF", "KNN"]
model_factory = BinaryModelFactory()
cv_results = dict()

for model_name in models_names:
    print(f"Processing model {model_name}\n")

    gts_train = []
    gts_val = []
    probas_train = []
    probas_val = []
    gts_train_conc = []
    gts_val_conc = []
    probas_train_conc = []
    probas_val_conc = []

    models = []
    errors = []
    correct = []
    features = []

    for i, (train_idx, val_idx) in enumerate(outer_cv.split(X, y)):
        Xtemp, ytemp = X.iloc[train_idx, :], y.iloc[train_idx]
        Xval, yval = X.iloc[val_idx, :], y.iloc[val_idx]

        if cv_config.get("CALIBRATE"):
            Xtrain, Xcal, ytrain, ycal = train_test_split(Xtemp, ytemp,
                                                          test_size=cv_config.get(
                                                              "CALIB_FRACTION"),
                                                          stratify=ytemp,
                                                          random_state=cv_config.get("SEED"))
        else:
            Xtrain, ytrain = Xtemp, ytemp

        model = model_factory.get_model(model_name)

        # select features
        feat_subset = select_features(Xtrain, ytrain,
                                      selector=get_feature_selector(
                                          cv_config.get("SEED")),
                                      cv=inner_cv,
                                      scale=False,
                                      frac=1.25)
        features.append(feat_subset)

        if cv_config.get("SCALE"):
            numeric_cols = Xtrain.select_dtypes(
                include=[np.float64, np.int64]).columns.tolist()
            scaler = StandardScaler()
            Xtrain.loc[:, numeric_cols] = scaler.fit_transform(
                Xtrain.loc[:, numeric_cols])
            Xtest.loc[:, numeric_cols] = scaler.transform(
                Xtest.loc[:, numeric_cols])

        model.fit(Xtrain.loc[:, feat_subset], ytrain)

        if cv_config.get("CALIBRATE"):
            model = get_calibrated_model(model,
                                         X=Xcal.loc[:, feat_subset],
                                         y=ycal)

        models.append(model)

        # accumulate ground-truths
        gts_train.append(ytrain)
        gts_val.append(yval)

        # accumulate predictions
        train_pred_probas = model.predict_proba(Xtrain.loc[:, feat_subset])[:, 1]
        val_pred_probas = model.predict_proba(Xval.loc[:, feat_subset])[:, 1]

        probas_train.append(train_pred_probas)
        probas_val.append(val_pred_probas)

        # identify correct and erroneous predictions according to the
        # classification cut-off that maximizes the Youden's J index
        fpr, tpr, thresholds = roc_curve(ytrain, train_pred_probas)
        idx = np.argmax(tpr - fpr)
        youden = thresholds[idx]

        labels_val = np.where(val_pred_probas >= youden, 1, 0)

        # indexes of validation instances misclassified by the model
        error_idxs = Xval[(yval != labels_val)].index
        errors.append(error_idxs)

        # indexes of correct predictions
        correct.append(Xval[(yval == labels_val)].index)

    # CV results for current model
    curr_est_results = CVModellingOutput(
        gts_train=gts_train,
        gts_val=gts_val,
        probas_train=probas_train,
        probas_val=probas_val,
        gts_train_conc=np.concatenate(gts_train),
        gts_val_conc=np.concatenate(gts_val),
        probas_train_conc=np.concatenate(probas_train),
        probas_val_conc=np.concatenate(probas_val),
        models=models,
        errors=errors,
        correct=correct,
        features=features
    )

    cv_results[model_name] = curr_est_results
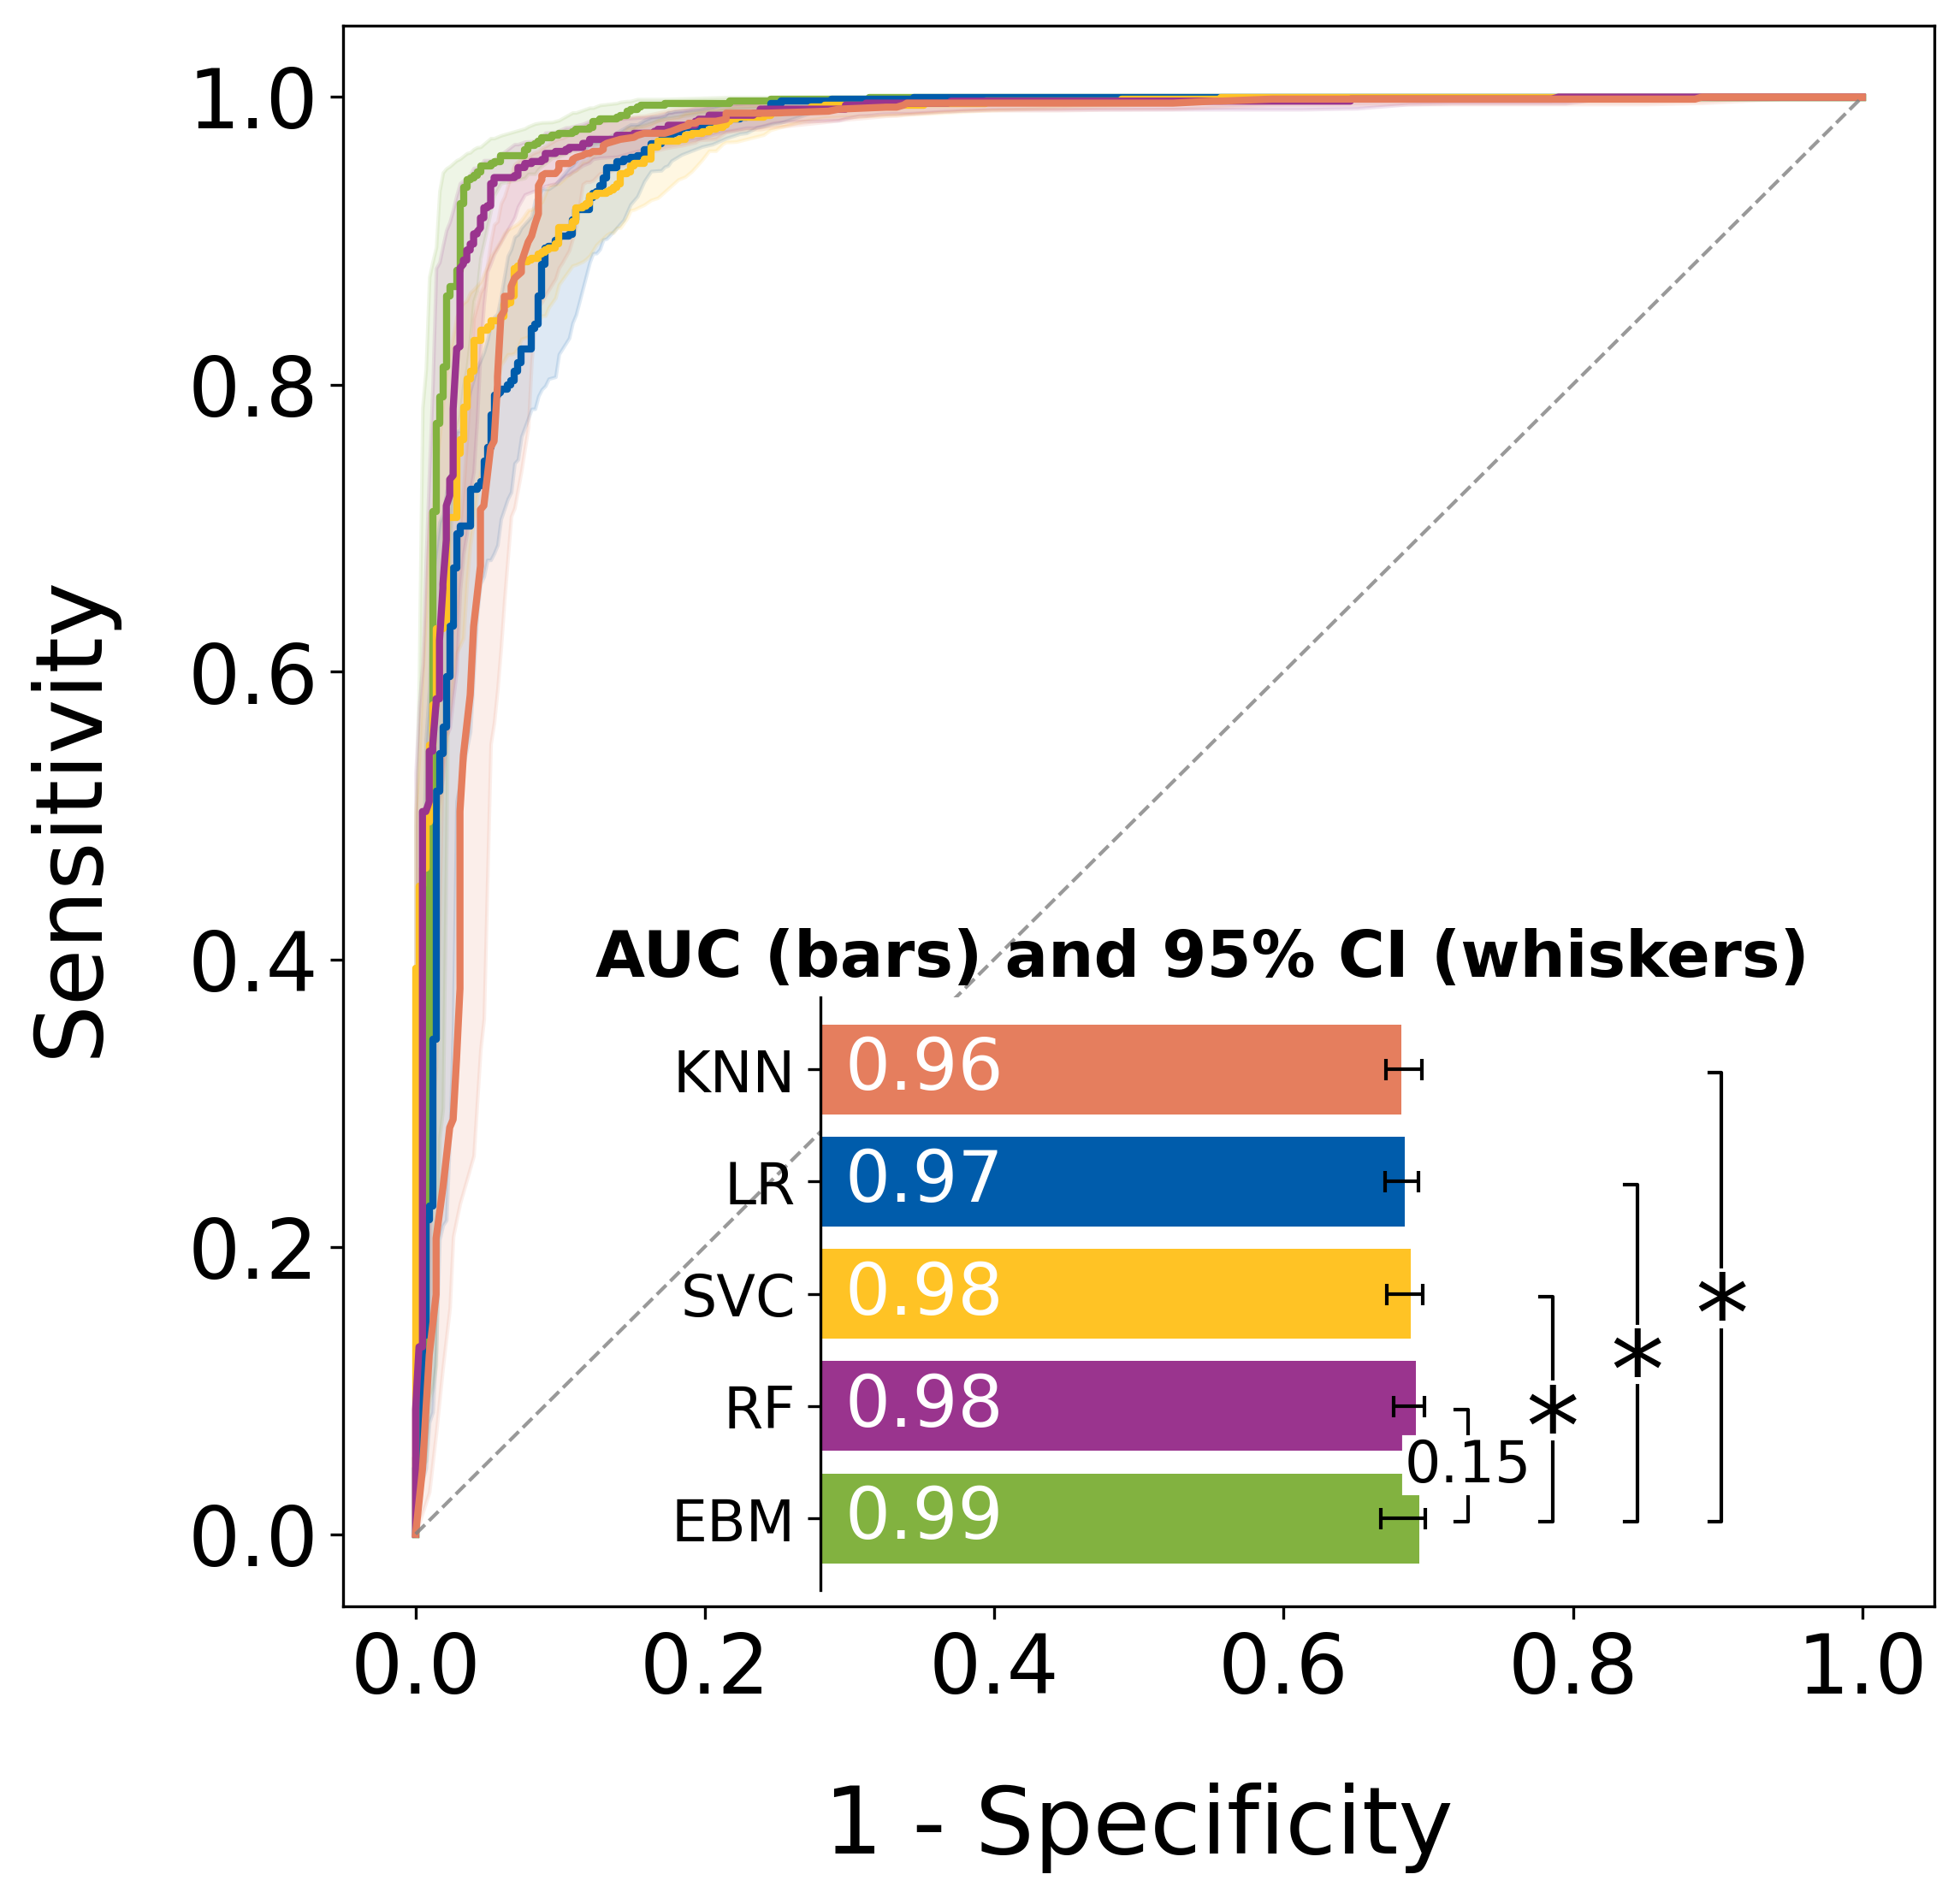
Plot the average receiver-operating characteristic (ROC) curves
from modelsight.curves import (
    average_roc_curves,
    roc_comparisons,
    add_annotations
)

model_names = list(cv_results.keys())
alpha = 0.05
alph_str = str(alpha).split(".")[1]
alpha_formatted = f".{alph_str}"
roc_symbol = "*"
palette = [Colors.green2, Colors.blue, Colors.yellow, Colors.violet, Colors.darksalmon]
n_boot = 100

f, ax = plt.subplots(1, 1, figsize=(8, 8))

kwargs = dict()

f, ax, barplot, bars, all_data = average_roc_curves(cv_results,
                                                    colors=palette,
                                                    model_keys=model_names,
                                                    show_ci=True,
                                                    n_boot=n_boot,
                                                    bars_pos=[
                                                        0.3, 0.01, 0.6, 0.075*len(model_names)],
                                                    random_state=cv_config.get("SEED"),
                                                    ax=ax,
                                                    **kwargs)

roc_comparisons_results = roc_comparisons(cv_results, "EBM")

kwargs = dict(space_between_whiskers = 0.07)
order = [
    ("EBM", "RF"),
    ("EBM", "SVC"),
    ("EBM", "LR"),
    ("EBM", "KNN")
]
ax_annot = add_annotations(roc_comparisons_results,
                  alpha = 0.05,
                  bars=bars,
                  direction = "vertical",
                  order = order,
                  symbol = roc_symbol,
                  symbol_fontsize = 30,
                  voffset = -0.05,
                  ext_voffset=0,
                  ext_hoffset=0,
                  ax=barplot,
                  **kwargs)
This produces the following plot:
Assess calibration of the ExplaianbleBoostingClassifier across
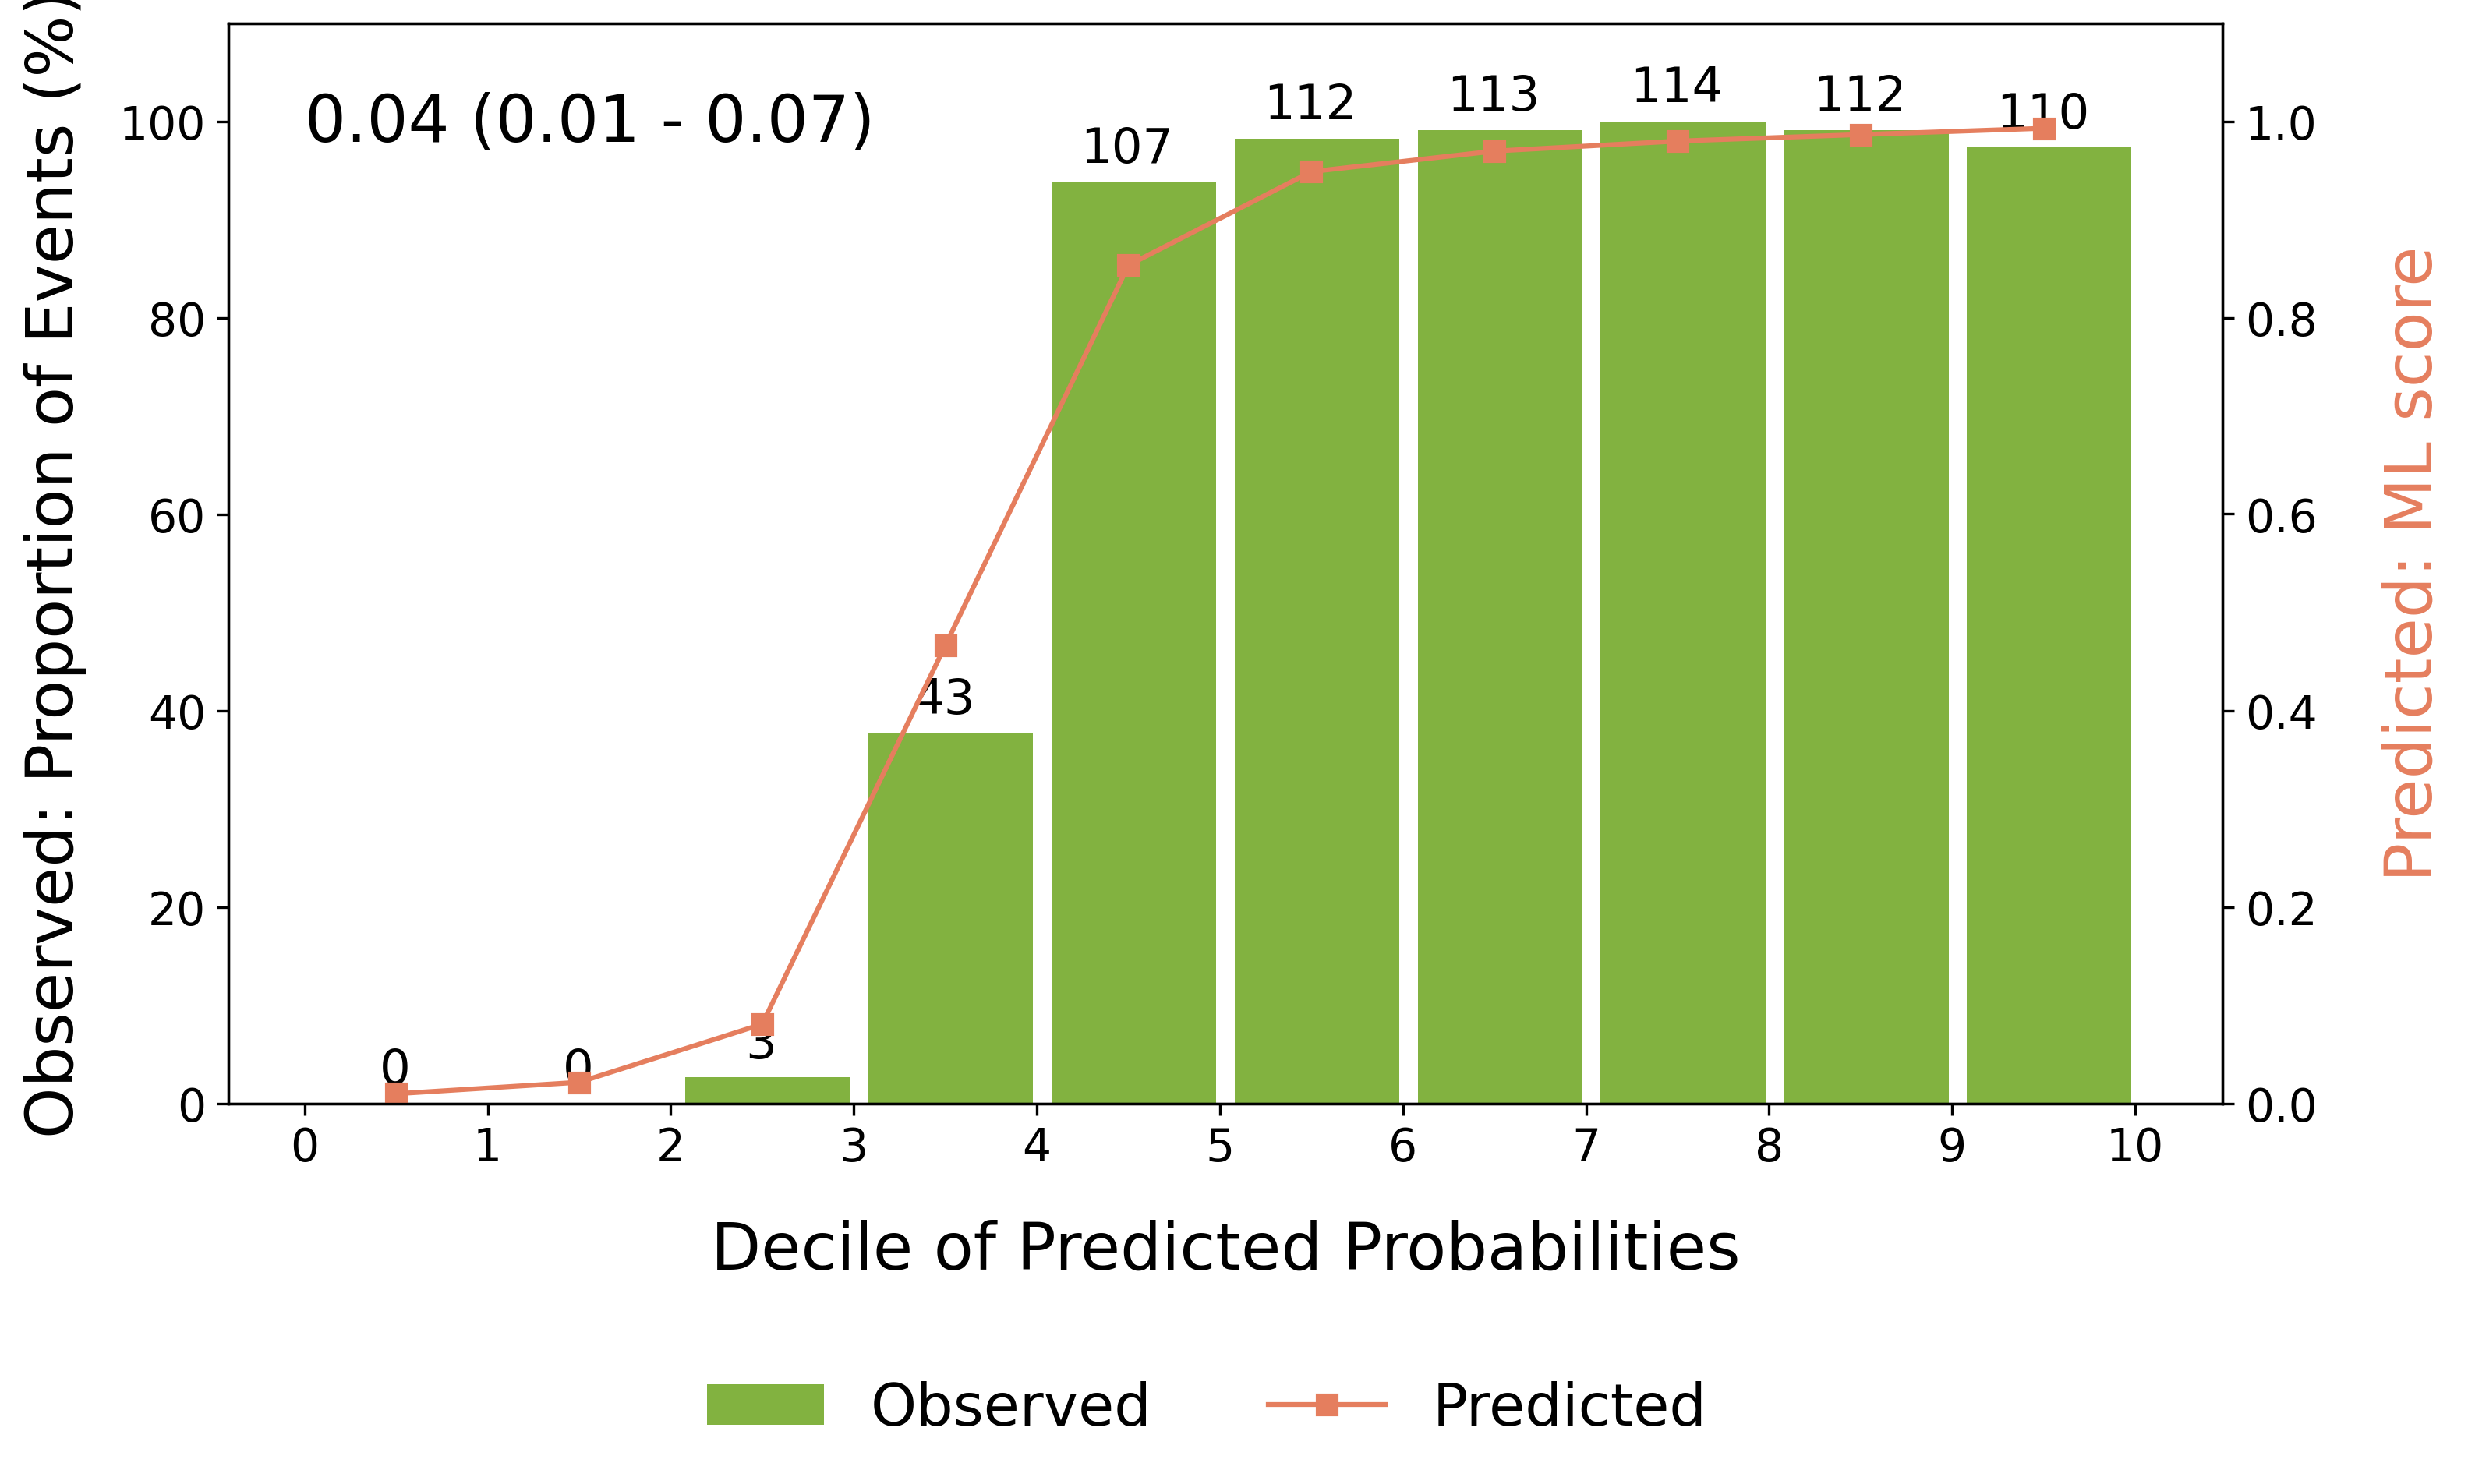
We will now compute median Brier score (95% CI) of the ExplainableBoostingClassifier and use it to annotate the calibration plot.
from sklearn.metrics import brier_score_loss
from modelsight.calibration import hosmer_lemeshow_plot

briers = []
for gt, preds in zip(cv_results["EBM"].gts_val, cv_results["EBM"].probas_val):
    brier = brier_score_loss(gt, preds)
    briers.append(brier)

brier_low, brier_med, brier_up = np.percentile(briers, [2.5, 50, 97.5])

brier_annot = f"{brier_med:.2f} ({brier_low:.2f} - {brier_up:.2f})"

f, ax = plt.subplots(1, 1, figsize=(11,6))

f, ax = hosmer_lemeshow_plot(cv_results["EBM"].gts_val_conc,
                             cv_results["EBM"].probas_val_conc,
                             n_bins=10,
                             colors=(Colors.darksalmon, Colors.green2),
                             annotate_bars=True,
                             title="",
                             brier_score_annot=brier_annot,
                             ax=ax
                             )
This produces the following plot:
💝 Contributing
Interested in contributing? Check out the contributing guidelines. Please note that this project is released with a Code of Conduct. By contributing to this project, you agree to abide by its terms.
🛣️ Roadmap
Features:
- Calibration module to assess calibration of ML predicted probabilities via Hosmer-Lemeshow plot
- Average Receiver-operating characteristic curves
- Average Precision-recall curves
- Feature importance (Global explanation)
- Individualized explanations (Local explanation)
1 maintainer

Metadata
1 maintainer
Release files for modelsight 0.4.0
For a detailed explanation of source distributions (sdists) and built distributions (wheels), please see the package formats documentation.
Source distribution (sdist)
| File | Size | Uploaded | |
|---|---|---|---|
| modelsight-0.4.0.tar.gz | 32.6 kB | Details |
Built distribution (wheel)
| File | Interpreter | ABI | Platform | Reset |
|---|---|---|---|---|
| modelsight-0.4.0-py3-none-any.whl | Python 3 | none | any | Details |
Total release size: 64.2 kB
Release files / modelsight-0.4.0.tar.gz
| Download URL | modelsight-0.4.0.tar.gz |
|---|---|
| Size | 32.6 kB |
| Tags | Source |
|
SHA-256 checksum How to use checksums |
74291321db584e7a0aefb196b3e43bc093a8d6ebe2af8c30f8b7b0e7d55a8b52
|
|
BLAKE2b-256 checksum How to use checksums |
cea8d9a3246147dcc284384a80920a235c82292635e60c2b214f3dbf12a36286
|
| Upload date | |
|
Uploaded using Trusted Publishing? What is trusted publishing? |
No |
| Uploaded via |
poetry/1.6.1 CPython/3.10.11 Darwin/22.5.0
|
Release files / modelsight-0.4.0-py3-none-any.whl
| Download URL | modelsight-0.4.0-py3-none-any.whl |
|---|---|
| Size | 31.5 kB |
| Tags | Python 3 |
|
SHA-256 checksum How to use checksums |
9fe534f0f5cca40d98c5ae6970b0d7f59f470494e12d21ff813dd6459dbe3d61
|
|
BLAKE2b-256 checksum How to use checksums |
e6d9c2e502e8b6b64c860d078b5ae9391f199d3bc3e53f30eba01ded56e655b3
|
| Upload date | |
|
Uploaded using Trusted Publishing? What is trusted publishing? |
No |
| Uploaded via |
poetry/1.6.1 CPython/3.10.11 Darwin/22.5.0
|














