interactive marker support for matplotlib
Project description
mpl-markers
Interactive data markers for line plots in matplotlib
Installation
pip install mpl-markers
Usage
import mpl_markers as mplm
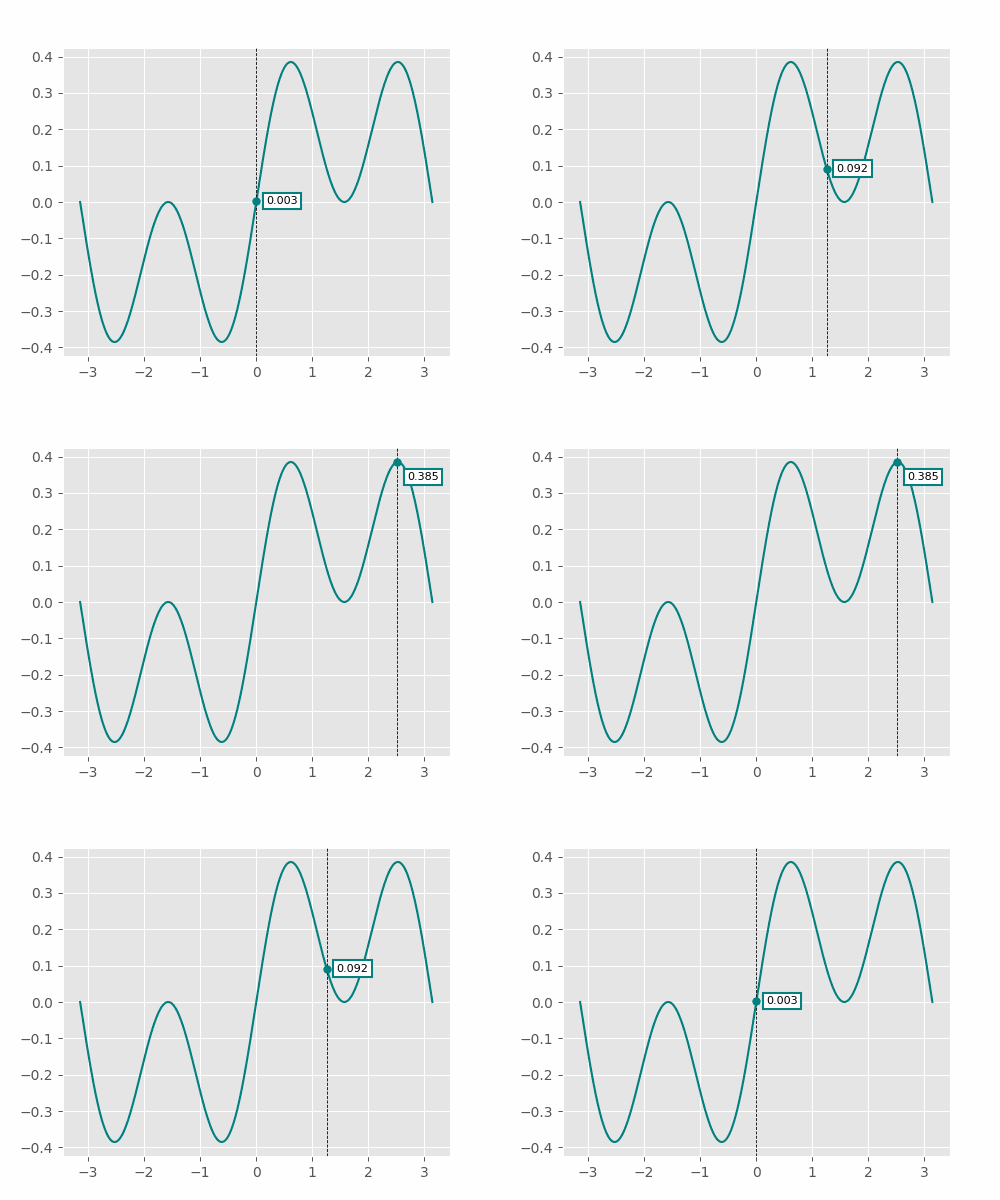
Add a marker attached to plotted data lines:
import numpy as np
import matplotlib.pyplot as plt

plt.style.use('ggplot')
plt.rc('font', size=7)

fig, ax = plt.subplots(1,1)
x1 = np.linspace(-2*np.pi, 2*np.pi, 1000)

ax.plot(x1, np.sin(x1)*np.cos(x1)**2)

mplm.data_marker(x=0)
Add an axis marker that moves freely on the canvas:
ax.xaxis.set_major_formatter(lambda x, pos: '{:.2f}$\pi$'.format(x/np.pi))
mplm.axis_marker(x=0, y=-0.2)
License
mpl-markers is licensed under the MIT License.
Project details
Release history Release notifications | RSS feed
Download files
Download the file for your platform. If you're not sure which to choose, learn more about installing packages.
Source Distribution
mpl-markers-0.0.2.tar.gz
(17.5 kB
view details)
Built Distribution
File details
Details for the file mpl-markers-0.0.2.tar.gz.
File metadata
- Download URL: mpl-markers-0.0.2.tar.gz
- Upload date:
- Size: 17.5 kB
- Tags: Source
- Uploaded using Trusted Publishing? No
- Uploaded via: twine/4.0.2 CPython/3.9.1
File hashes
| Algorithm | Hash digest | |
|---|---|---|
| SHA256 |
6eb2efa7765097239519c74a74fa1de2cf85054c2e0bf546c2fd180b06b12728
|
|
| MD5 |
c046b8ef1cfc86c051e3072529c6b0e7
|
|
| BLAKE2b-256 |
b5120bc6f5ed49fb347133f877c60cefe0c544209d3468e9f3bcffc9252abf29
|
File details
Details for the file mpl_markers-0.0.2-py3-none-any.whl.
File metadata
- Download URL: mpl_markers-0.0.2-py3-none-any.whl
- Upload date:
- Size: 16.9 kB
- Tags: Python 3
- Uploaded using Trusted Publishing? No
- Uploaded via: twine/4.0.2 CPython/3.9.1
File hashes
| Algorithm | Hash digest | |
|---|---|---|
| SHA256 |
85830a607b6fb8bc31ce45a33f657216515e12a6a4a5b08c972d9ca508f0bf92
|
|
| MD5 |
66317d1e6b785d4d6e5833ad171792ad
|
|
| BLAKE2b-256 |
04f639ada37ca7550fdcb69b9b0ac4b5416669491a847a1e92bc4d6e27d1ae70
|


