
mpl_wrap




Matplotlib helper functions for plotting wrapped, angular, or periodic data: angles, phases, times of day, longitudes, and anything else that repeats or rotates.
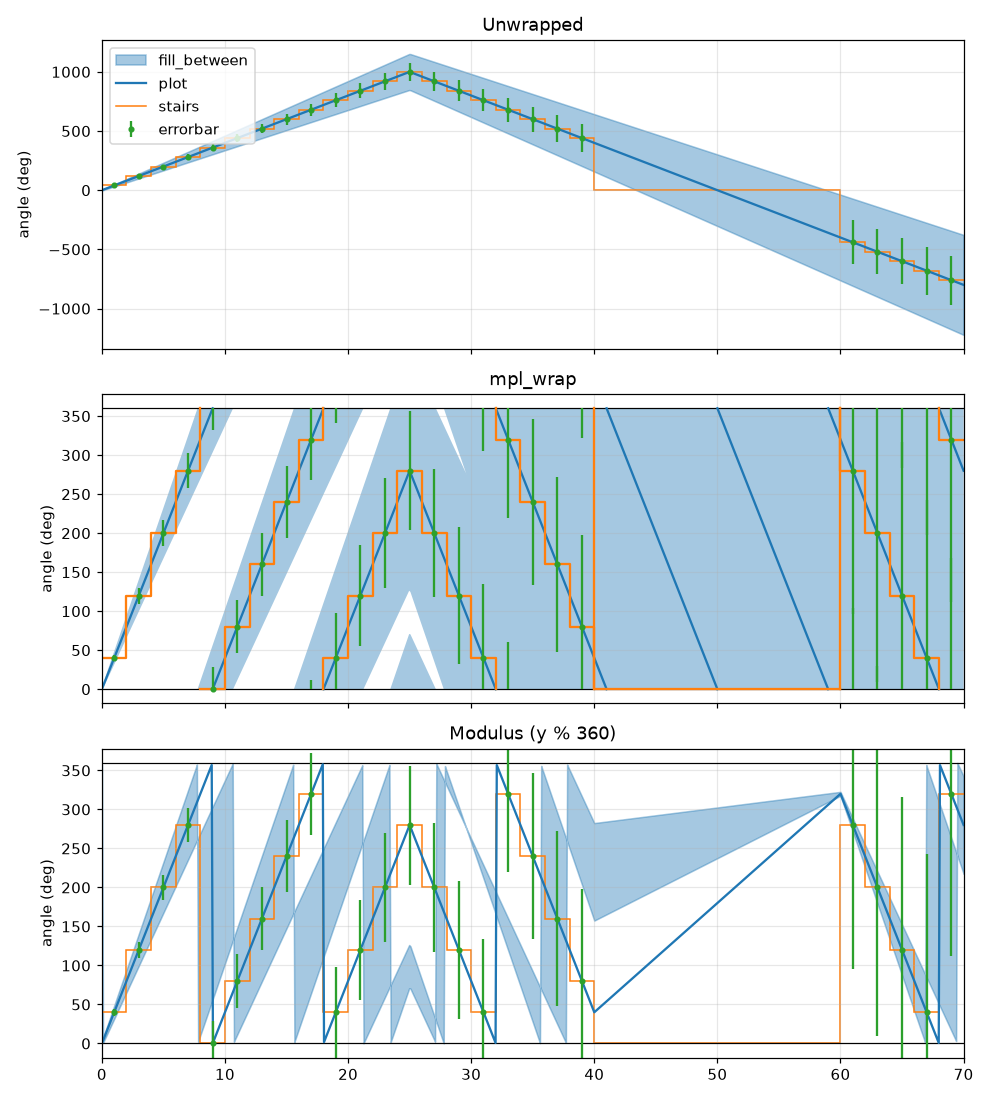
Manually plotting this data can be tricky. Using a modulus such as y % 360 is simple,
but introduces a few problems:
- Line jumps at the crossing points, and lines that stop short of the wrap boundaries at the crossing points
- Aliasing when data spans multiple crossings, obscuring the real underlying behavior
- Completely broken rendering for fill_between
mpl_wrap solves these issues, and provides simple functions to make plotting wrapped
data easy.
Installation
pip install mpl_wrap
Or install from source:
git clone https://github.com/scottshambaugh/mpl_wrap.git
cd mpl_wrap
uv sync --group dev
Basic Usage
import numpy as np
import matplotlib.pyplot as plt
from mpl_wrap import set_wrap, plot_wrapped, fill_between_wrapped, errorbar_wrapped

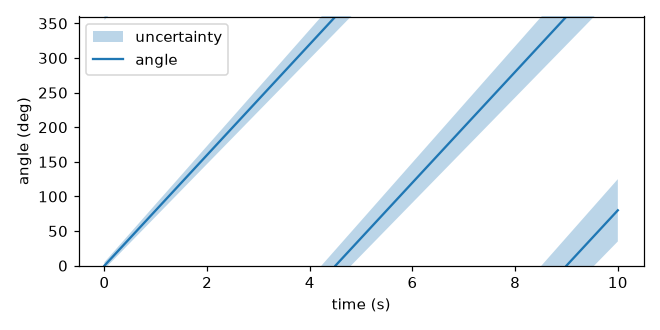
t = np.linspace(0, 10, 500)
angle = 80.0 * t  # degrees
width = 5.0 + 4.0 * t  # degrees

fig, ax = plt.subplots()
set_wrap(ax, wrapy=(0, 360))  # helpers on ax now wrap y into (0, 360)
fill_between_wrapped(ax, t, angle - width, angle + width, alpha=0.3, label='uncertainty')
plot_wrapped(ax, t, angle, label='angle')
ax.set(xlabel="time (s)", ylabel="angle (deg)")
ax.legend()
The helpers mirror their matplotlib counterparts, taking the target Axes as
the first argument plus optional wrapx / wrapy (min, max) windows:
| mpl_wrap | mirrors |
|---|---|
plot_wrapped(ax, x, y, ...) |
ax.plot |
scatter_wrapped(ax, x, y, ...) |
ax.scatter |
hlines_wrapped(ax, y, xmin, xmax) |
ax.hlines |
vlines_wrapped(ax, x, ymin, ymax) |
ax.vlines |
axhspan_wrapped(ax, ymin, ymax) |
ax.axhspan |
axvspan_wrapped(ax, xmin, xmax) |
ax.axvspan |
fill_between_wrapped(ax, x, y1, y2) |
ax.fill_between |
fill_betweenx_wrapped(ax, y, x1, x2) |
ax.fill_betweenx |
step_wrapped(ax, x, y, where=...) |
ax.step |
stairs_wrapped(ax, values, edges) |
ax.stairs |
errorbar_wrapped(ax, x, y, yerr, xerr) |
ax.errorbar |
Plus fill_around(ax, x, y, width), a corridor of constant width around a track.
It needs shapely (pip install mpl_wrap[geo]).
Each returns the same artist type as the method it mirrors, in the same Axes
container. The two span helpers return a list of Rectangle, since a band
across the seam is two rectangles.
Passing wrapx=False / wrapy=False disables wrapping for a single call (or
clears the stored window when passed to set_wrap), and wrapx=True /
wrapy=True requires the stored window.
set_wrap also sets the axis limits to the window by default, and ticks the
window evenly so that ticks land exactly on the window edges, at about the
automatic tick density. Opt out with set_lims=False / edge_ticks=False,
or pass seam_lines=True to mark the window edges with lines.
You must pass the original unwrapped data for these to work.
If your data is already wrapped, np.unwrap may be able to recover that if it's sampled at a high enough rate.
API
The helpers are free functions, and are also available as methods on an
AxesWrap axes. These three are equivalent:
from mpl_wrap import set_wrap, plot_wrapped, wrap_axes

# 1. Free functions, on any existing axes
fig, ax = plt.subplots()
set_wrap(ax, wrapy=(0, 360))
plot_wrapped(ax, t, angle)

# 2. Methods on an AxesWrap axes, created with the "wrap" projection
fig, ax = plt.subplots(subplot_kw={"projection": "wrap"})
ax.set_wrap(wrapy=(0, 360))
ax.plot_wrapped(t, angle)

# 3. Methods on an existing axes, upgraded in place from Axes to AxesWrap
fig, ax = plt.subplots()
wrap_axes(ax, wrapy=(0, 360))
ax.plot_wrapped(t, angle)
The data processing is also exposed on its own: wrap_line and wrap_points
take data plus windows and return the wrapped arrays without plotting anything
(also available as AxesWrap methods). wrap_line(..., return_samples=True)
also returns where each input sample landed in the output, for putting markers
or colours back on the data points after the seam routing inserts vertices.
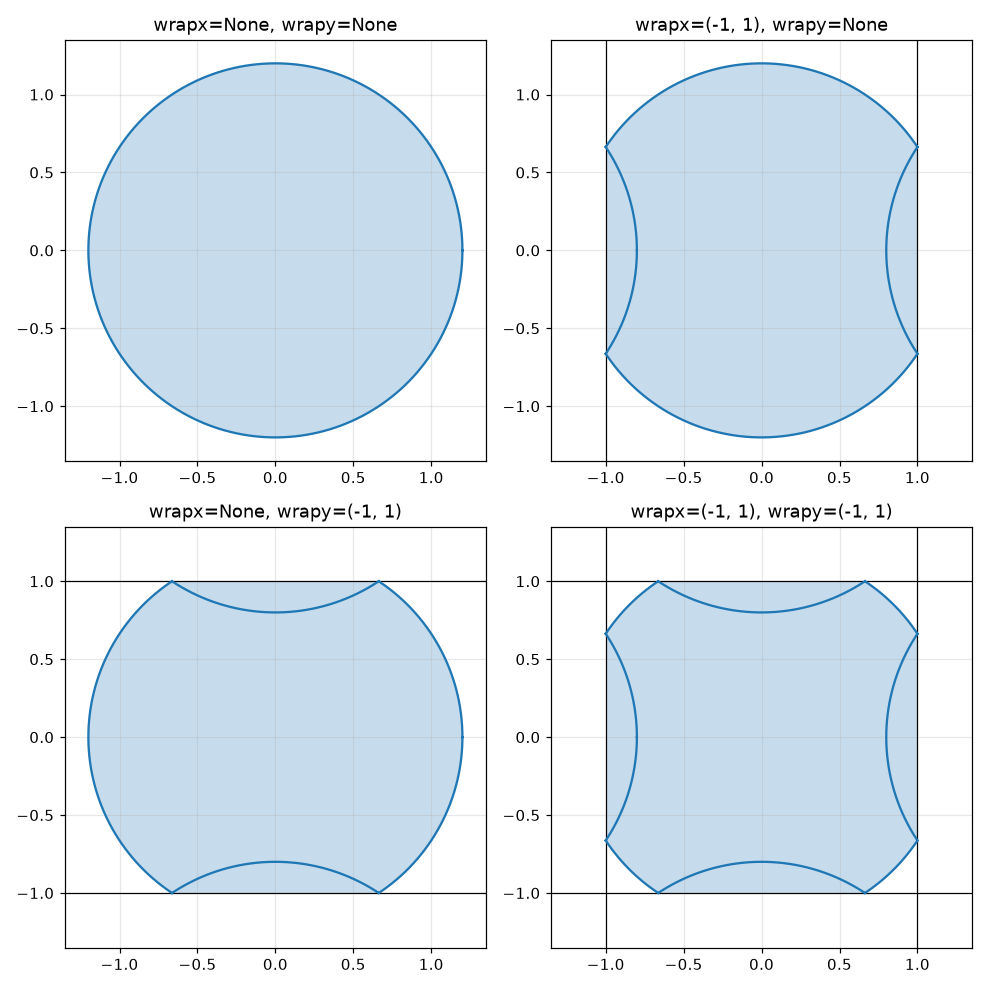
Wrapping x, y, or both
Both axes can be wrapped independently or together:
Datetime data
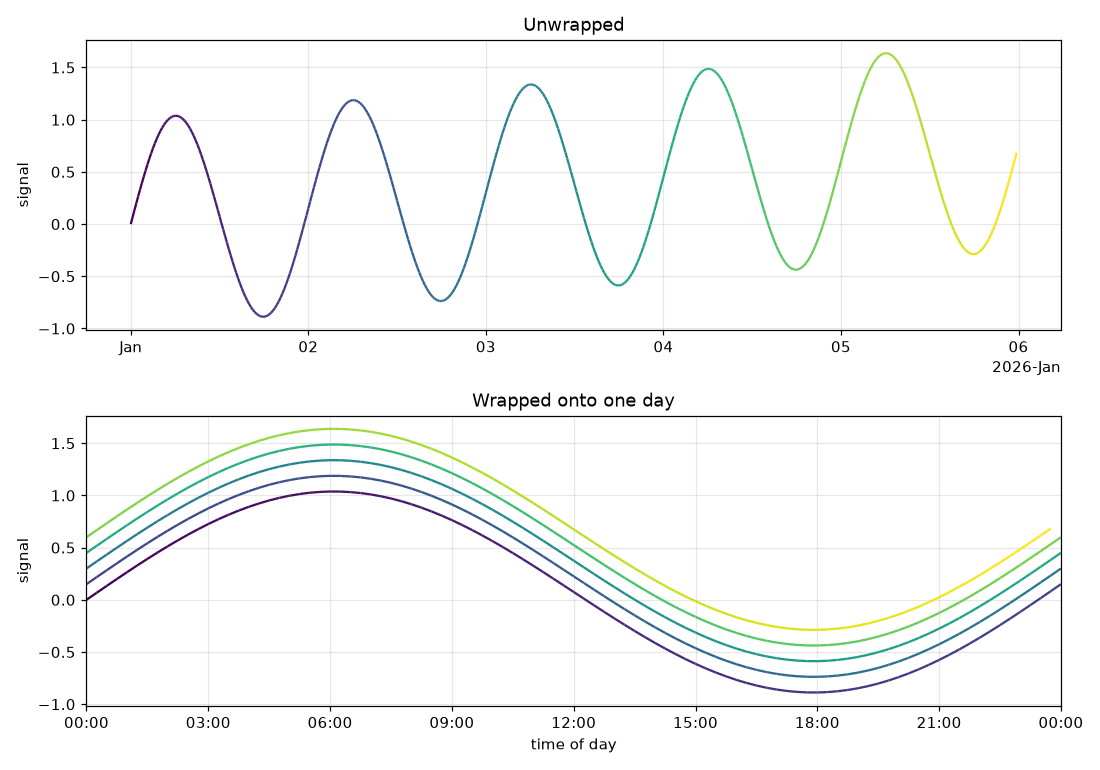
Datetime data and windows work on either axis. Here a five-day series is wrapped to show a time-of-day view:
set_wrap(ax, wrapx=(t0, t0 + np.timedelta64(1, "D")))
plot_wrapped(ax, times, signal)
Geographic data (longitude and latitude)
When wrapping around a globe, latitude is not periodic. A track that runs past the north pole comes back down the opposite side of the Earth, 180 deg away in longitude.
With geographic=True, mpl_wrap folds latitude at the poles and wraps longitude
at the antimeridian. On a cartopy GeoAxes this is on by default, but it works with
normal axes as well.
import cartopy.crs as ccrs
from mpl_wrap import fill_around, plot_wrapped, scatter_wrapped

x = np.linspace(0, 720, 400)
lon = -160 + 0.3 * x
lat = x

fig, ax = plt.subplots(subplot_kw={"projection": ccrs.Robinson()})
ax.set_global()
ax.coastlines()

fill_around(ax, lon, lat, 5, alpha=0.3)  # 5 deg either side
plot_wrapped(ax, lon, lat)
scatter_wrapped(ax, lon[::40], lat[::40])
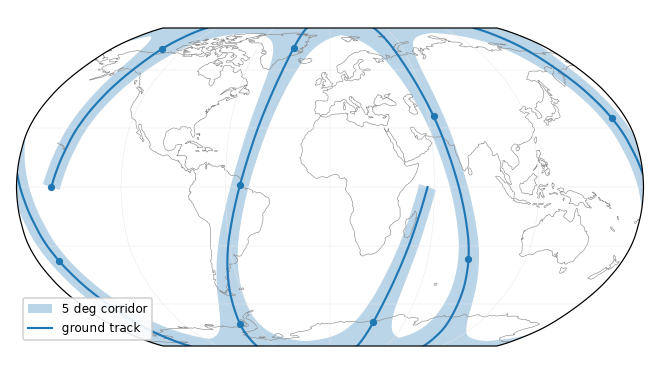
On a geographic axes fill_around's width is in degrees of arc on the
sphere, and the corridor crosses the poles intact. The filled helpers need
shapely here, which cartopy already installs.
Geodetic routines keep latitude within the poles, so a track from one arrives
with a 180° jump in longitude wherever it passed over a pole. unfold_poles
undoes that, making the track continuous past the poles as the helpers expect:
lon, lat = unfold_poles(lon, lat) # then plot_wrapped(ax, lon, lat) as above
cartopy's path transform emits a shapely RuntimeWarning for every NaN-broken
line on a GeoAxes, which is every seam crossing. mpl_wrap silences that one
message when it draws on a GeoAxes. A plain ax.plot with a NaN in it does
the same thing and is not affected.
Radians
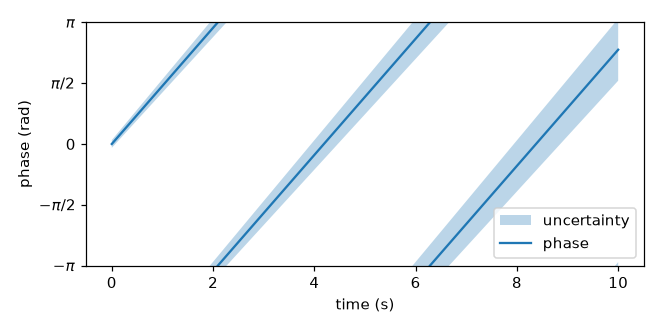
Windows that are multiples of π/2 are automatically detected and labeled with ticks that are fractions of π.
set_wrap(ax, wrapy=(-np.pi, np.pi))
plot_wrapped(ax, t, angle)
1 maintainer

Metadata
1 maintainer
Release files for mpl-wrap 0.3.1
For a detailed explanation of source distributions (sdists) and built distributions (wheels), please see the package formats documentation.
Source distribution (sdist)
| File | Size | Uploaded | |
|---|---|---|---|
| mpl_wrap-0.3.1.tar.gz | 38.8 kB | Details |
Built distribution (wheel)
| File | Interpreter | ABI | Platform | Reset |
|---|---|---|---|---|
| mpl_wrap-0.3.1-py3-none-any.whl | Python 3 | none | any | Details |
Total release size: 81.3 kB
Release files / mpl_wrap-0.3.1.tar.gz
| Download URL | mpl_wrap-0.3.1.tar.gz |
|---|---|
| Size | 38.8 kB |
| Tags | Source |
|
SHA-256 checksum How to use checksums |
59ef4c86a13b8b9ef1001a0d15b92e15dbb619ec2b8aea07c11a6bf401495096
|
|
BLAKE2b-256 checksum How to use checksums |
e95091fba634a22cdbaa96448236d4c1fc06316ea241e0fad6278a1187844598
|
| Upload date | |
|
Uploaded using Trusted Publishing? What is trusted publishing? |
Yes |
| Uploaded via |
twine/6.1.0 CPython/3.13.13
|
Provenance
Provenance describes where a file came from. On PyPI, provenance is shared via attestations, which provide a verifiable record of the build or publishing details. View details, limitations and caveats.


PyPI Publish Attestation
PyPI verified that this artifact, at this checksum, originated from the publisher listed below.
Signed by GitHub Actions, verified by PyPI on Sep 11, 2026.
Transparency logRelease files / mpl_wrap-0.3.1-py3-none-any.whl
| Download URL | mpl_wrap-0.3.1-py3-none-any.whl |
|---|---|
| Size | 42.5 kB |
| Tags | Python 3 |
|
SHA-256 checksum How to use checksums |
000093b1b76f1e3a5f4301ea924e1fe8e81b6f9f10c84601298258a114c73c1f
|
|
BLAKE2b-256 checksum How to use checksums |
e5d0571bda2fbd616455a4435918a03c4bc2af970f5d7457aedf8bdbb7baad0f
|
| Upload date | |
|
Uploaded using Trusted Publishing? What is trusted publishing? |
Yes |
| Uploaded via |
twine/6.1.0 CPython/3.13.13
|
Provenance
Provenance describes where a file came from. On PyPI, provenance is shared via attestations, which provide a verifiable record of the build or publishing details. View details, limitations and caveats.
PyPI Publish Attestation
PyPI verified that this artifact, at this checksum, originated from the publisher listed below.
Signed by GitHub Actions, verified by PyPI on Sep 11, 2026.
Transparency log













