Visualizing feature measurements on label images in napari

Project description
napari-feature-visualization


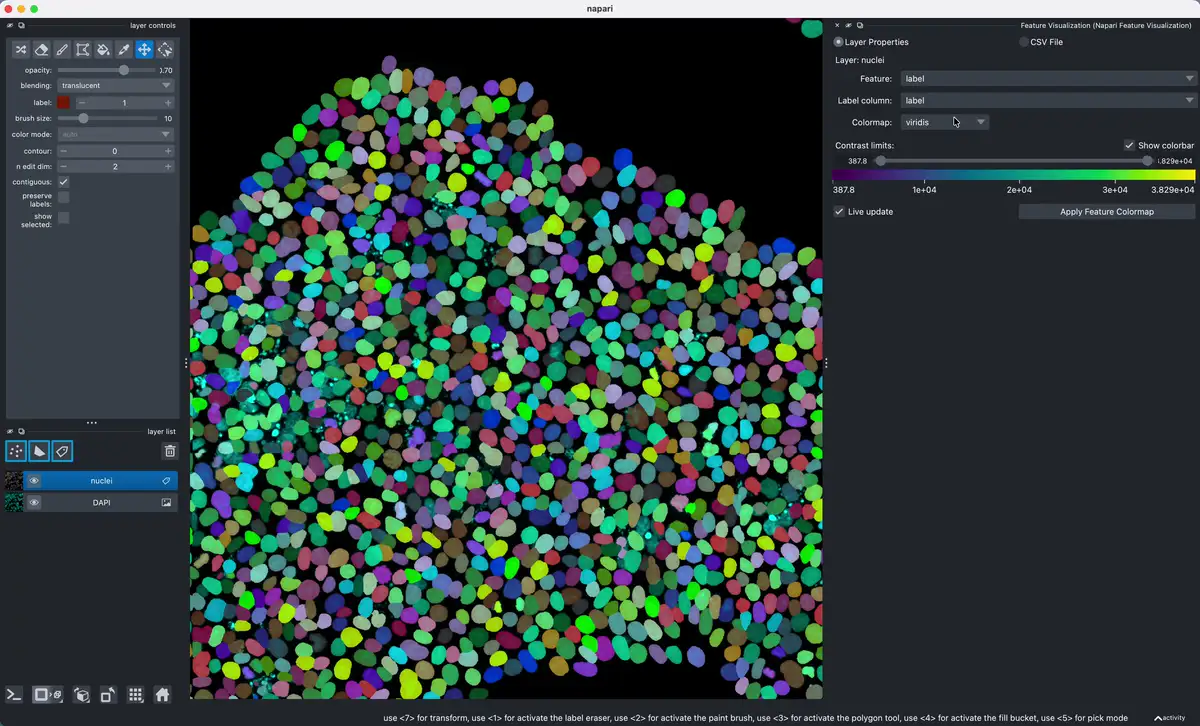
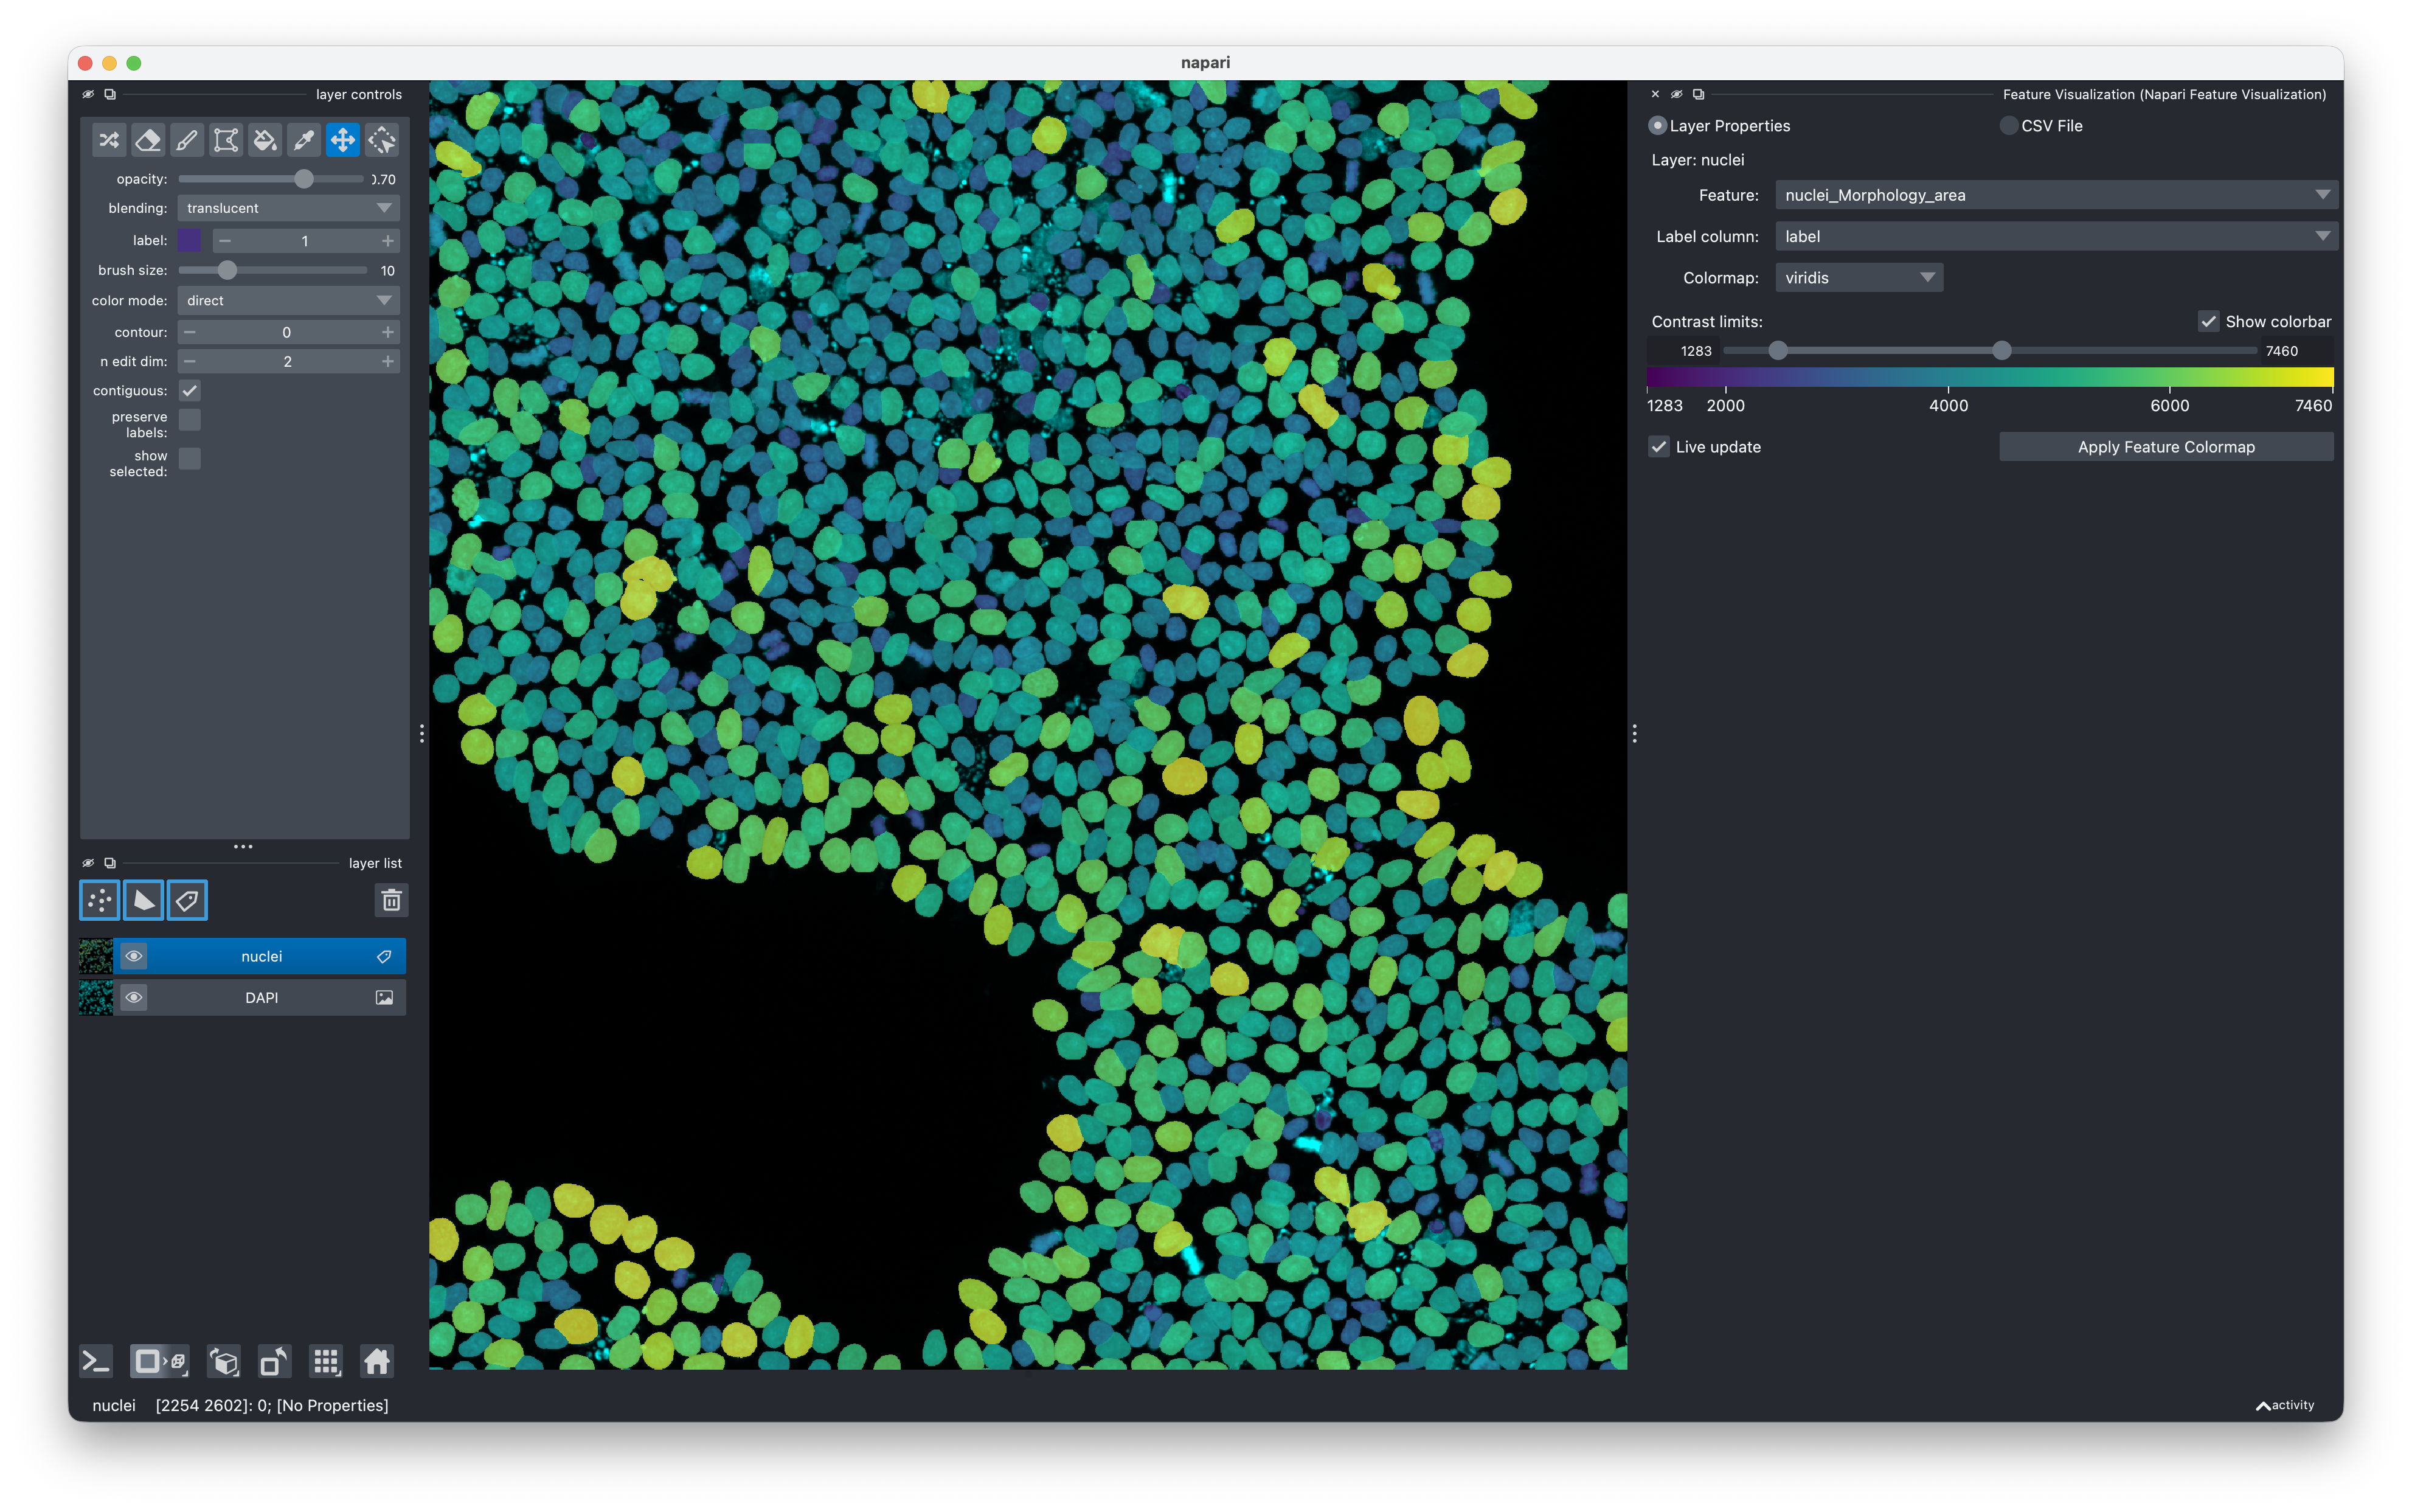
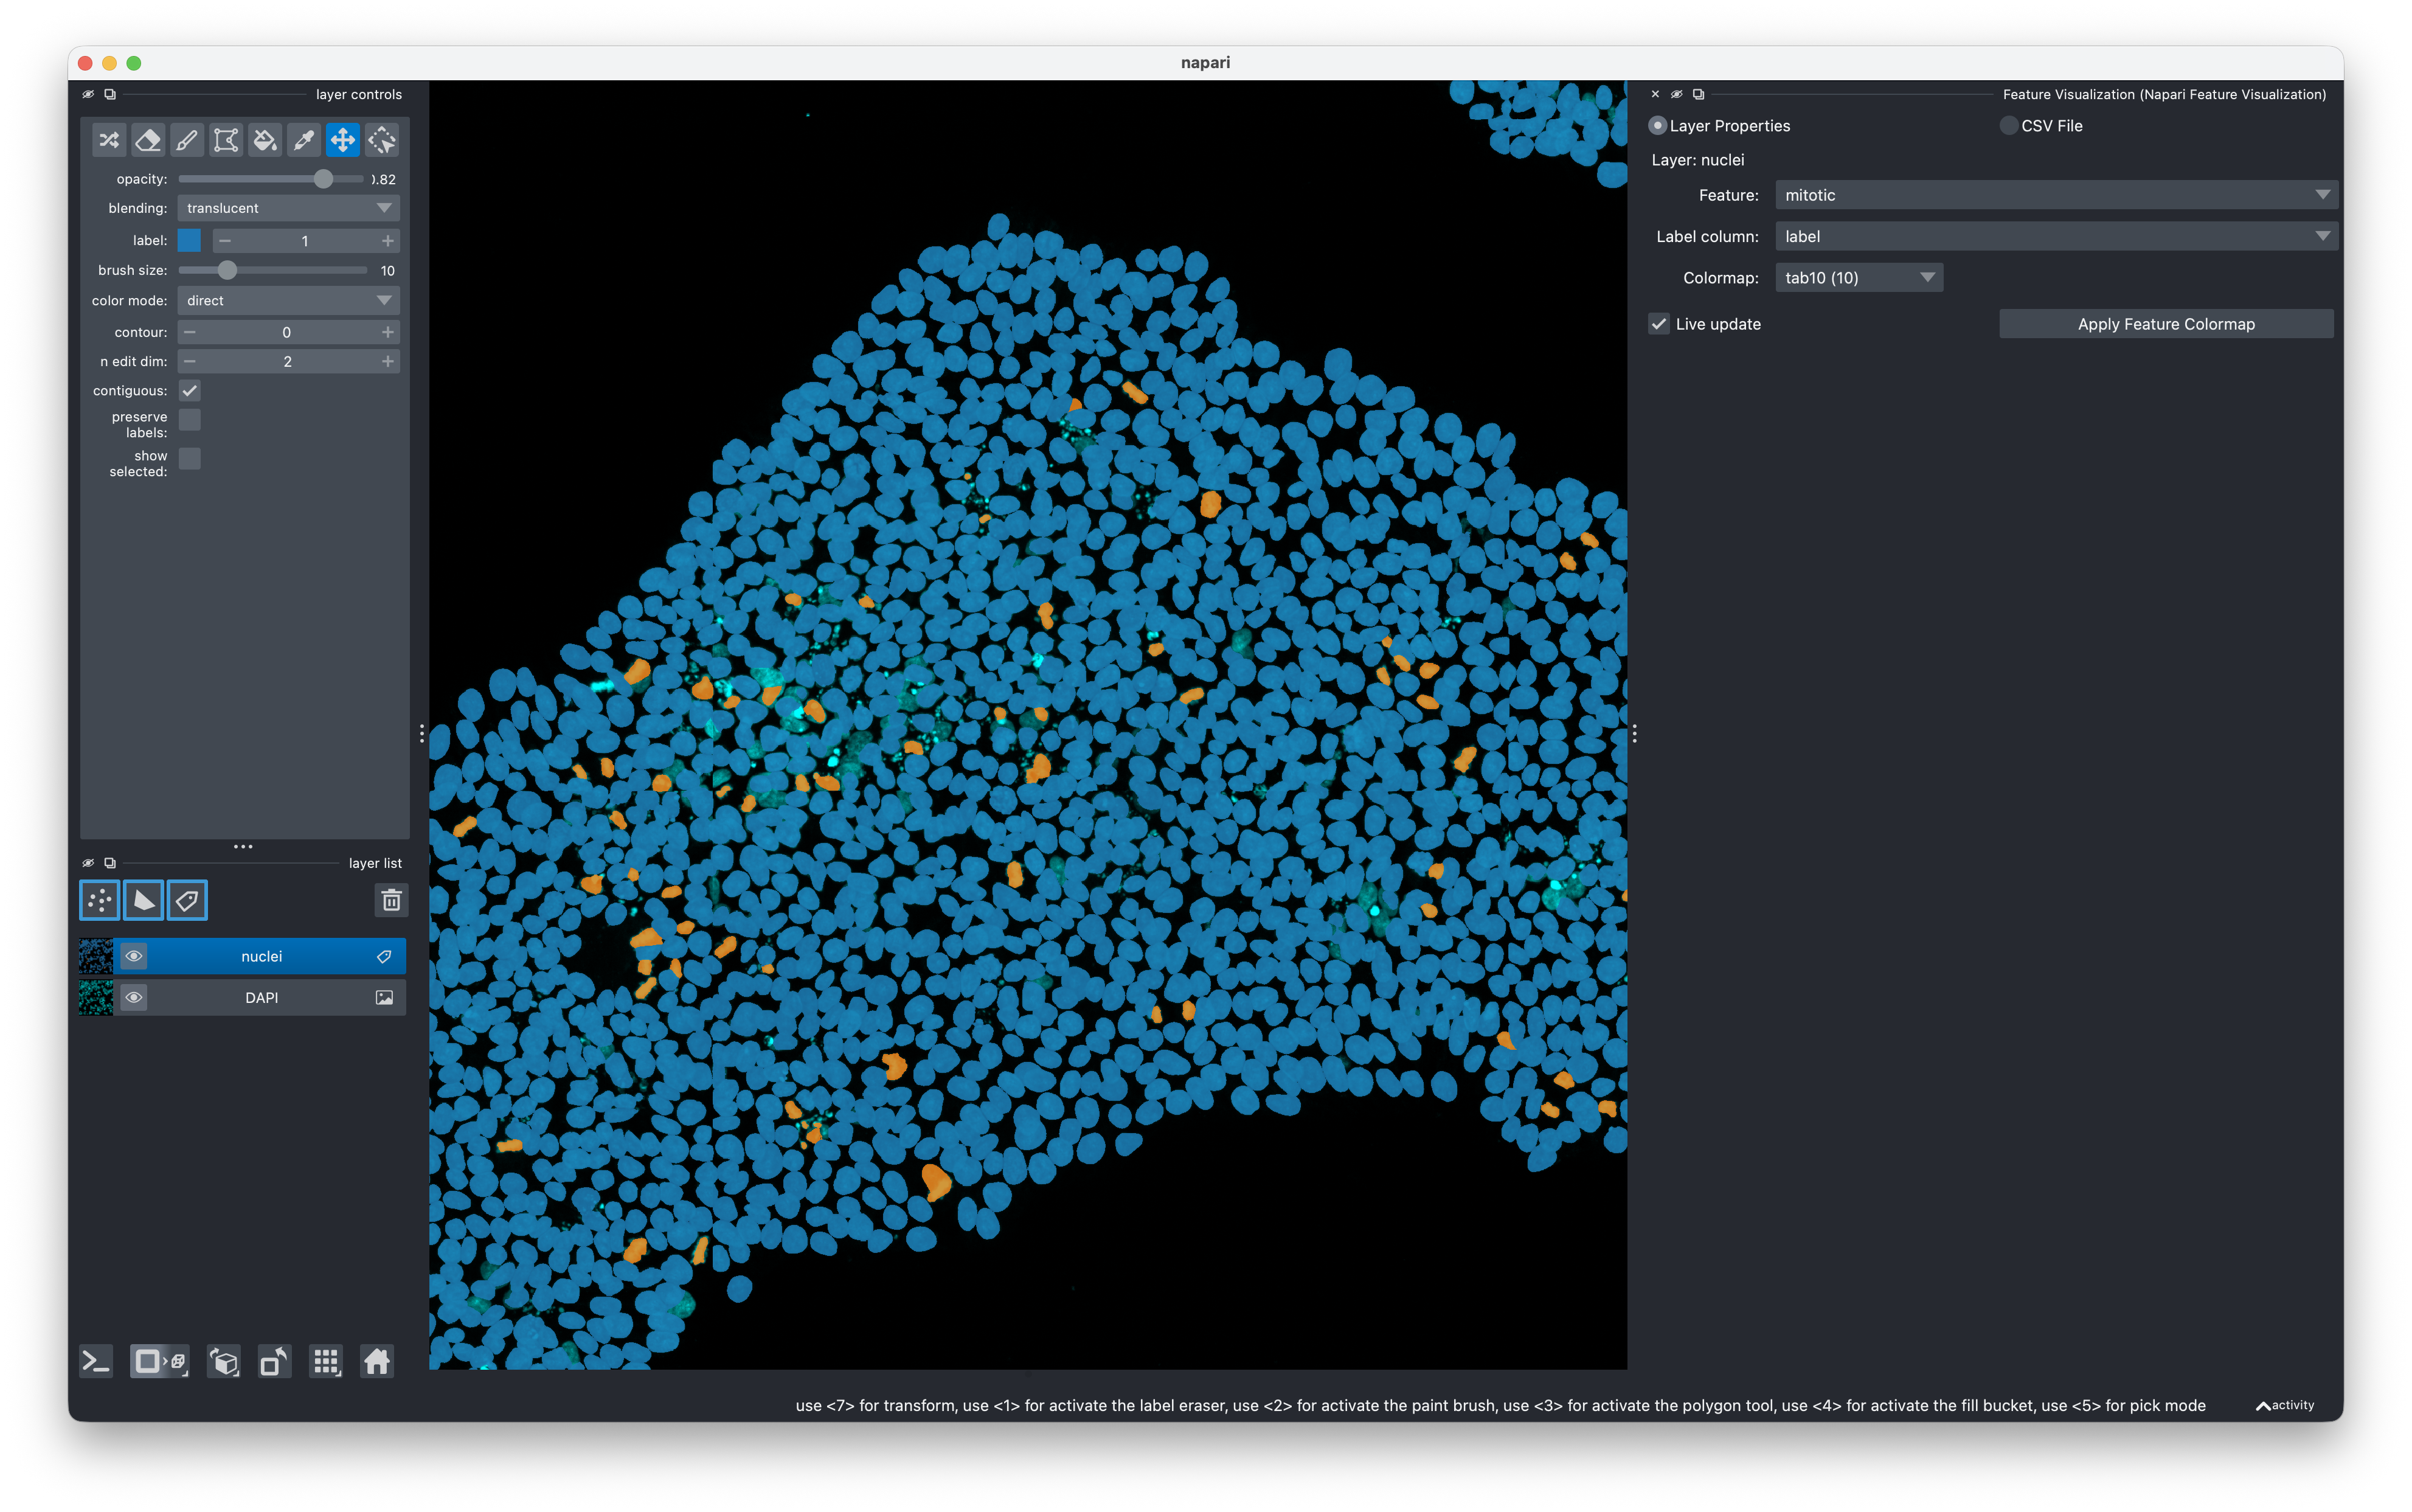
Visualize per-label feature measurements on label images in napari. Color each label by any numeric or categorical feature column, with support for both continuous colormaps (with adjustable contrast limits) and qualitative colormaps for categorical data.
Feature data can be loaded from a CSV file or read directly from
layer.features — enabling visualization of measurements stored in OME-Zarrs
via plugins such as the napari OME-Zarr navigator.
Installation
pip install napari-feature-visualization
Usage
Open the widget via Plugins → Feature Visualization.
1. Select a data source
The widget has two modes, selected with the radio buttons at the top:
- Layer Properties — reads feature columns directly from the active Labels
layer's
.featuresDataFrame. No file is needed; the features travel with the layer. - CSV File — loads a CSV from disk. Click Browse… to pick the file. The CSV must have one row per label and at least one column whose values match the label IDs in the image.
2. Select a Labels layer
Click a Labels layer in the napari layer list. The widget automatically tracks the active layer — the layer name shown below the radio buttons updates as you switch between layers. If the active layer is not a Labels layer or has no feature columns the dropdowns will be empty.
3. Configure columns
| Dropdown | Purpose |
|---|---|
| Feature | The column to visualize (any numeric or string column) |
| Label column | The column whose integer values match the label IDs in the image |
The Label column defaults to the first column named label, Label, or
index if one exists.
4. Choose a colormap
For continuous features all napari colormaps are available. The default is
viridis.
For categorical (non-numeric) features only qualitative colormaps wide
enough to cover the number of unique categories are shown. The default is
tab10 (up to 10 categories). When the number of categories exceeds all
available qualitative colormaps the napari label_colormap is used as
fallback.
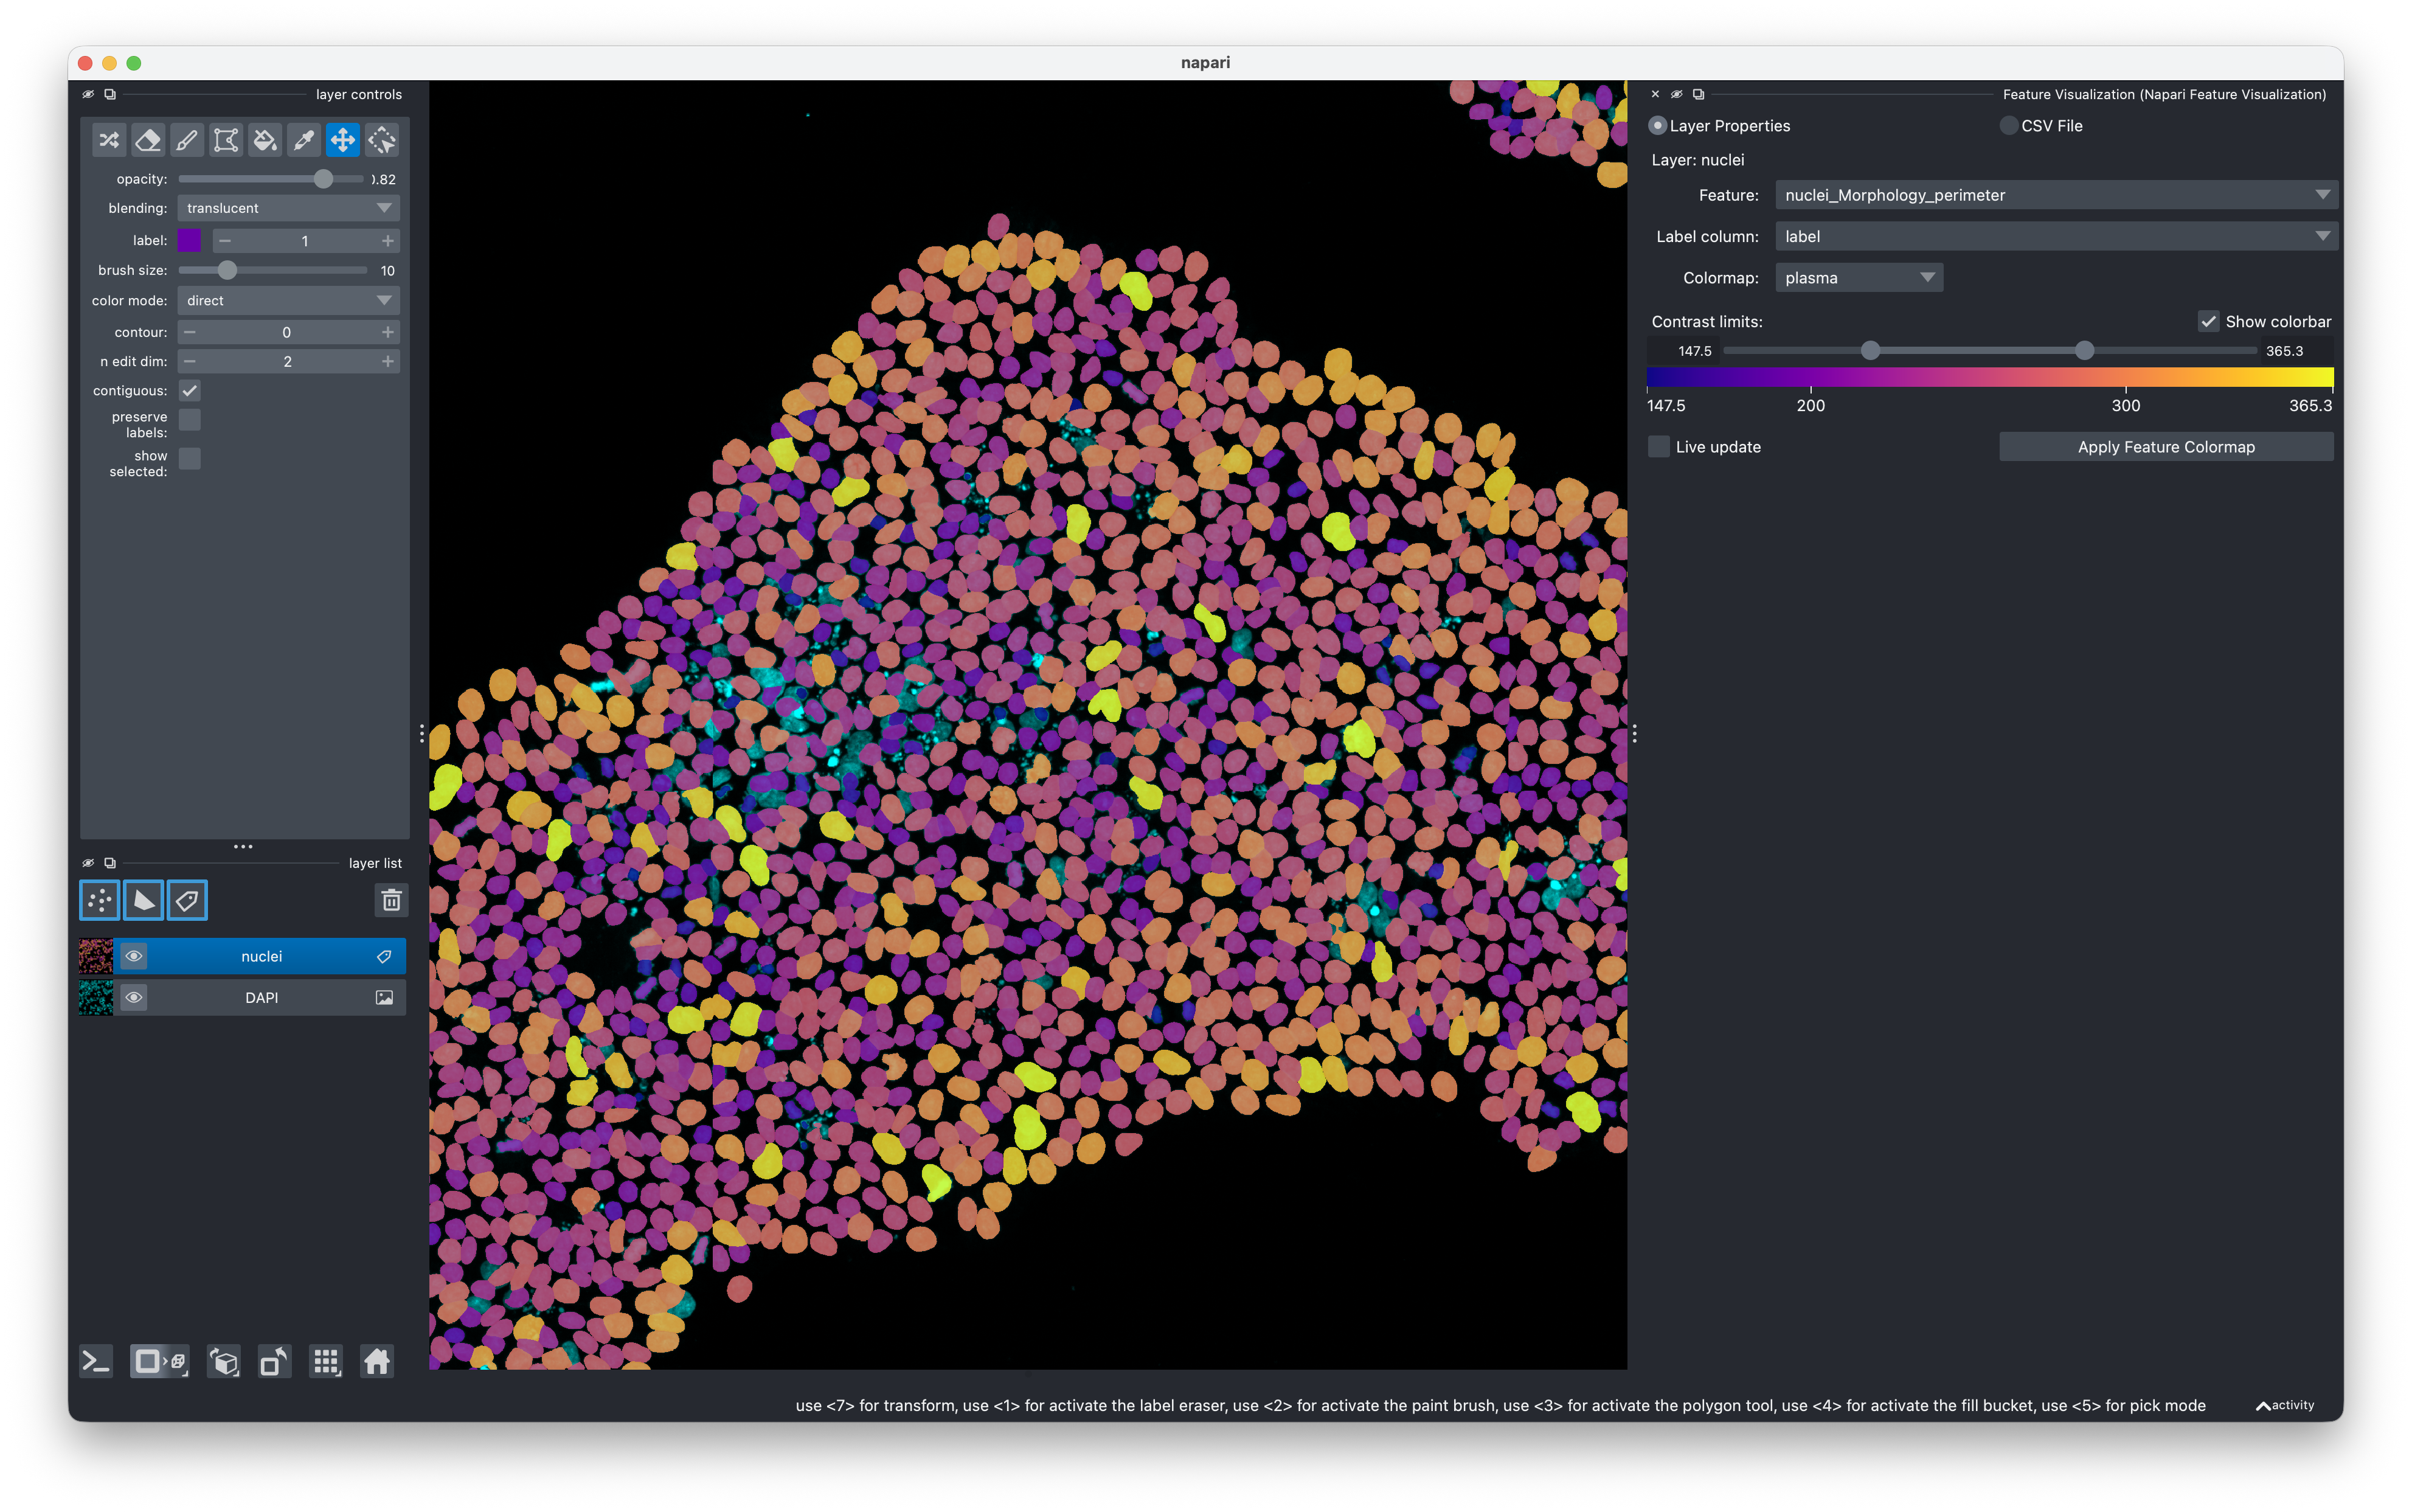
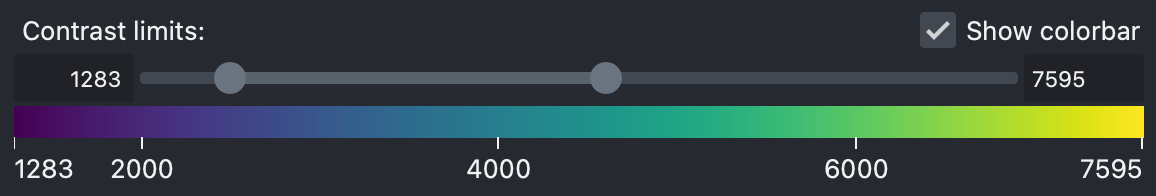
5. Adjust contrast limits (continuous features only)
The range slider sets the lower and upper contrast limits. Values below the lower limit map to the first colormap color; values above the upper limit map to the last. The limits default to the 1st and 99th percentiles of the feature values.
The Show colorbar checkbox renders a labeled gradient bar below the slider.
6. Apply
- Click Apply Feature Colormap to color the layer once.
- Check Live update to automatically re-apply whenever you change the feature, colormap, or contrast limits.
Labels whose feature value is NaN / None are rendered transparent.
Background (label 0) is always black.
Contributing
Contributions are welcome. The project uses pixi for environment management.
git clone https://github.com/fractal-napari-plugins-collection/napari-feature-visualization
cd napari-feature-visualization
pixi install
pixi run test      # run the test suite
pixi run napari    # launch napari with the plugin installed
Linting and formatting use ruff:
pixi run lint      # check
pixi run format    # auto-format
pixi run check     # lint + test in one step
Please ensure the test coverage does not decrease before opening a pull request.
Releases
Releases are driven by git tags. The version is managed automatically by setuptools-scm — there is no version number to edit manually.
- Make sure
mainis clean and all tests pass. - Create and push a version tag:
git tag v<major>.<minor>.<patch> git push origin v<major>.<minor>.<patch> - The GitHub Actions workflow detects the tag and automatically:
- Builds the source distribution and wheel (
python -m build) - Uploads to PyPI via Twine (requires the
TWINE_API_KEYsecret to be set in the repository settings)
- Builds the source distribution and wheel (
There is no separate changelog file — use the GitHub Releases page to document what changed.
License
Distributed under the terms of the BSD-3 license.
Issues
File an issue on GitHub with a detailed description.
Release history Release notifications | RSS feed


Download files
Download the file for your platform. If you're not sure which to choose, learn more about installing packages.
Source Distribution
Built Distribution
Filter files by name, interpreter, ABI, and platform.
If you're not sure about the file name format, learn more about wheel file names.
Copy a direct link to the current filters
File details
Details for the file napari_feature_visualization-0.1.0.tar.gz.
File metadata
- Download URL: napari_feature_visualization-0.1.0.tar.gz
- Upload date:
- Size: 139.0 kB
- Tags: Source
- Uploaded using Trusted Publishing? No
- Uploaded via: twine/6.2.0 CPython/3.14.3
File hashes
| Algorithm | Hash digest | |
|---|---|---|
| SHA256 |
b43fd4d4a1756386e96ccf28d61e5f375611ceba8a95b44ef5c6d1f85b4c3eb9
|
|
| MD5 |
4c7237eaa129731d234de7a4d373c7e1
|
|
| BLAKE2b-256 |
82a255ec57f78795c534858b275c0ec9cc57632ef9f121a645468cca1153639f
|
File details
Details for the file napari_feature_visualization-0.1.0-py3-none-any.whl.
File metadata
- Download URL: napari_feature_visualization-0.1.0-py3-none-any.whl
- Upload date:
- Size: 23.3 kB
- Tags: Python 3
- Uploaded using Trusted Publishing? No
- Uploaded via: twine/6.2.0 CPython/3.14.3
File hashes
| Algorithm | Hash digest | |
|---|---|---|
| SHA256 |
a7ecc7aa3bc2b8e2205458c5800246281deb5e3fdd267c79fef4c93f579a01c8
|
|
| MD5 |
e270ae01ad53bd2679b5150b6533274d
|
|
| BLAKE2b-256 |
51b67c7117f341c9bf5098114165786621337d650913a8d4280c489d6d92bd3c
|


