Calculer les indices de végétation

Project description
napari-indices


Calculer les indices de végétation
This napari plugin was generated with Cookiecutter using @napari's cookiecutter-napari-plugin template.
Emmanuella OKAFOR (L3 PA CMI-PSI_Université d'Angers) developed this plugin during her internship with a french team called ImHorPHen (lead by David ROUSSEAU). This plugin realises vegetation indexes computation with hyperspectral images. For the momment, there are five vegetation indexes : NDVI, TCARI, NPCI, SGI, NDGI.
Installation
You can install napari-indices via pip:
pip install napari-indices
To install latest development version :
pip install git+https://github.com/Emmanulla0/napari-indices.git
Plugin description
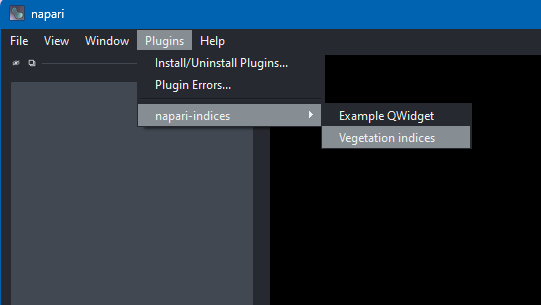
Using this plugin requires importing the bands of a hyperspectral image into a tif file, in our case, 160 bands. You must launch it by accessing the Plugins > napari-indices> Vegetation indices menu.
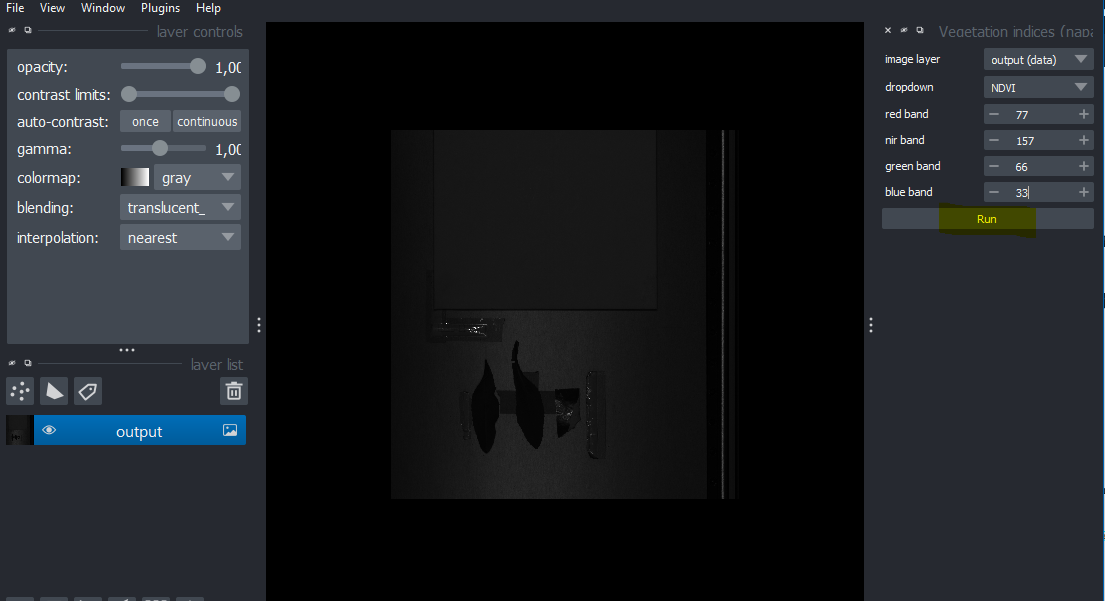
Then select the vegetation index to be calculated and the different bands to be used, then click the Run button to start the calculation. This results in the images corresponding to the calculated indices.
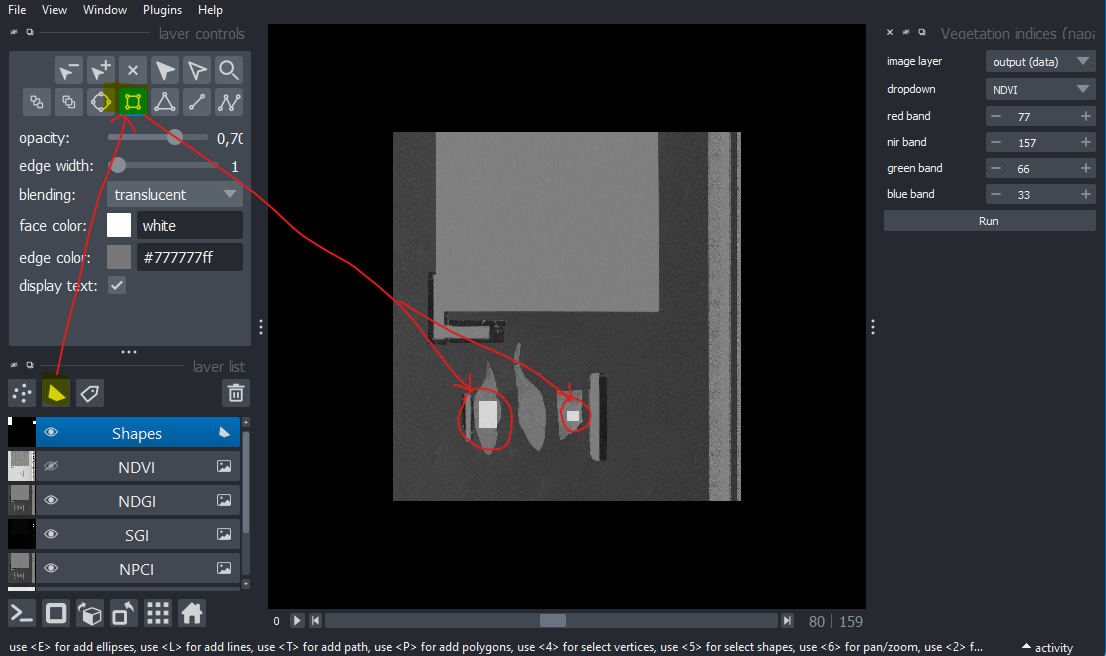
The areas of interest to be analysed must then be defined. To do this, click the Shapes button on the Napari interface and choose the add rectangle shape from the menu that appears. Using the mouse, it is then possible to draw a rectangle on each of the two areas to be analyzed, for example a tree sheet and a green sheet of paper.
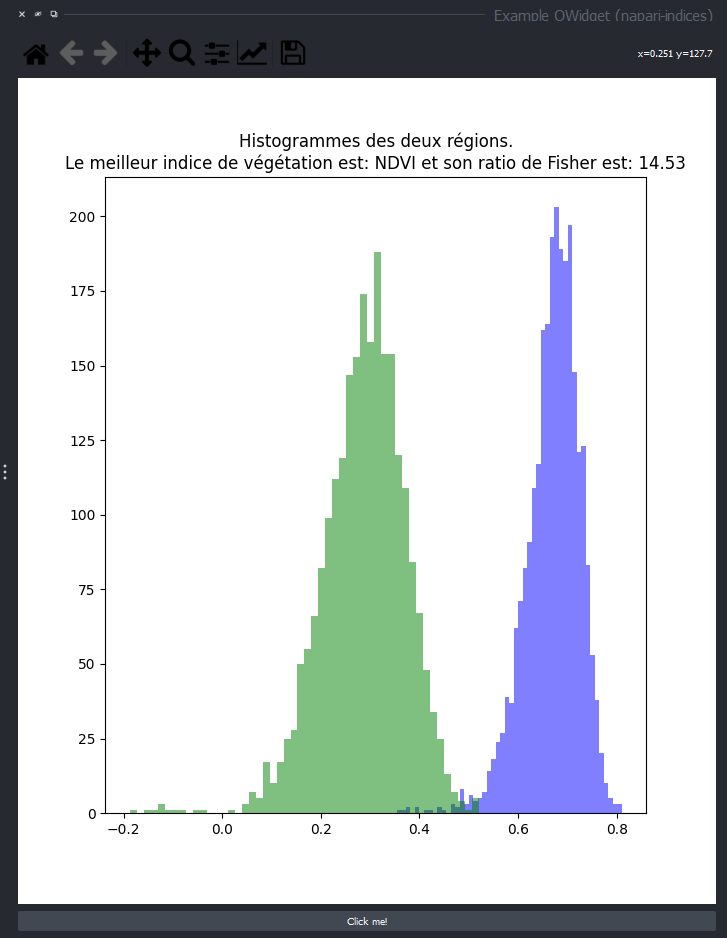
To perform the Fisher ratio calculation and display the histogram, it is necessary to go back to the Plugins > napari-indices > ExempleQWidget menu and click the **Click me! **. This action opens a new window displaying the best vegetation index to use, its corresponding Fisher ratio and the histogram of the two selected regions on the image of the vegetation index concerned. A video explaining the plugin is available at: https://uabox.univ-angers.fr/index.php/s/LqB0qs11n3jxZVJ.
Contributing
Contributions are very welcome. Tests can be run with tox, please ensure the coverage at least stays the same before you submit a pull request.
License
Distributed under the terms of the BSD-3 license, "napari-indices" is free and open source software
Issues
If you encounter any problems, please file an issue along with a detailed description.
Release history Release notifications | RSS feed


Download files
Download the file for your platform. If you're not sure which to choose, learn more about installing packages.
Source Distribution
Built Distribution
Filter files by name, interpreter, ABI, and platform.
If you're not sure about the file name format, learn more about wheel file names.
Copy a direct link to the current filters
File details
Details for the file napari-indices-0.0.2.tar.gz.
File metadata
- Download URL: napari-indices-0.0.2.tar.gz
- Upload date:
- Size: 13.9 kB
- Tags: Source
- Uploaded using Trusted Publishing? No
- Uploaded via: twine/4.0.2 CPython/3.9.13
File hashes
| Algorithm | Hash digest | |
|---|---|---|
| SHA256 |
6bec2a6389b97036318b1a43803e552081913f3062f29453ae518370dde0d557
|
|
| MD5 |
d1b11f85b4a48e53f08018fa235c35cd
|
|
| BLAKE2b-256 |
4dec220e18e12bd46e5c51ff2125f34dc2396e4f9fff0d86b9def3c77ed7bb4f
|
File details
Details for the file napari_indices-0.0.2-py3-none-any.whl.
File metadata
- Download URL: napari_indices-0.0.2-py3-none-any.whl
- Upload date:
- Size: 13.7 kB
- Tags: Python 3
- Uploaded using Trusted Publishing? No
- Uploaded via: twine/4.0.2 CPython/3.9.13
File hashes
| Algorithm | Hash digest | |
|---|---|---|
| SHA256 |
adeda8f82ec3c4dba6301bae8847317b46bad12337b48737e0472fdcc8ee0c10
|
|
| MD5 |
c3844f72160780c4662dccf881cef2f9
|
|
| BLAKE2b-256 |
27ede23f41211aeba11578fa53f8fc6433a3c4f0f16246b8e80bdd1c08316638
|


