
ndnsim-graph
A small graph package used to draw image for ndnsim metrics
1. Install
pip install ndnsimgraph
2. Usage Example
2.1 Throughput
-
功能:
- 绘制节点特定Face的吞吐量;=>
plot - 绘制多个节点吞吐量之和;=>
plotSum - 绘制多个节点吞吐量的平均值; =>
plotAvg
- 绘制节点特定Face的吞吐量;=>
-
基本使用:
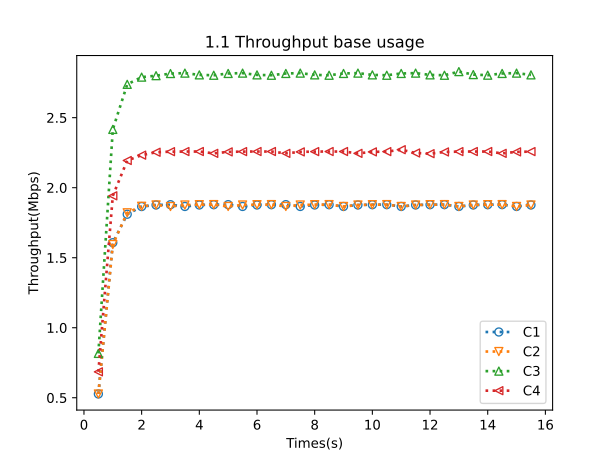
from ndnsimgraph.throughput import ThroughputGraph, ThroughputType, ThroughputTarget

ThroughputGraph.parse("throughput.txt"). \
    setThroughputType(ThroughputType.OutData). \
    setThroughputTarget(ThroughputTarget.Kilobytes_Mbps). \
    setSamplingInterval(0.5). \
    plot("C1", 258). \
    plot("C2", 258). \
    plot("C3", 258). \
    plot("C4", 258). \
    title("1.1 Throughput base usage"). \
    xlabel("Times(s)"). \
    ylabel("Throughput(Mbps)"). \
    legend(). \
    drawAndSave("output", "throughput-1.1.svg"). \
    close()
-
可以通过
setThroughputType设置不同的吞吐量类型,有效值如下:吞吐量类型 描述 ThroughputType.InInterests 统计从该Face接收到的Interest的指标(数量、速率) ThroughputType.OutInterests 统计从该Face转发出去的Interest的指标(数量、速率) ThroughputType.InData 统计从该Face接收到的Data的指标(数量、速率) ThroughputType.OutData 统计从该Face转发出去的Data的指标(数量、速率) ThroughputType.InNacks 统计从该Face接收到的Nack的指标(数量、速率) ThroughputType.OutNacks 统计从该Face转发出去的Nack的指标(数量、速率) ThroughputType.InSatisfiedInterests 统计从该Face传入的被满足的Interest的指标(数量、速率) ThroughputType.InTimedOutInterests 统计从该Face传入的超时的Interest的指标(数量、速率) ThroughputType.OutSatisfiedInterests 统计从该Face传出的被满足的Interest的指标(数量、速率) ThroughputType.SatisfiedInterests 统计所有Face已满足Interest的指标(数量、速率) ThroughputType.TimedOutInterests 统计所有Face超时Interest的指标(数量、速率) -
可以通过
setThroughputTarget设置吞吐量目标值,有效值如下:吞吐量目标 描述 ThroughputTarget.Packets EWMA后的包数量 ThroughputTarget.Kilobytes_KBps EWMA后的速率(KBps) ThroughputTarget.Kilobytes_MBps EWMA后的速率(MBps) ThroughputTarget.Kilobytes_Kbps EWMA后的速率(Kbps) ThroughputTarget.Kilobytes_Mbps EWMA后的速率(Mbps) ThroughputTarget.PacketRaw 统计周期内的包数量(真实数量,没有EWMA) ThroughputTarget.KilobytesRaw_KBps 统计周期内的真实速率(KBps) ThroughputTarget.KilobytesRaw_MBps 统计周期内的真实速率(MBps) ThroughputTarget.KilobytesRaw_Kbps 统计周期内的真实速率(Kbps) ThroughputTarget.KilobytesRaw_Mbps 统计周期内的真实速率(Mbps) -
可以通过
setSamplingInterval设置采样间隔 => 设置为1,则每秒采样一次。 -
可以通过
plot函数绘制节点某个Face的吞吐量 => plot 函数与 matplotlib 的plot函数一致,所有可以传递给matplotlib.plot 的参数都可以传递给plot-
例如主动设置折现的样式、大小、颜色和标签等等等等
from ndnsimgraph.throughput import ThroughputGraph, ThroughputType, ThroughputTarget

ThroughputGraph.parse("throughput.txt"). \
    setThroughputType(ThroughputType.OutData). \
    setThroughputTarget(ThroughputTarget.Kilobytes_Mbps). \
    setSamplingInterval(0.5). \
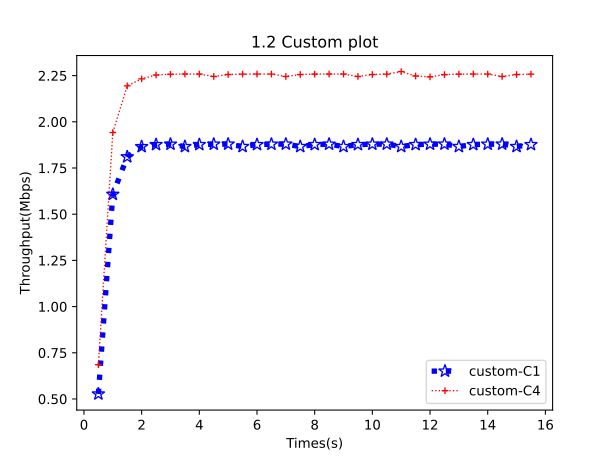
    plot("C1", 258, linestyle="dotted", linewidth=4, markersize=10, marker="*", color="blue", label="custom-C1"). \
    plot("C4", 258, linewidth=1, markersize=5, marker="+", color="red", label="custom-C4"). \
    title("1.2 Custom plot"). \
    xlabel("Times(s)"). \
    ylabel("Throughput(Mbps)"). \
    legend(). \
    drawAndSave("output", "throughput-1.2.svg"). \
    close()
-
-
可以通过
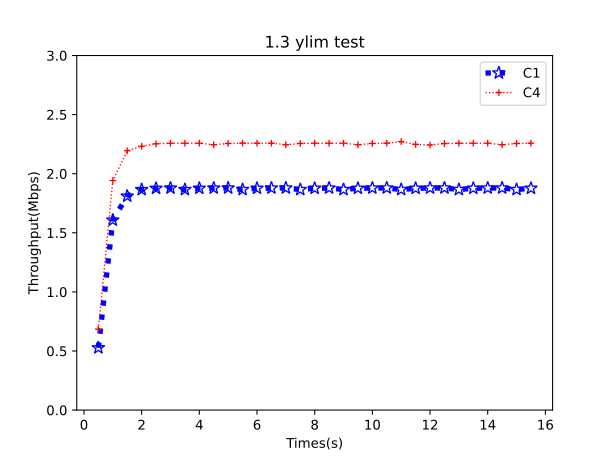
xlim和ylim函数设置横纵坐标的显示范围from ndnsimgraph.throughput import ThroughputGraph, ThroughputType, ThroughputTarget ThroughputGraph.parse("throughput.txt"). \ setThroughputType(ThroughputType.OutData). \ setThroughputTarget(ThroughputTarget.Kilobytes_Mbps). \ setSamplingInterval(0.5). \ plot("C1", 258, linestyle="dotted", linewidth=4, markersize=10, marker="*", color="blue"). \ plot("C4", 258, linewidth=1, markersize=5, marker="+", color="red"). \ ylim((0, 3)). \ title("1.3 ylim test"). \ xlabel("Times(s)"). \ ylabel("Throughput(Mbps)"). \ legend(). \ drawAndSave("output", "throughput-1.3.svg"). \ close()
-
-
使用
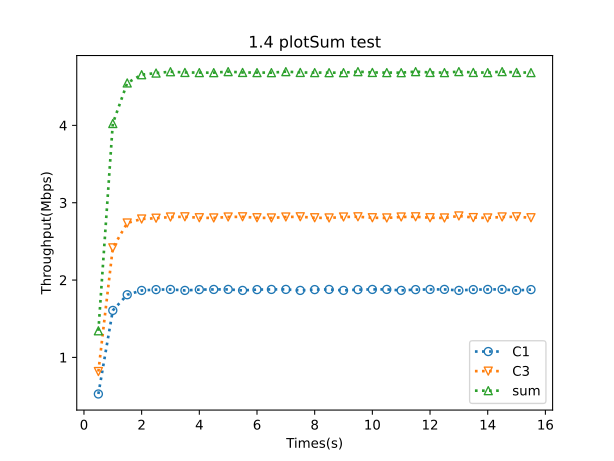
plotSum实现多条折线的加和from ndnsimgraph.throughput import ThroughputGraph, ThroughputType, ThroughputTarget from ndnsimgraph.common import NodeItem ThroughputGraph.parse("throughput.txt"). \ setThroughputType(ThroughputType.OutData). \ setThroughputTarget(ThroughputTarget.Kilobytes_Mbps). \ setSamplingInterval(0.5). \ plot("C1", 258). \ plot("C3", 258). \ plotSum([NodeItem("C1", 258), NodeItem("C3", 258), ], label="sum"). \ title("1.4 plotSum test"). \ xlabel("Times(s)"). \ ylabel("Throughput(Mbps)"). \ legend(). \ drawAndSave("output", "throughput-1.4.svg"). \ close()
-
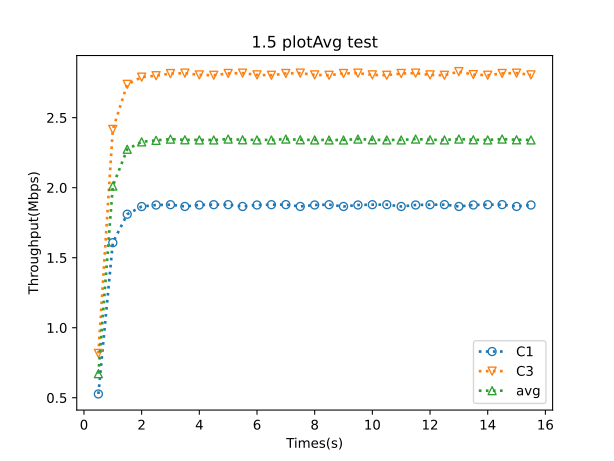
使用
plotAvg实现多条折线取平均from ndnsimgraph.throughput import ThroughputGraph, ThroughputType, ThroughputTarget from ndnsimgraph.common import NodeItem ThroughputGraph.parse("throughput.txt"). \ setThroughputType(ThroughputType.OutData). \ setThroughputTarget(ThroughputTarget.Kilobytes_Mbps). \ setSamplingInterval(0.5). \ plot("C1", 258). \ plot("C3", 258). \ plotAvg([NodeItem("C1", 258), NodeItem("C3", 258), ], label="avg"). \ title("1.5 plotAvg test"). \ xlabel("Times(s)"). \ ylabel("Throughput(Mbps)"). \ legend(). \ drawAndSave("output", "throughput-1.5.svg"). \ close()
2.2 Delay
-
功能:
-
绘制某个Consumer的延迟;=>
plot -
绘制多个Consumer的延迟之和;=>
plotSum -
绘制多个Consumer的延迟的平均值; =>
plotAvg
-
-
基本使用
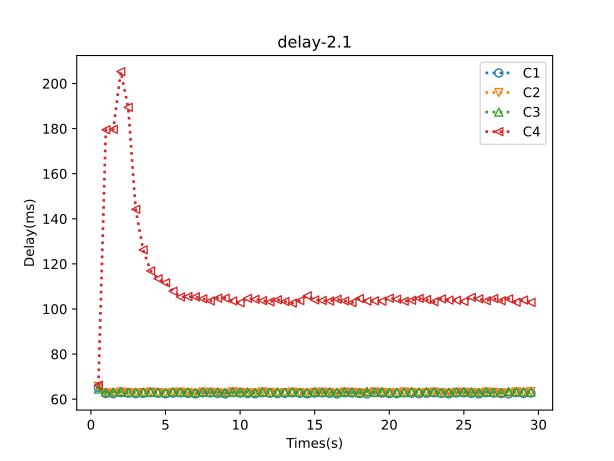
from ndnsimgraph.delay import DelayGraph, DelayType, DelayTarget

DelayGraph.parse("delay.txt"). \
    setDelayType(DelayType.LastDelay). \
    setDelayTarget(DelayTarget.DelayMS). \
    setSamplingInterval(0.5). \
    plot("C1", 0). \
    plot("C2", 0). \
    plot("C3", 0). \
    plot("C4", 0). \
    title("delay-2.1"). \
    xlabel("Times(s)"). \
    ylabel("Delay(ms)"). \
    legend(). \
    drawAndSave("output", "delay-2.1.svg"). \
    close()
-
可以通过
setDelayType设置不同的吞吐量类型,有效值如下:延迟类型 描述 DelayType.LastDelay LastDelay意味着DelayS和DelayUS代表最后发送的兴趣和接收的数据包之间的延迟 DelayType.FullDelay FullDelay是指DelayS和DelayUS代表发送的第一个感兴趣的数据包和接收的数据包之间的延迟 -
可以通过
setDelayTarget设置延迟目标,有效值如下:延迟目标 描述 DelayTarget.DelayS 按秒统计的延迟 DelayTarget.DelayMS 按毫秒统计的延迟 DelayTarget.DelayUS 按微秒统计的延迟 -
其它函数,
setSamplingInterval、plot、xlim、ylim等等的含义和 Throughput的一致,详情请见 2.1 节。
-
-
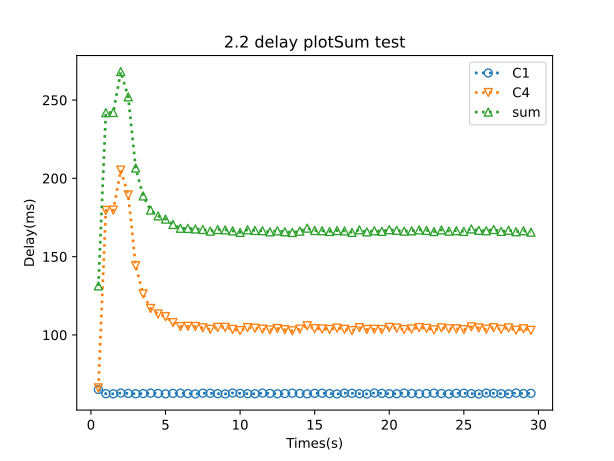
使用
plotSum实现多条折线的加和:from ndnsimgraph.delay import DelayGraph, DelayType, DelayTarget from ndnsimgraph.common import NodeItem DelayGraph.parse("delay.txt"). \ setDelayType(DelayType.LastDelay). \ setDelayTarget(DelayTarget.DelayMS). \ setSamplingInterval(0.5). \ plot("C1", 0). \ plot("C4", 0). \ plotSum([NodeItem("C1", 0), NodeItem("C4", 0)], label="sum"). \ title("2.2 delay plotSum test"). \ xlabel("Times(s)"). \ ylabel("Delay(ms)"). \ legend(). \ drawAndSave("output", "delay-2.2.svg"). \ close()
-
使用
plotAvg实现多条折线取平均:from ndnsimgraph.delay import DelayGraph, DelayType, DelayTarget from ndnsimgraph.common import NodeItem DelayGraph.parse("delay.txt"). \ setDelayType(DelayType.LastDelay). \ setDelayTarget(DelayTarget.DelayMS). \ setSamplingInterval(0.5). \ plot("C1", 0). \ plot("C4", 0). \ plotAvg([NodeItem("C1", 0), NodeItem("C4", 0)], label="avg"). \ title("2.3 delay plotAvg test"). \ xlabel("Times(s)"). \ ylabel("Delay(ms)"). \ legend(). \ drawAndSave("output", "delay-2.3.svg"). \ close()

2.3 Drop
from ndnsimgraph.drop import DropGraph, DropType, DropTarget

DropGraph.parse("data_content_delivery/drop_abilene.txt").
    setDropType(DropType.Drop).
    setDropTarget(DropTarget.PacketRaw).
    setSamplingInterval(1).
    innerPlot("C1").
    innerPlot("C2").
    title("test title").
    xlabel("Drop(packets)").
    ylabel("Times(s)").
    ylim(0).
    legend().
    drawAndSave("output", "test-drop.svg").
    close()

3. Upload new packet
python3 setup.py sdist bdist_wheel
twine upload dist/*
1 maintainer

Metadata
1 maintainer
Release files for ndnsimgraph 0.3.1
For a detailed explanation of source distributions (sdists) and built distributions (wheels), please see the package formats documentation.
Source distribution (sdist)
| File | Size | Uploaded | |
|---|---|---|---|
| ndnsimgraph-0.3.1.tar.gz | 22.2 kB | Details |
Built distribution (wheel)
| File | Interpreter | ABI | Platform | Reset |
|---|---|---|---|---|
| ndnsimgraph-0.3.1-py3-none-any.whl | Python 3 | none | any | Details |
Total release size: 47.1 kB
Release files / ndnsimgraph-0.3.1.tar.gz
| Download URL | ndnsimgraph-0.3.1.tar.gz |
|---|---|
| Size | 22.2 kB |
| Tags | Source |
|
SHA-256 checksum How to use checksums |
6b0acde0a2e56eb8f787a4bda62a4f11702e45ffc8007069817e9ec728b8e14c
|
|
BLAKE2b-256 checksum How to use checksums |
c6c9c7469a53a711f906adf6f8217ecbdf81c54b8a19e7d3992eb283025f3db4
|
| Upload date | |
|
Uploaded using Trusted Publishing? What is trusted publishing? |
No |
| Uploaded via |
twine/6.1.0 CPython/3.9.18
|
Release files / ndnsimgraph-0.3.1-py3-none-any.whl
| Download URL | ndnsimgraph-0.3.1-py3-none-any.whl |
|---|---|
| Size | 24.9 kB |
| Tags | Python 3 |
|
SHA-256 checksum How to use checksums |
a35396912340b4d84f3f5241e0b9f48f1f05d3b9ba8f7ea90aaf98768f002f7b
|
|
BLAKE2b-256 checksum How to use checksums |
cdf6db12c3425509fa35510d500a3de8251ac55d598f44d5a23c51e88a0a1c8e
|
| Upload date | |
|
Uploaded using Trusted Publishing? What is trusted publishing? |
No |
| Uploaded via |
twine/6.1.0 CPython/3.9.18
|














