
Ndvi2Gif: Multi-Seasonal Remote Sensing Index Composites






Ndvi2Gif is a Python library for multi-temporal remote sensing analysis with Google Earth Engine. It provides seasonal compositing, 40+ vegetation and environmental indices, SAR preprocessing, time series analytics, land cover classification, and hydroperiod analysis — all server-side, without downloading raw data.
Built on top of Google Earth Engine and geemap. Adapted and extended through its use in the eLTER and SUMHAL projects.
📚 Documentation
https://digdgeo.github.io/Ndvi2Gif/
✨ What's New in v1.6.3
⚠️ Every Sentinel-3 index changes, and NDVI changed sign.
COPERNICUS/S3/OLCIis top-of-atmosphere radiance and was being read as if it were reflectance. Solar irradiance falls with wavelength at roughly the rate a vegetation spectrum rises, so the radiances came out nearly flat across bands and S3 NDVI sat near zero whatever the surface: one Doñana scene gave −0.022 on radiance against +0.208 on reflectance, reading vegetation as bare ground. The collection is now converted to TOA reflectance with per-band, per-spacecraft solar irradiance. Anything computed from Sentinel-3 indices should be recomputed. Note this is TOA, not surface reflectance: over water the signal is dominated by Rayleigh scattering.
Water masking is now a parameter, not an improvisation — get_water_mask() offers
'dynamic', 'permanent', 'maximum', the JRC Global Surface Water layer, or a zone you
supply. Over Iznájar in 2022 the same reservoir measures 6.47 km² permanent against 10.95 at
maximum extent: a factor of 1.7 in the surface a chlorophyll mean is taken over. The masked
area per period is recorded alongside, because with a dynamic mask each period is averaged
over a different population of pixels.
The peak month is a circular variable — get_peak_statistics() returns the circular mean
and the concentration R instead of an ordinary average, which would place December and January
in June. R is what says whether the mean means anything.
One nighttime lights record, 1992 to today — calibrate_nighttime_lights() fits the
DMSP-to-VIIRS conversion on your own ROI. On the Andalusian coast it takes the artificial step
at the sensor change from −64% down to −12%.
Previously, in v1.6.0:
⚠️ Values change for some indices — please read before upgrading. A review of every index against its publication found that Sentinel-2 and MODIS bands were used as integers × 10000 instead of reflectance: band ratios such as NDVI were unaffected, but SAVI, EVI, LAI, AVI, WI2015, CRI and a few others came out wrong on those sensors (EVI 2–3 times too high). Sentinel-1 was processed and indexed in dB instead of linear power, and its terrain correction had no effect because the DEM lost its projection. Several formulas were also wrong (
aweinsh,wi2015,nmi,rfdi,dpsvi). All are fixed and tested; results computed with the affected indices should be recomputed. The CHANGELOG lists every index and how much it changes.
Multi-sensor classification — LandCoverClassifier([s2, s1]) combines indices from several sensors in one feature stack, e.g. indices={'S2': ['ndvi', 'ndmi'], 'S1': ['vv', 'vh']}. When resolutions differ you choose how to reconcile them (resample='coarser', 'finer' or a pixel size in meters). In the new Tawau Hills tutorial — natural forest versus oil palm under Borneo's clouds — Sentinel-2 + Sentinel-1 reach 0.76 overall accuracy against 0.73 and 0.58 for each sensor alone.
Reproducible classifications — export_model() saves the full configuration, every random-forest tree, the accuracy and the training samples with their coordinates, ready to refit the model in scikit-learn or R. Train/validation splits are now seeded and identical across feature stacks, so classifiers can be compared fairly.
An indices catalogue you can trust — the indices reference is rebuilt from the code: 111 variables, each with the formula as implemented and a verified reference. Each sensor now only accepts the indices it can actually compute.
Previously, in v1.5.0: raw reflectance bands as index= ('blue' … 'swir2', plus 'red_edge1-3' on S2) and key='count', the number of valid observations per pixel; v1.5.1 fixed band names shifting when a period had no images.
In v1.4.0: dispersion reducers — key='std', 'variance', 'range', 'cv' — and downloadable water masks from HydroperiodAnalyzer.
And in v1.3.0: SpatialPhenologyAnalyzer, GEE-native per-pixel phenology rasters (SOS/POS/EOS) with threshold, derivative and harmonic methods. See CHANGELOG for details.
Modules
| Module | Description |
|---|---|
NdviSeasonality |
Core engine: seasonal compositing, 40+ indices, 7 sensors, flexible ROI input |
HydroperiodAnalyzer |
Wetland flood duration analysis (days/year) with multi-year anomaly detection |
TimeSeriesAnalyzer |
Trend detection (Mann-Kendall, Sen's slope), phenology metrics, dashboards |
SpatialPhenologyAnalyzer |
Per-pixel phenology rasters (SOS/POS/EOS) via threshold, derivative or harmonic methods |
S1ARDProcessor |
Sentinel-1 SAR preprocessing: terrain correction, speckle filtering |
LandCoverClassifier |
Supervised (RF, SVM, CART) and unsupervised (K-means, LDA) classification, multi-sensor feature stacks, exportable models |
Installation
pip install ndvi2gif
conda install -c conda-forge ndvi2gif
Quick Start
import ee
from ndvi2gif import NdviSeasonality

ee.Authenticate()
ee.Initialize(project='your-project-id')

# Monthly NDVI composites from Sentinel-2 (2018–2024)
ndvi = NdviSeasonality(
    roi=your_roi, sat='S2', periods=12,
    start_year=2018, end_year=2024,
    key='percentile', percentile=85, index='ndvi'
)

ndvi.get_gif(name='ndvi_evolution.gif')
Yes, it makes nice GIFs — but it's much more than that.
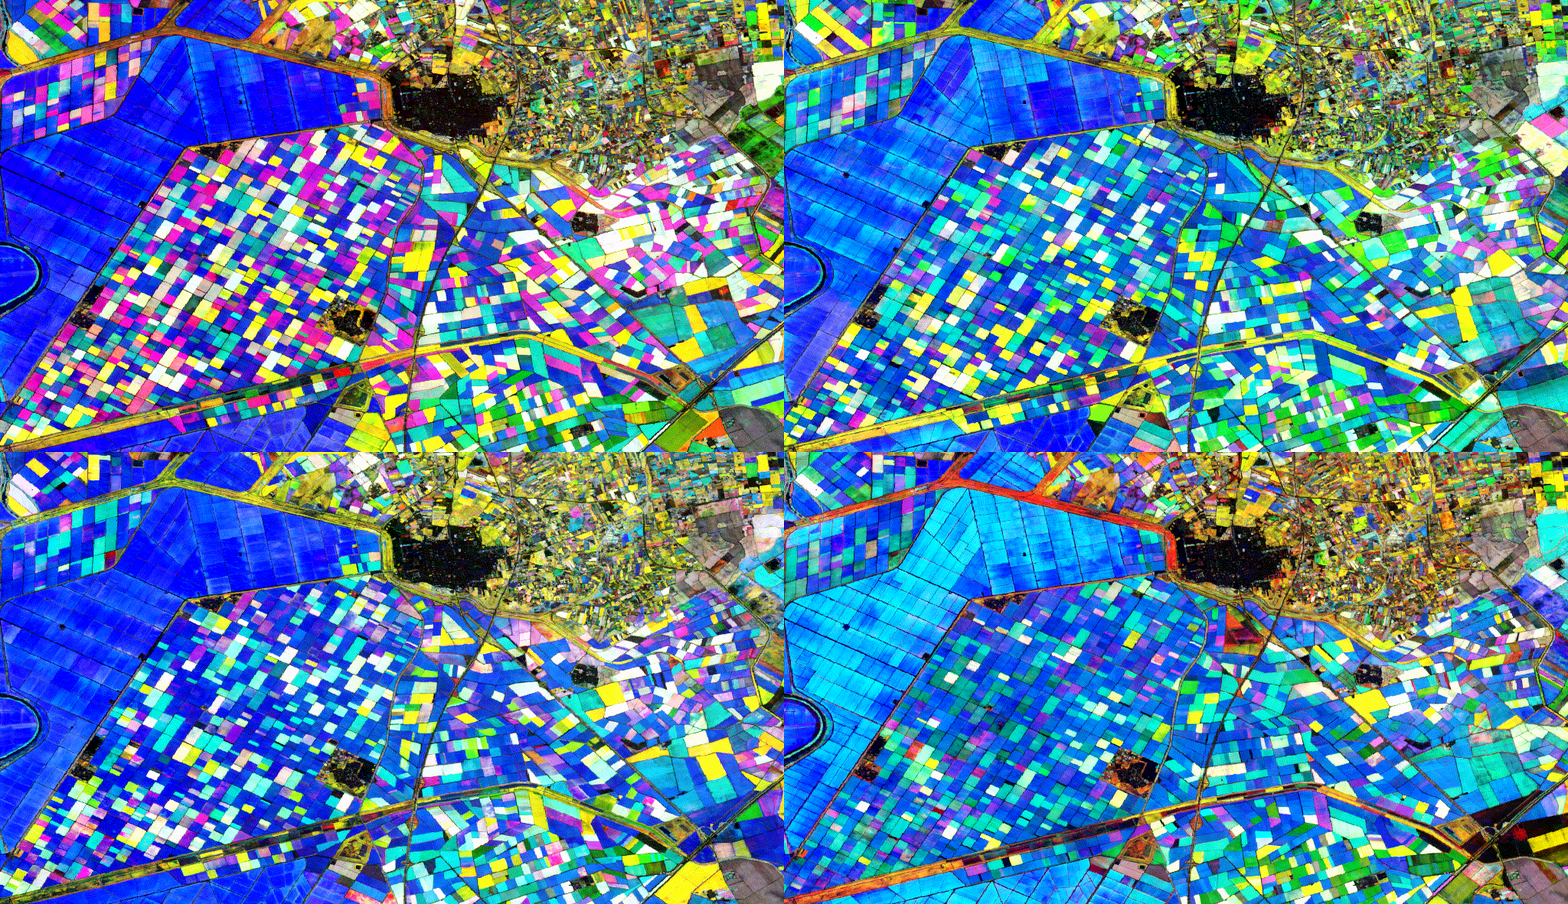
What you can do with it
- Compute pixel-wise statistics over any region and time span — seasonal medians, percentiles, multi-year aggregations, or dispersion (std, variance, range, CV) to map variability instead of level
- Monitor 40+ indices across Sentinel-1/2/3, Landsat (4–9), MODIS, ERA5-Land, CHIRPS, and nighttime lights (VIIRS, DMSP-OLS)
- Map the timing of a maximum with
get_peak_period()— the month of peak greenness, of deepest flooding, of brightest nighttime light - Analyse wetland hydroperiod and multi-year flood anomalies with
HydroperiodAnalyzer - Detect trends and phenology (SOS, EOS, POS, Length of Season) with
TimeSeriesAnalyzer - Classify land cover with multi-temporal feature stacks and Random Forest, SVM, or K-means
- Preprocess Sentinel-1 SAR with terrain correction and speckle filtering
- Export to GeoTIFF, Google Drive, or Earth Engine Assets
- Use any ROI: shapefile, GeoJSON, drawn geometry, eLTER DEIMS ID, Sentinel-2 tile, or Landsat path/row
Supported Sensors
Sentinel-1 (SAR) · Sentinel-2 SR · Sentinel-3 OLCI · Landsat 4–9 SR · MODIS MOD09A1 · ERA5-Land · CHIRPS · VIIRS (monthly and daily) · DMSP-OLS
Contributing
Bug reports and feature requests: GitHub Issues
Pull requests are welcome. See CONTRIBUTING.md for guidelines — it includes step-by-step instructions for adding new indices and datasets.
Citation
If you use Ndvi2Gif in your research, please cite the JOSS paper:
@article{GarciaDiaz2026,
  author    = {García Díaz, Diego},
  title     = {Ndvi2Gif: A Python Package for Multi-Seasonal Remote Sensing Analysis with Google Earth Engine},
  journal   = {Journal of Open Source Software},
  year      = {2026},
  volume    = {11},
  number    = {124},
  pages     = {10654},
  publisher = {The Open Journal},
  doi       = {10.21105/joss.10654},
  url       = {https://doi.org/10.21105/joss.10654}
}
Acknowledgments
Special thanks to Qiusheng Wu for his invaluable work in developing and promoting open-source geospatial software, to the Google Earth Engine team, and to the broader open-source geospatial community.
License
MIT — see LICENSE.txt
1 maintainer

Metadata
1 maintainer
Release files for ndvi2gif 1.6.3
For a detailed explanation of source distributions (sdists) and built distributions (wheels), please see the package formats documentation.
Source distribution (sdist)
| File | Size | Uploaded | |
|---|---|---|---|
| ndvi2gif-1.6.3.tar.gz | 187.6 kB | Details |
Built distribution (wheel)
| File | Interpreter | ABI | Platform | Reset |
|---|---|---|---|---|
| ndvi2gif-1.6.3-py3-none-any.whl | Python 3 | none | any | Details |
Total release size: 332.2 kB
Release files / ndvi2gif-1.6.3.tar.gz
| Download URL | ndvi2gif-1.6.3.tar.gz |
|---|---|
| Size | 187.6 kB |
| Tags | Source |
|
SHA-256 checksum How to use checksums |
db4637ccb318b977be8dfdf8f67702bf2f8e6692eb8580541ff8dc16f738a032
|
|
BLAKE2b-256 checksum How to use checksums |
9eb142442e2a033247f49c03aa981fa650468b3939fff9c9acac2ff7f34ee4d4
|
| Upload date | |
|
Uploaded using Trusted Publishing? What is trusted publishing? |
No |
| Uploaded via |
twine/7.0.0 CPython/3.12.14
|
Release files / ndvi2gif-1.6.3-py3-none-any.whl
| Download URL | ndvi2gif-1.6.3-py3-none-any.whl |
|---|---|
| Size | 144.6 kB |
| Tags | Python 3 |
|
SHA-256 checksum How to use checksums |
d727c3273023f1db48cb97173f335fe3cbfe895658a44cbf2d5aea4a4fb82589
|
|
BLAKE2b-256 checksum How to use checksums |
a69491666c53dc5432c362b6fc6ccadd22e18597aa12615b1776339f078b6536
|
| Upload date | |
|
Uploaded using Trusted Publishing? What is trusted publishing? |
No |
| Uploaded via |
twine/7.0.0 CPython/3.12.14
|














