Neuroimaging Results Visualization
Project description
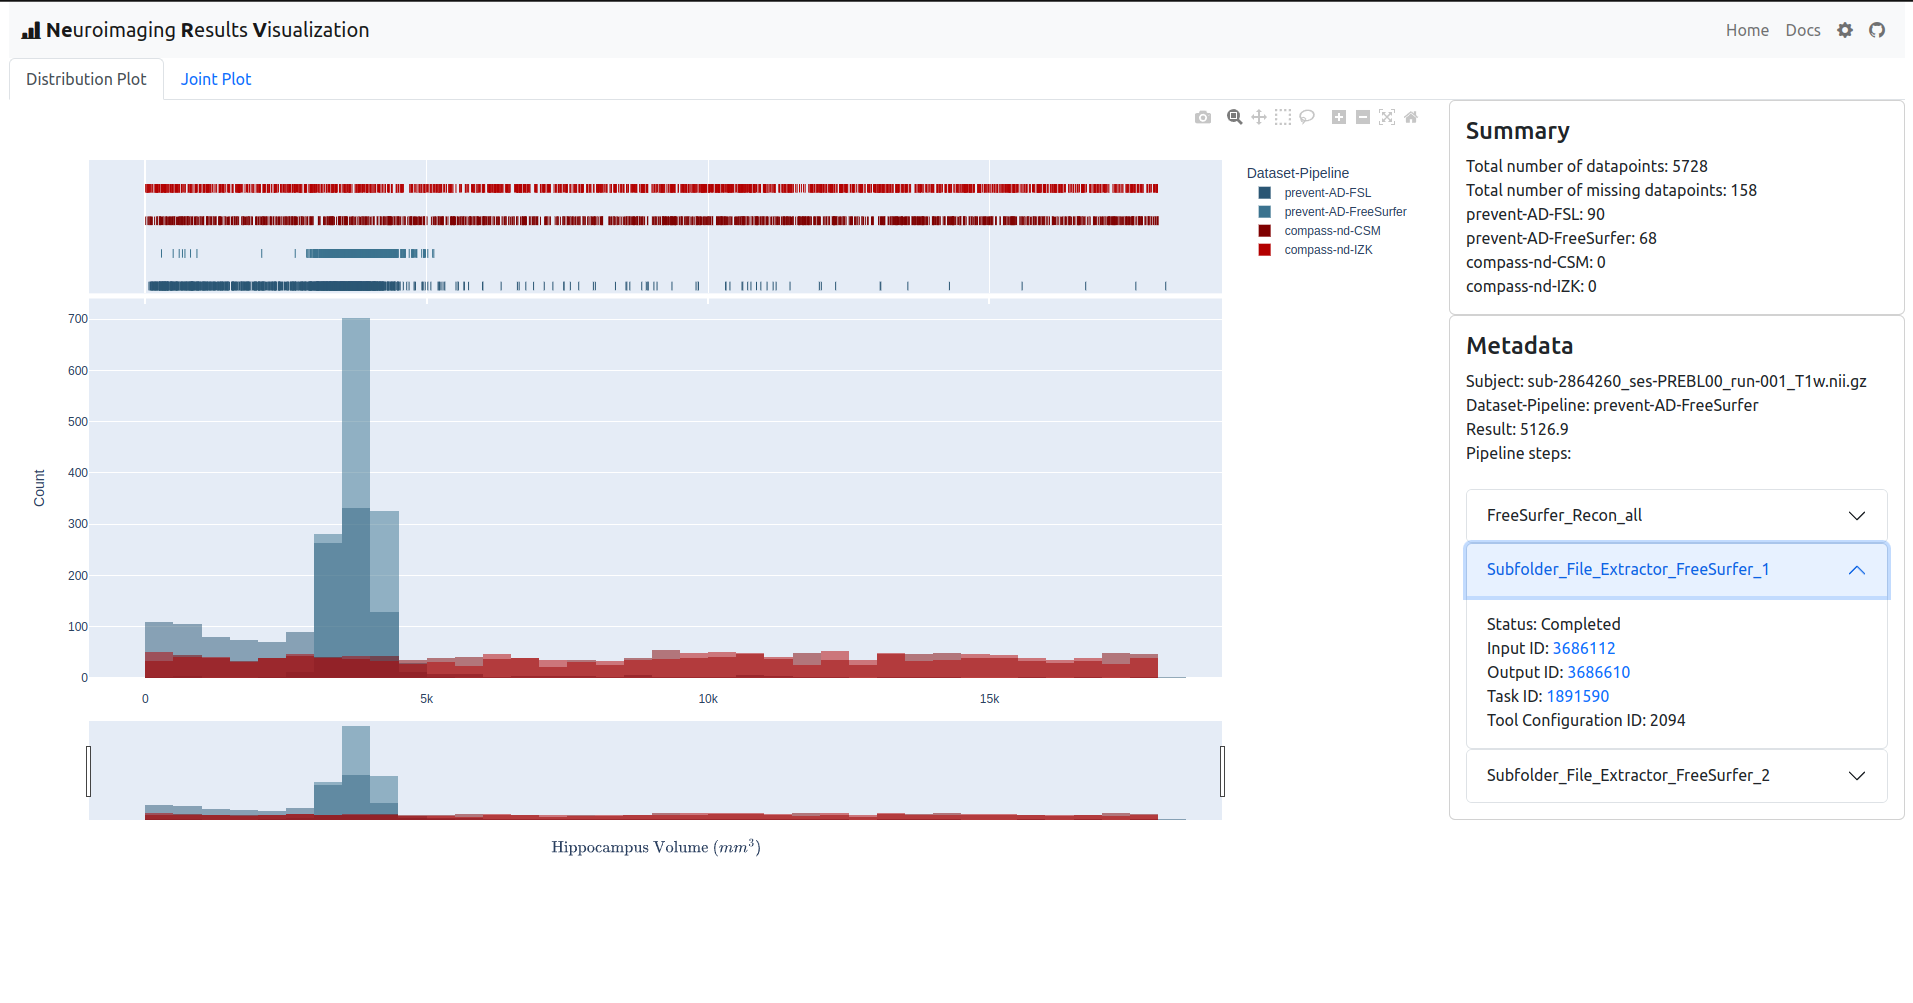
Neuroimaging Results Visualization (NeRV) is a web interface developed in Python using Plotly Dash, Dash Bootstrap Components, and pandas for visualization of neuroimaging results obtained from continuous testing of neuroimaging data across software pipelines.
Getting Started
Installation
pip install nerv
In order for NeRV to generate and populate plots the underlying app requires access to the directory containing the datasets. The path to directory can be passed to the app module as input to the start function.
Example usage
from nerv import app

app.start("path-to-data-directory")
After executing the file containing the above code snippet, a local server is started at port 8050 (by default). You can access the running NeRV application using a browser through the URL localhost:8050.
Deployment
Work in progress
License
This project is licensed under the terms of MIT License.
Project details
Release history Release notifications | RSS feed
Download files
Download the file for your platform. If you're not sure which to choose, learn more about installing packages.


