NestedGridPlotter is based on matplotlib and intends to simplify the plotting of nestedgrid by providing a objected oriented class.

Project description


🚀 Quick start
To install nested-grid-plotter functionality, see the installation instructions.
For a deep overview of nested-grid-plotter functionality, see the user guide.
You can also refer to the API reference guide for an exhaustive list of all what is possible with nested-grid-plotter.
🎯 Motivations
NestedGridPlotter is based on matplotlib and intends to simplify the plotting of nestedgrid by providing a objected oriented class.
import nested_grid_plotter as ngp

plotter = ngp.NestedGridPlotter(
    ngp.Figure(
        constrained_layout=True,  # Always use this to prevent overlappings
        figsize=(10, 5),
    ),
    builder=ngp.SubfigsBuilder(
        nrows=1,
        ncols=2,
        sub_builders={
            "the_left_sub_figure": ngp.SubplotsMosaicBuilder(
                mosaic=[["lt1", "lt1"], ["lb1", "rb1"]],
                gridspec_kw=dict(height_ratios=[2, 1], width_ratios=[2, 1]),
                sharey=False,
            ),
            "the_right_sub_figure": ngp.SubplotsMosaicBuilder(
                mosaic=[["l2", "rt2"], ["l2", "bt2"]],
                gridspec_kw=dict(height_ratios=[2, 1], width_ratios=[2, 1]),
                sharey=False,
            ),
        },
    ),
)
plotter.identify_axes()  # Helper to add the name of the axis on the plot
plotter.fig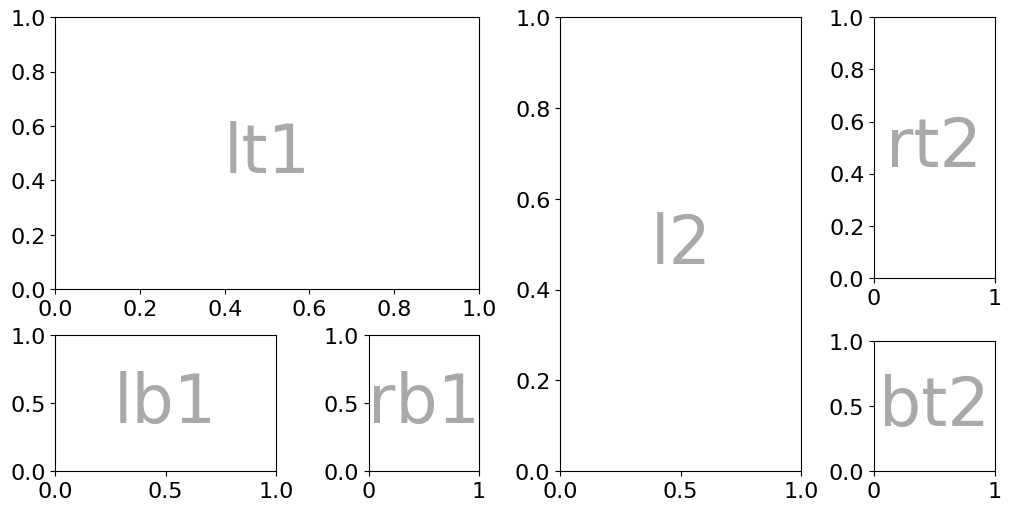
Example of figure with nested figures and axes built using nested_grid_plotter.
It provide multiple utilities such as grid alignment:
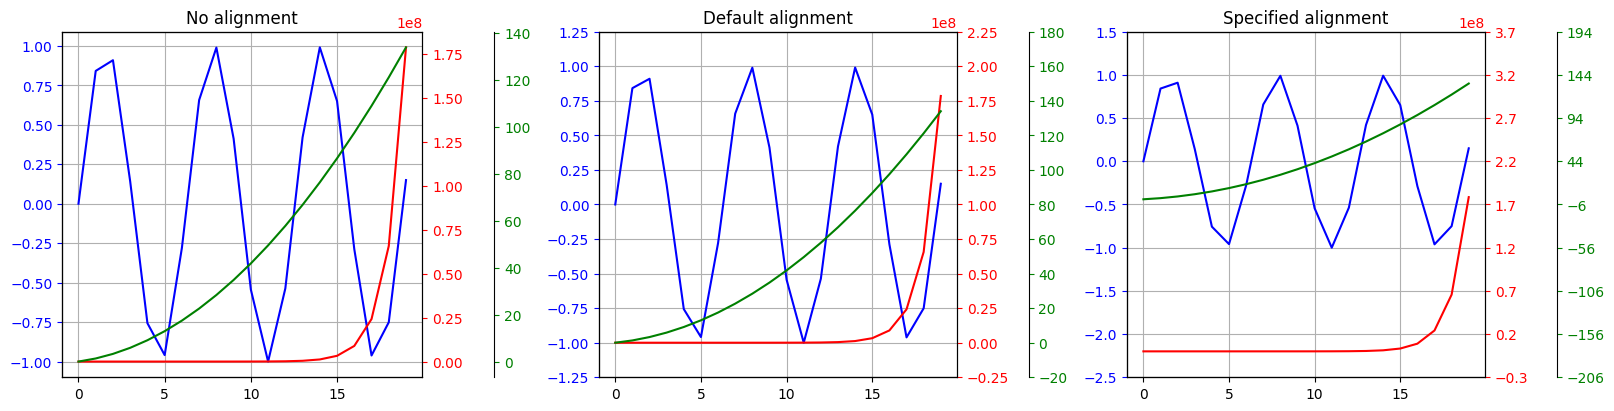
Example of grid ticks alignment made easy thanks to nested_grid_plotter.
As well as wrapper for complex plots and animations.
Example of complex animation built using nested_grid_plotter.
It also allows to make legend positioning and gathering flexible and simpler with some automatic placement solvers:
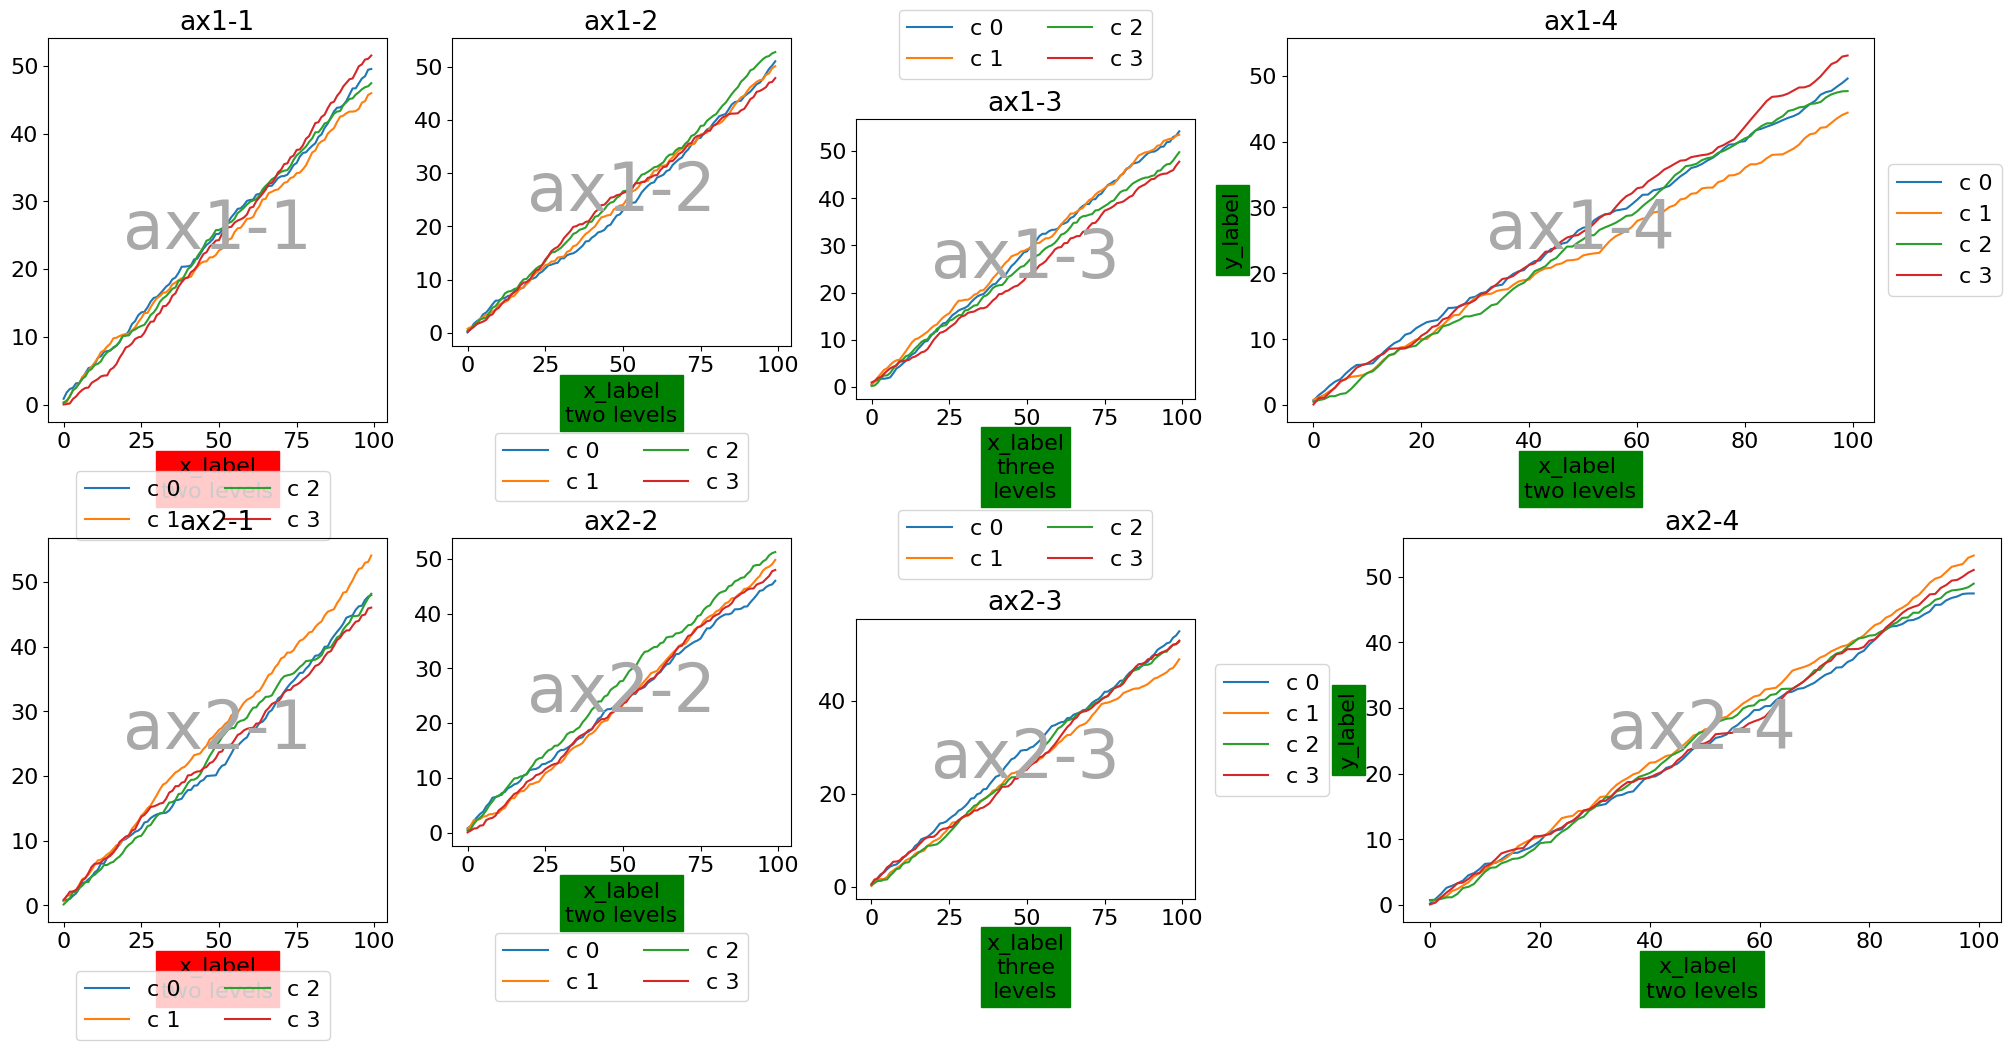
Example of figure with semi-automatic legend placement to avoid overlappings with axis labels and plots.
The complete and up to date documentation can be found here: https://nested_grid_plotter.readthedocs.io.
In addition to simplifying the matplotlib workflow, our focus are:
To provide understandable, modern code using the high-level language python, while using typing, explicit function names and standardized formatting thanks to Ruff and ty;
To provide detailed and explicit documentation;
To offer totally free code, including for commercial use, thanks to the BSD 3-Clause License;
🖋️ How to cite
If you use this piece of software in your work, please cite it as:
Collet, A. (2026). NestedGridPlotter - A matplotlib wrapper for nested grids and some more.
Zenodo. DOI: `10.5281/zenodo.18121868` https://doi.org/10.5281/zenodo.18121868
📧 Contact
For questions, suggestions, or contributions, you can reach out via:
We welcome contributions!
🔑 License
This project is released under the BSD 3-Clause License.
Copyright (c) 2026, Antoine COLLET. All rights reserved.
For more details, see the LICENSE file included in this repository.
⚠️ Disclaimer
This software is provided “as is”, without warranty of any kind, express or implied, including but not limited to the warranties of merchantability, fitness for a particular purpose, or non-infringement. In no event shall the authors or copyright holders be liable for any claim, damages, or other liability, whether in an action of contract, tort, or otherwise, arising from, out of, or in connection with the software or the use or other dealings in the software.
By using this software, you agree to accept full responsibility for any consequences, and you waive any claims against the authors or contributors.
Release history Release notifications | RSS feed


Download files
Download the file for your platform. If you're not sure which to choose, learn more about installing packages.
Source Distribution
Built Distribution
Filter files by name, interpreter, ABI, and platform.
If you're not sure about the file name format, learn more about wheel file names.
Copy a direct link to the current filters
File details
Details for the file nested_grid_plotter-2.1.1.tar.gz.
File metadata
- Download URL: nested_grid_plotter-2.1.1.tar.gz
- Upload date:
- Size: 4.2 MB
- Tags: Source
- Uploaded using Trusted Publishing? No
- Uploaded via: twine/6.0.1 CPython/3.11.5
File hashes
| Algorithm | Hash digest | |
|---|---|---|
| SHA256 |
2ee4d0937a5c7e9113be7ddad8ff70f022885bde2428aa1db4612c75efb9cea3
|
|
| MD5 |
c4ce32a5a6b694664e87d1fc117c2698
|
|
| BLAKE2b-256 |
4726a283089760ea71c323da788e699df2f8f181a58cddce40ac006d7fa74661
|
File details
Details for the file nested_grid_plotter-2.1.1-py3-none-any.whl.
File metadata
- Download URL: nested_grid_plotter-2.1.1-py3-none-any.whl
- Upload date:
- Size: 292.5 kB
- Tags: Python 3
- Uploaded using Trusted Publishing? No
- Uploaded via: twine/6.0.1 CPython/3.11.5
File hashes
| Algorithm | Hash digest | |
|---|---|---|
| SHA256 |
20f4d4bd1a8eae1582f387de91ac53b0d8427592879f27e5c1541ea06cd69f41
|
|
| MD5 |
33b705ccf48a4a17e5ca7b50488a74af
|
|
| BLAKE2b-256 |
868d6325e38f3ecbb2eef667aaf3fe5aade83c383e147f646850353eb1e2613d
|


