
Netwatch TUI (netwatchpy)


A TUI (Text-based User Interface) for monitoring network usage in real-time, with support for data limits and desktop notifications.
Features
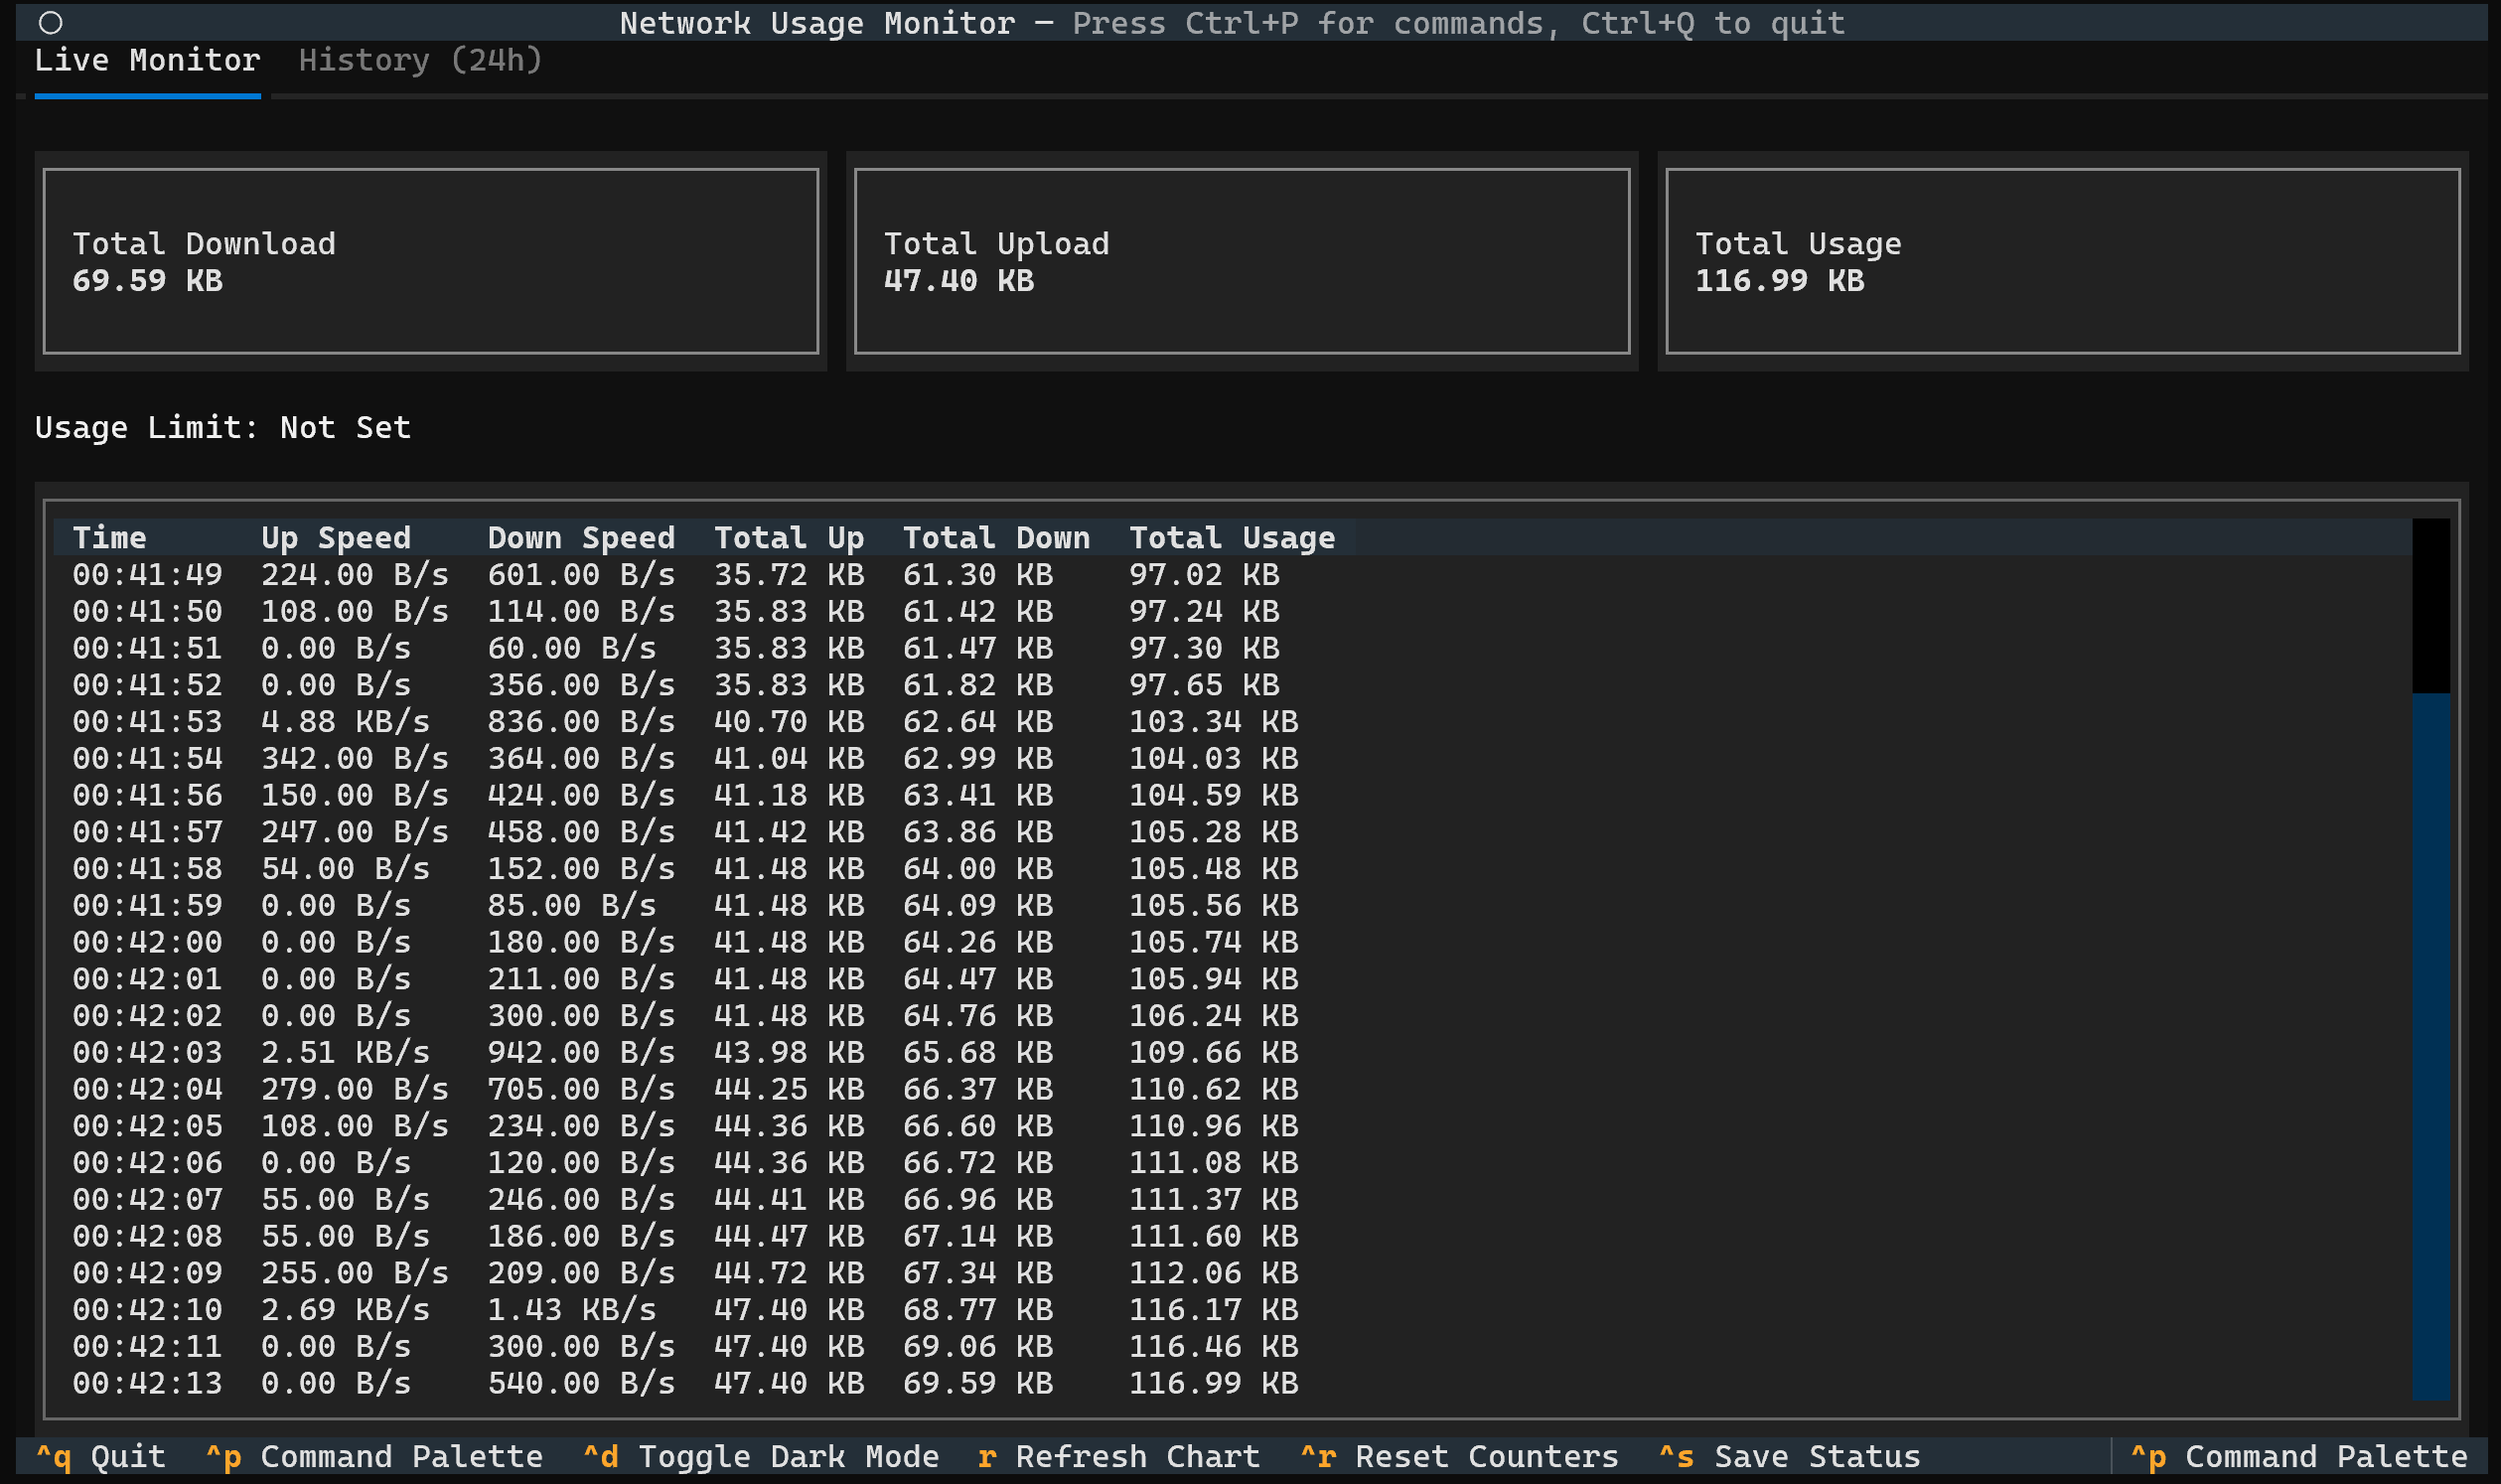
- Real-time Dashboard: A clean, terminal-based dashboard showing total download, upload, and current speeds.
- Per-Interface Monitoring: Inspect bandwidth, upload/download speeds, and live 2D activity graphs segmented per active network adapter (e.g., Wi-Fi, Ethernet) with automatic loopback filtering.
- Historical Analytics: View your usage trends for the last 24 hours with hourly breakdown, peak hour identification, and traffic statistics including download/upload percentages and average usage.
- Crash-Proof Database: Powered by SQLite with Write-Ahead Logging (WAL) to ensure your data is safe even if your PC loses power.
- Automated Data Retention & Downsampling: Automatically compresses older records into hourly averages (min, max, average speeds) and purges raw records older than the retention threshold (default: 7 days) to prevent database bloat.
- Data Cap Monitoring: Set a data limit (e.g.,
10GB) and see your usage on a real-time progress bar. - Standalone Binaries: Available as a single .exe or binary file, that way no Python installation is required but no.
Note: Double-clicking the file launches the Basic Monitor (all interfaces, no limit). To set Data Caps or Filters, run the file via Command Prompt/Terminal.
- Smart Units: Toggle between Bits (Mbps) and Bytes (MB/s) instantly with Ctrl+B to match ISP speeds or file sizes.
- Desktop Notifications: Get native desktop notifications when you hit 80% and 100% of your data limit.
- Live Activity Log: An interactive, scrolling log of all network activity, updated every second.
- Command Palette & Dark Mode: A modern TUI experience with a built-in command palette (
Ctrl+P) and dark mode support (Ctrl+D). - Auto-Migration: Automatically detects and imports data from older versions (
quota.json) so you never lose history. - Cross-Platform: Runs perfectly on Windows, macOS, and Linux.
Installation
Option 1: Standalone Binary (Easiest)
No Python required.
- Download
netwatch-windows.exefrom the Releases Page. - Basic Usage: Double-click the file to start monitoring immediately.
- Advanced Usage: To set limits (e.g.,
-l 10GB), open your terminal (PowerShell/CMD) in the download folder and run:.\netwatch-windows.exe -l 10GB
Option 2: Install via PyPI (Recommended for CLI)
Designed for Python 3.8+ and distributed on PyPI for simple installation with pip.
pip install netwatchpy
Usage
Once installed, the netwatch command will be available in your terminal.
To start the monitor (monitors all interfaces):
netwatch
To see all available options and help:
netwatch --help
Command-Line Arguments
You can control the monitor with these arguments:
-
-h,--help- Shows the help message and all options.
-
-i INTERFACE,--interface INTERFACE- Monitors a single, specific network interface (e.g., -i "Wi-Fi"). Defaults to "all".
-
-l LIMIT,--limit LIMIT- Sets a data cap and shows a progress bar (e.g., -l "10GB" or -l "500MB").
-
--log LOG- Saves all network activity to a specified CSV file (e.g., --log "usage.csv").
-
--retention-days RETENTION_DAYS- Sets the retention policy in days for granular 1-second records (default:
7). Records older than this are rolled up into hourly summaries before purging.
- Sets the retention policy in days for granular 1-second records (default:
Examples
Set a 10GB data limit:
netwatch -l "10GB"
Set custom data retention (e.g., 14 days):
netwatch --retention-days 14
Monitor a specific interface ("Wi-Fi") and log to a file:
netwatch -i "Wi-Fi" --log "my_usage.csv"
In-App Keybindings
-
Ctrl+p: Open the Command Palette -
Ctrl+d: Toggle Dark / Light Mode -
Ctrl+b: Toggle Bits/Bytes (Mbps ↔ MB/s) -
r: Refresh the history chart -
Ctrl+r: Reset all counters and history to zero -
Ctrl+s: Show save status (Data is auto-saved) -
Ctrl+q: Quit the application
Understanding the Interface
1. Live Monitor Tab
This is the default view. It shows:
-
Summary Cards: Total Upload, Download, and Combined Usage for the current session + history.
-
Quota Bar: If a limit was set, this bar fills up. It turns Yellow at 80% and Red at 100%.
-
Live Table: A scrolling list of network speeds recorded every second.
2. Per-Interface Tab
A split-pane view displaying segmented metrics for each active network interface:
- Sidebar (Left): Selectable list of active interfaces (virtual and loopback connections are filtered out).
- Metrics Cards (Right): Current download/upload speeds, session totals, and hardware adapter totals for the selected interface.
- Real-time Activity Graph: An uncluttered 2D waveform chart plotting live traffic trends (
█= Download,░= Upload).
3. History Tab (24h)
This tab visualizes your traffic over the last 24 hours.
-
Rows: Each row represents a 1-hour block of time (e.g., 14:00 covers 2:00 PM to 2:59 PM).
-
The Bar:
-
Solid Block (█): Represents Download traffic.
-
Shaded Block (░): Represents Upload traffic.
-
-
Total: The text on the right shows the exact data transferred during that hour.
Tip: If the graph looks outdated, press r to pull the latest stats from the database.
Bug Reports & Feature Requests
Found a bug or have a great idea? Please open an issue on the GitHub repository.
License
This project is licensed under the MIT License.
1 maintainer

Metadata
1 maintainer
Release files for netwatchpy 1.4.0
For a detailed explanation of source distributions (sdists) and built distributions (wheels), please see the package formats documentation.
Source distribution (sdist)
| File | Size | Uploaded | |
|---|---|---|---|
| netwatchpy-1.4.0.tar.gz | 24.0 kB | Details |
Built distribution (wheel)
| File | Interpreter | ABI | Platform | Reset |
|---|---|---|---|---|
| netwatchpy-1.4.0-py3-none-any.whl | Python 3 | none | any | Details |
Total release size: 43.1 kB
Release files / netwatchpy-1.4.0.tar.gz
| Download URL | netwatchpy-1.4.0.tar.gz |
|---|---|
| Size | 24.0 kB |
| Tags | Source |
|
SHA-256 checksum How to use checksums |
df66e7e48ed45c101d386b4e0da5b3d2b0059f77b094d6b580cdd4023da1ab50
|
|
BLAKE2b-256 checksum How to use checksums |
6c3e7461ce6ec0377482d29620a135ccbff25dcba5128719e8fc6436ff546d2d
|
| Upload date | |
|
Uploaded using Trusted Publishing? What is trusted publishing? |
No |
| Uploaded via |
twine/7.0.0 CPython/3.13.14
|
Release files / netwatchpy-1.4.0-py3-none-any.whl
| Download URL | netwatchpy-1.4.0-py3-none-any.whl |
|---|---|
| Size | 19.1 kB |
| Tags | Python 3 |
|
SHA-256 checksum How to use checksums |
75eb65d5d471263a1343685aa9e093a92775a4d058c2c7d7dbe997275a4b1821
|
|
BLAKE2b-256 checksum How to use checksums |
81953985af77857aab8456db424f885be45438f0a8da95fba7a00f25feb8b7fa
|
| Upload date | |
|
Uploaded using Trusted Publishing? What is trusted publishing? |
No |
| Uploaded via |
twine/7.0.0 CPython/3.13.14
|














