A tool for quick and easy preprocessing and visualization of fNIRS data

Project description
neuropipeline
neuropipeline is a lightweight wrapper around MNE-Python and MNE-NIRS that provides a simple, chainable API for fNIRS preprocessing and visualization.
Installation
pip install neuropipeline
Requires mne and mne-nirs:
pip install mne mne-nirs
Quick Start
from neuropipeline import fNIRS
from neuropipeline.fnirs import visualizer

f = fNIRS("path/to/data.snirf")

# Standard preprocessing pipeline (chainable)
f.to_optical_density().tddr().to_hemoglobin().bandpass(0.01, 0.1)

# Export processed data
f.to_snirf("path/to/processed.snirf")

# Visualize
visualizer.open(f)
Preprocessing
All methods return self and can be chained:
| Method | Description |
|---|---|
to_optical_density() |
Raw intensity → optical density |
tddr() |
TDDR motion correction |
to_hemoglobin(ppf=6.0) |
Optical density → HbO/HbR (Beer-Lambert) |
bandpass(low, high) |
Bandpass filter (default 0.01–0.1 Hz) |
short_channel_regression() |
Systemic artifact removal via short channels |
resample(sfreq) |
Resample to new sampling frequency |
crop(tmin, tmax) |
Crop recording to time window |
pick_long_channels() |
Keep only long-separation channels |
pick_short_channels() |
Keep only short-separation channels |
Preprocessor Pipeline
For a configurable, reusable pipeline use fNIRSPreprocessor:
from neuropipeline import fNIRS
from neuropipeline.fnirs.preprocessor import fNIRSPreprocessor

f = fNIRS("path/to/data.snirf")

pp = fNIRSPreprocessor(
    optical_density=True,
    motion_correction=True,
    short_channel_regression=False,
    hemoglobin=True,
    bandpass=True,
    bandpass_low=0.01,
    bandpass_high=0.1,
    ppf=6.0,
)
pp.print()       # inspect settings
f.preprocess(pp) # apply pipeline
Or with the builder interface:
pp = (fNIRSPreprocessor()
      .set_bandpass(0.01, 0.2)
      .set_short_channel_regression(True)
      .set_motion_correction(False))
f.preprocess(pp)
Export
# SNIRF (v1.1) — works at any processing stage
f.to_snirf("output/processed.snirf")

# With AtlasViewer-compatible montage landmarks
f.to_snirf("output/processed.snirf", add_montage=True)

# CSV — channel data + events
f.to_csv("output/", name="subject01")
Visualization
from neuropipeline.fnirs import visualizer

# Optional configuration (call before open)
visualizer.set_spectrum_mode("PSD")           # "FFT" or "PSD"
visualizer.set_spectrogram_method("Wavelet")  # "STFT", "Wavelet", or "CMT"
visualizer.set_spectrogram_limits(0.0, 0.2)  # frequency range (Hz)
visualizer.set_marker_dictionary({
    "1": "Rest",
    "2": "Task A",
    "3": "Task B",
})

visualizer.open(f)
The visualizer requires hemoglobin data — run to_optical_density().to_hemoglobin() first.
Keyboard shortcuts: ←/→ navigate channels, Space toggles FFT/PSD, Esc closes.
Advanced: Access MNE Directly
The underlying MNE Raw object is always available for advanced operations:
f = fNIRS("data.snirf")
f.to_optical_density().tddr().to_hemoglobin()

raw = f.raw  # mne.io.Raw

# Use any MNE function directly
epochs = f.epochs(tmin=-1.0, tmax=10.0)
events, event_id = f.events()

# Get numpy arrays
hbo, hbo_names = f.get_hbo()  # (channels, samples), [names]
hbr, hbr_names = f.get_hbr()
Example: Full Pipeline
from neuropipeline import fNIRS
from neuropipeline.fnirs import visualizer

f = fNIRS("raw.snirf")

(f.to_optical_density()
   .tddr()
   .to_hemoglobin()
   .bandpass(0.01, 0.1))

f.to_snirf("processed.snirf")

visualizer.set_spectrogram_method("STFT")
visualizer.open(f)
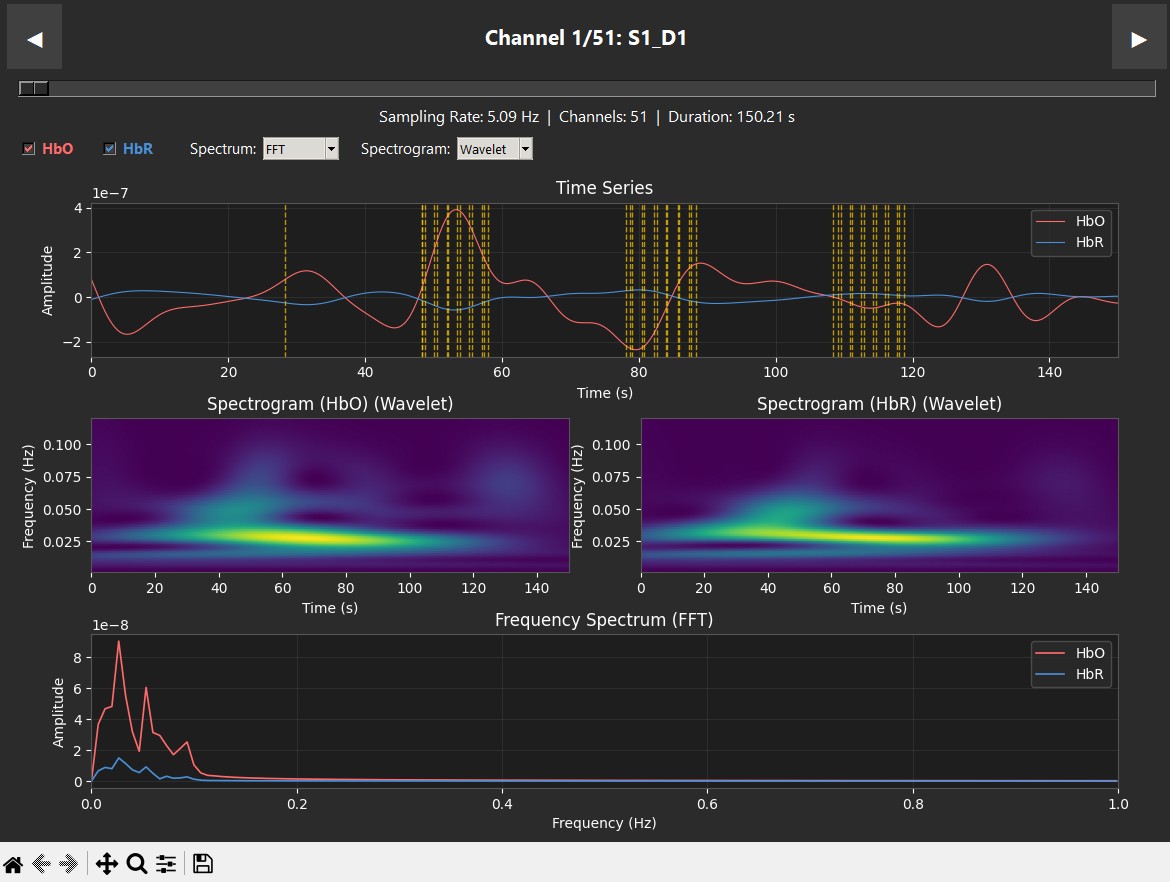
Analysis Example: Heel Stimulation
These plots display data from a single subject during a robotic heel-stimulation experiment, showing the Time Series, Spectrogram, and Frequency (PSD/FFT) for two different scenarios. The vertical dashed lines indicate markers showing when stimulation occurred.
 |
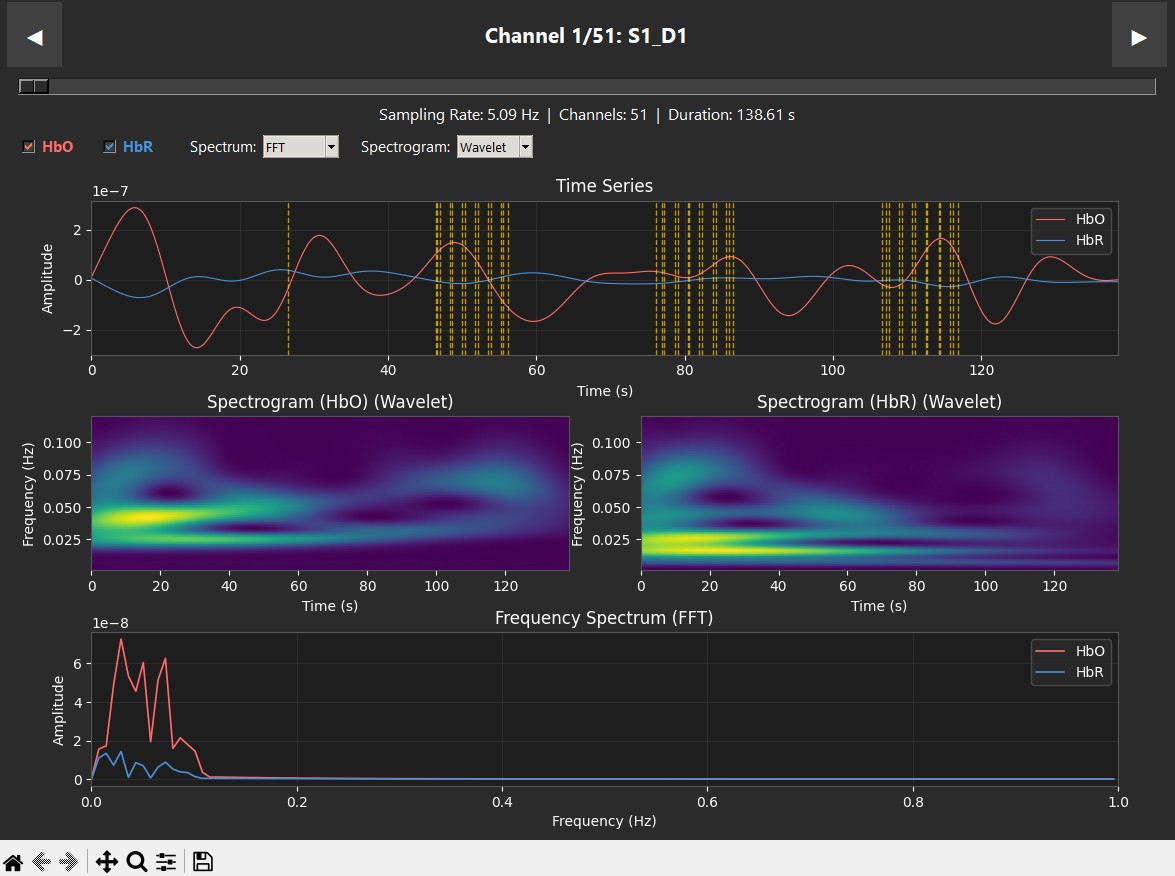 |
| Supination — clear HbO response | Pronation — low activity |
Release history Release notifications | RSS feed


Download files
Download the file for your platform. If you're not sure which to choose, learn more about installing packages.
Source Distribution
Built Distribution
Filter files by name, interpreter, ABI, and platform.
If you're not sure about the file name format, learn more about wheel file names.
Copy a direct link to the current filters
File details
Details for the file neuropipeline-0.3.0.tar.gz.
File metadata
- Download URL: neuropipeline-0.3.0.tar.gz
- Upload date:
- Size: 37.1 kB
- Tags: Source
- Uploaded using Trusted Publishing? No
- Uploaded via: twine/6.2.0 CPython/3.12.0
File hashes
| Algorithm | Hash digest | |
|---|---|---|
| SHA256 |
054a5c2bc29fde047336374cd813a05e3cbb430a52bdd32d6112211916229e1c
|
|
| MD5 |
e724bc85657e76a000306237345afdb2
|
|
| BLAKE2b-256 |
c0f6ff24c6eb5b604f5d2bce33356753812a6e0c86d29fbdaab1744541ab5ed8
|
File details
Details for the file neuropipeline-0.3.0-py3-none-any.whl.
File metadata
- Download URL: neuropipeline-0.3.0-py3-none-any.whl
- Upload date:
- Size: 40.2 kB
- Tags: Python 3
- Uploaded using Trusted Publishing? No
- Uploaded via: twine/6.2.0 CPython/3.12.0
File hashes
| Algorithm | Hash digest | |
|---|---|---|
| SHA256 |
44b9e6f4c58bead8576facea51e832d463c894f949181ad78c930da6a7fe2f97
|
|
| MD5 |
ef91faa757a055a29d663adaef75de42
|
|
| BLAKE2b-256 |
e0528a20c7a9c4de4cb249503e711c12cf0c72adf2c08ef37cf3f6ec54f8bcce
|


