
nextplot


Tools for plotting routes and clusters from JSON
Installation
pip install nextplot
Usage
If the installation succeeded, you should be able to invoke the following:
nextplot --help
Furthermore, use the route and cluster commands for the respective
plotting type. Find an overview of the arguments for the specific mode by
invoking nextplot route --help and nextplot cluster --help.
Above shows some information about how to use the script. Below presents some further information for running the script using route plotting as an example.
There are basically two options of running the script. Either feed the JSON to STDIN of the script like so:
cat examples/data/kyoto-route.json | nextplot route \
  --jpath_route "vehicles[*].route" \
  --jpath_x "position.lon" \
  --jpath_y "position.lat"
Or supply a path to the .json file like so:
nextplot route \
  --input_route examples/data/kyoto-route.json \
  --jpath_route "vehicles[*].route" \
  --jpath_x "position.lon" \
  --jpath_y "position.lat"
Both approaches will create a .png plot image and if possible (valid lon/lat
coordinates given) an interactive .html plot file. The filenames will be
plot.[png,html] for the first option, based on the input filename for the
second option and customized ones if --output_image and/or --output_map are
specified.
The input file is expected to have some JSON array of positions which can be
addressed using the notation described here:
https://goessner.net/articles/JsonPath/.
The path to the positions can be modified via the --jpath_route parameter.
For example, if your input file stores the locations like shown below, the path
"vehicles[*].route" will extract them. As you can see, the
path first goes through the vehicles. Next, [*] denotes that a list of
vehicles is expected, which in turn results in a list of routes. Finally,
.route points to the exact location of the route object per vehicle. The
--jpath_x and --jpath_y parameters are used to extract the longitude and
latitude values from the stop objects at position.lon and position.lat.
{
    "vehicles": [
        // ...
        {
            "id": "v1",
            "route": [
                {
                    "id": "v1-start",
                    "position": { "lon": 135.73723, "lat": 35.04381 }
                },
                {
                    "id": "Kinkaku-ji",
                    "position": { "lon": 135.728898, "lat": 35.039705 }
                },
                {
                    "id": "Nijō Castle",
                    "position": { "lon": 135.748134, "lat": 35.014239 }
                },
                {
                    "id": "Arashiyama Bamboo Forest",
                    "position": { "lon": 135.672009, "lat": 35.017209 }
                }
            ]
        }
        // ...
    ]
}
Further examples
A more detailed introduction and a plot gallery can be found here.
Preview
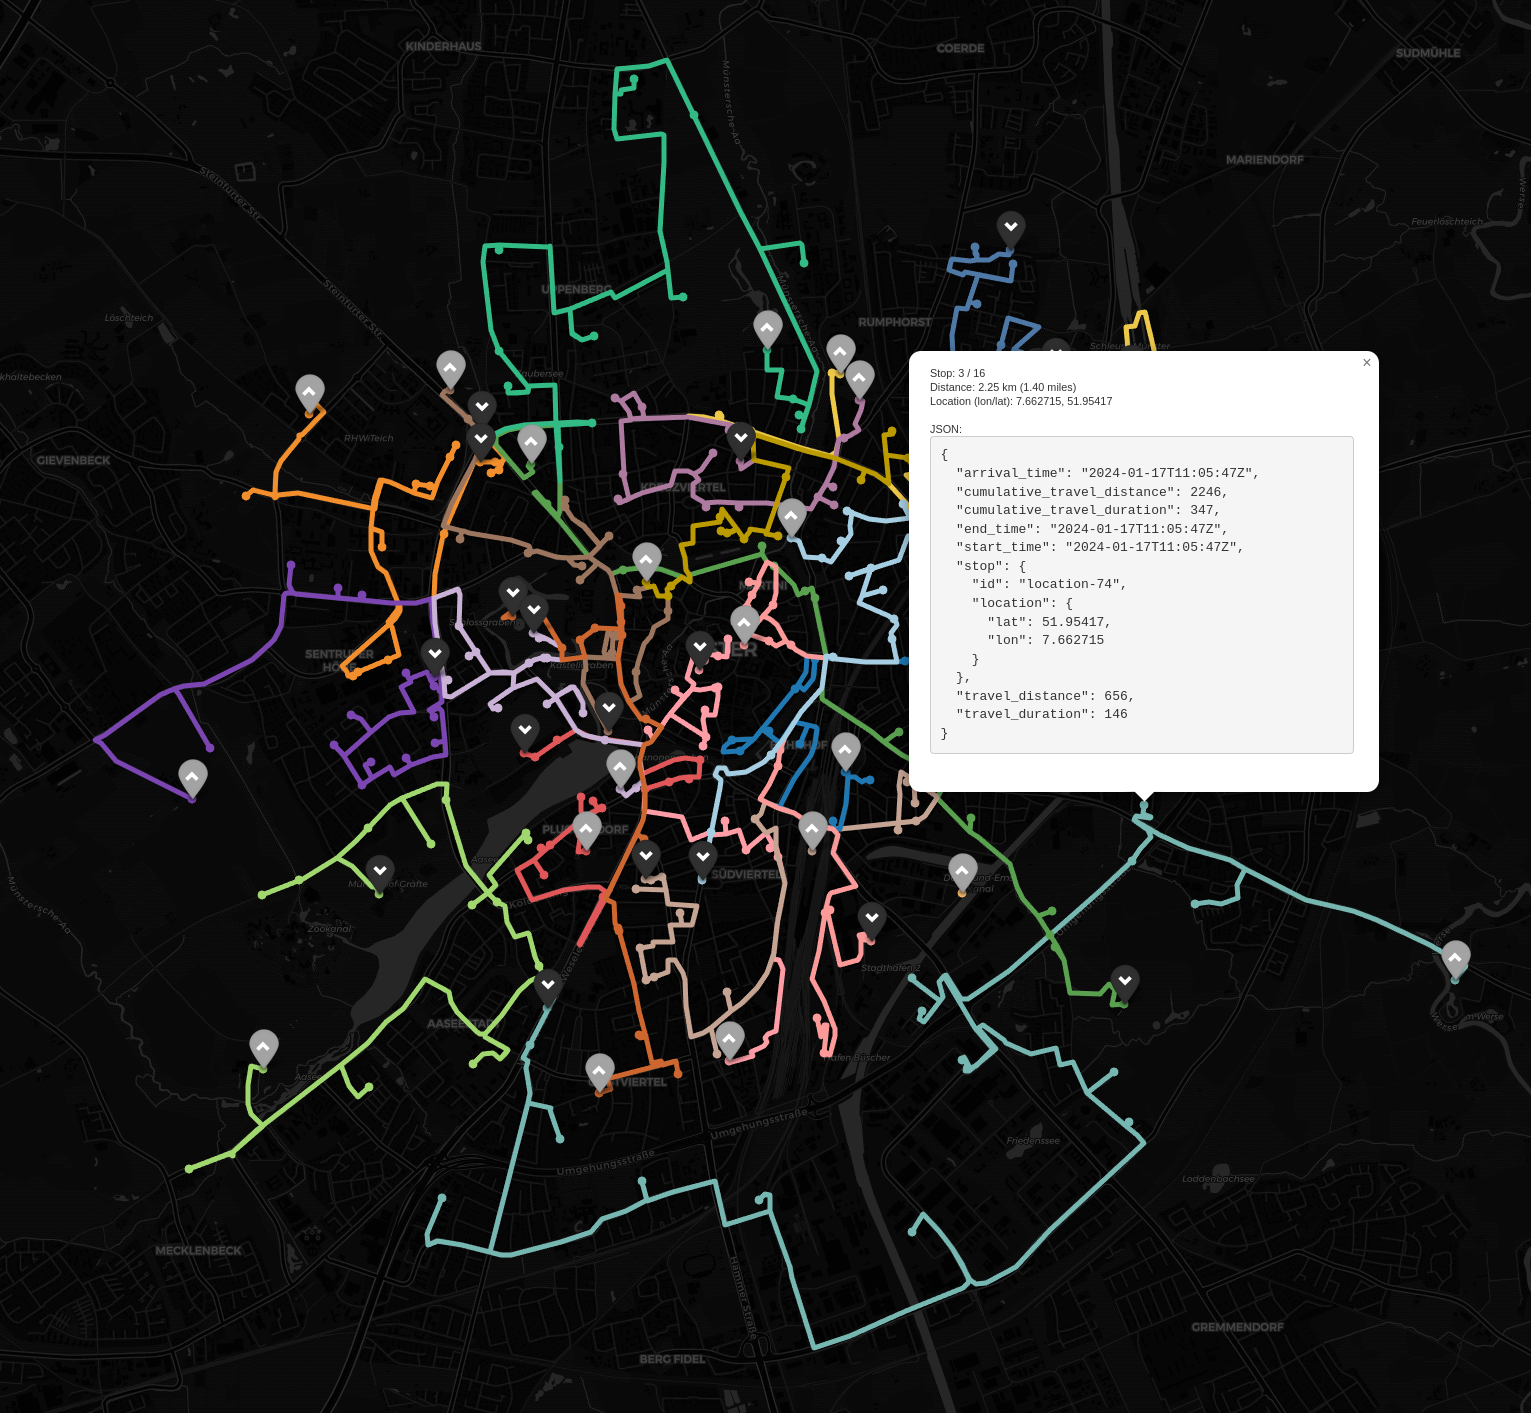
Preview route plot (screenshot of .html-file, cartodbdark_matter selected):
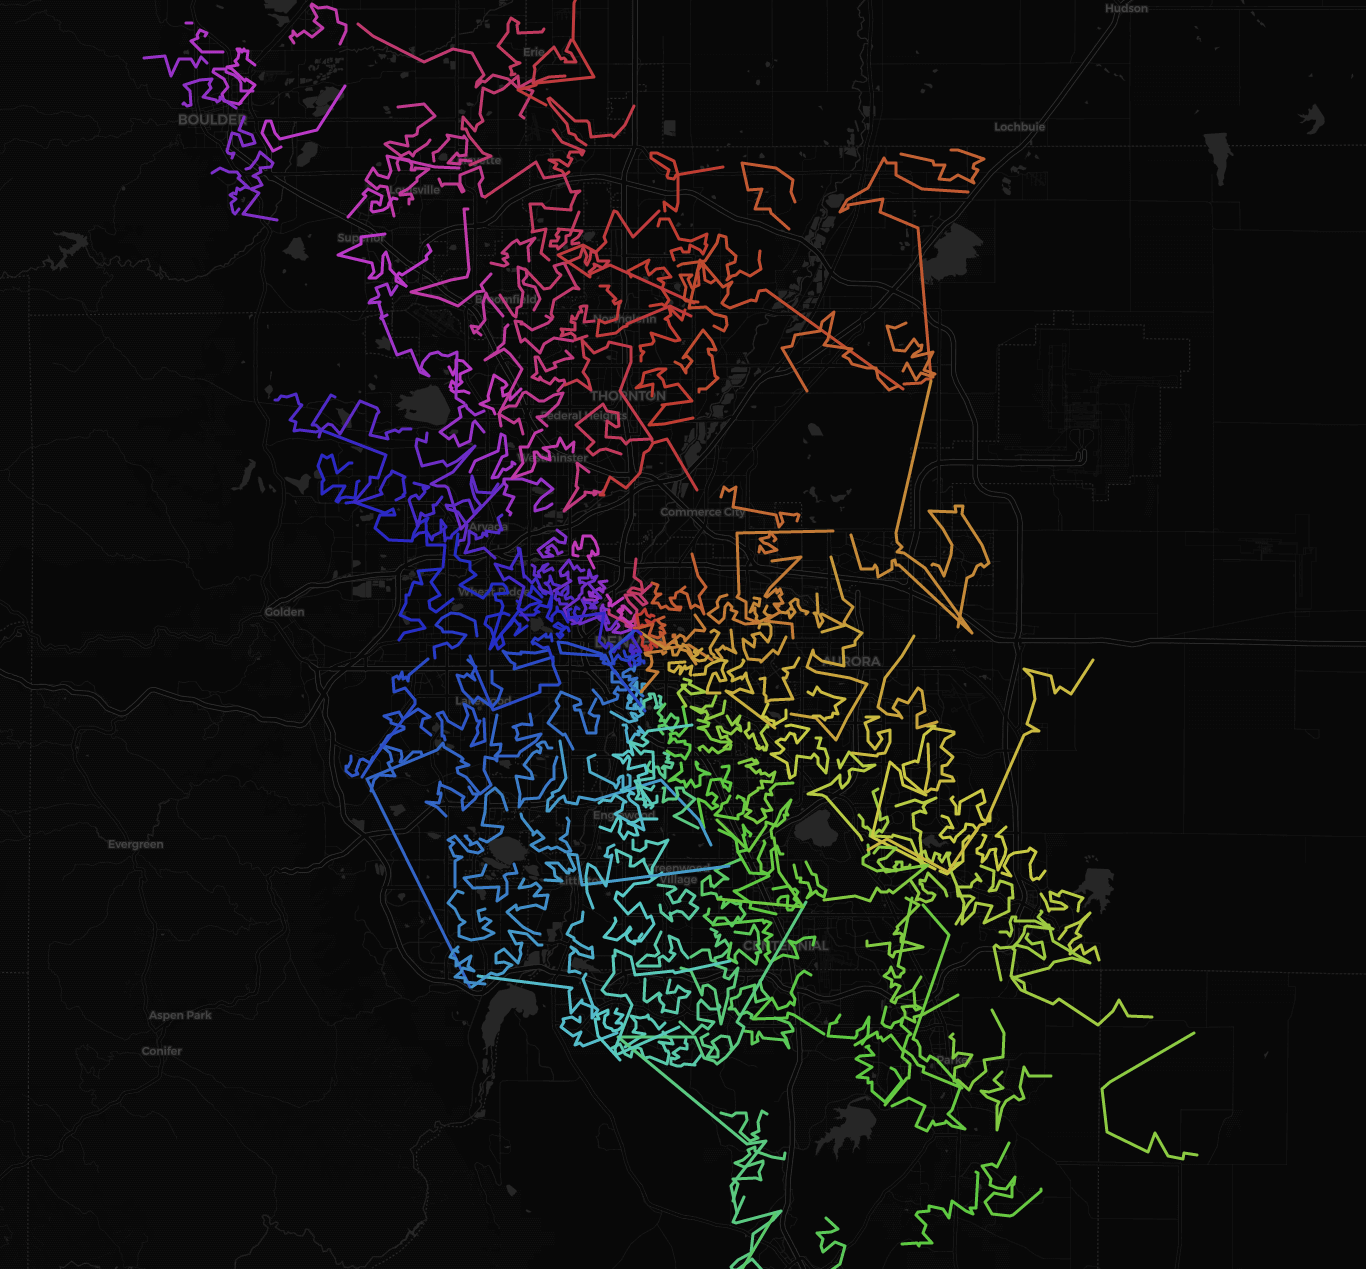
Another preview route plot (screenshot of .html-file, cartodbdark_matter selected):
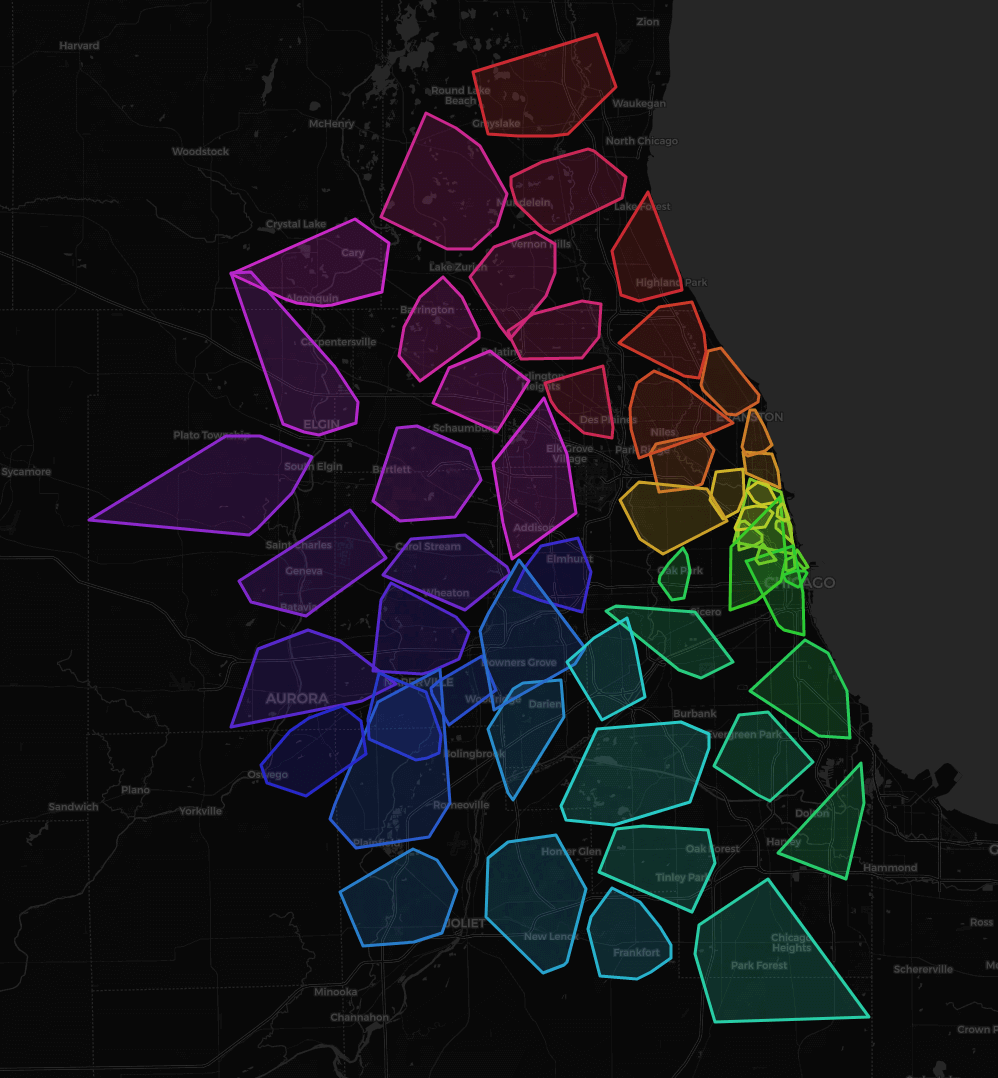
Preview cluster plot (screenshot of .html-file, cartodbdark_matter selected):
Auto-completion
Auto-completion (using tab) is supported via argcomplete. To enable it, install the package:
pip install argcomplete
Then, add the following line to your ~/.bashrc:
eval "$(register-python-argcomplete nextplot)"
Tests
Tests are located in tests/ and can be run via python -m pytest. Update test
expectations (golden files) by running UPDATE=1 python test_cli.py from the
test directory. Tests require specific versions of the dependencies to be
installed. These can be installed via pip install -r requirements-dev.txt.
It is recommended to update the expectations in a docker container to avoid
messing up local dependencies. This can be done by running the following
commands:
docker run --rm -it -v $(pwd):/app -w /app python:3.11 bash -c "pip install -r requirements-dev.txt && cd tests && UPDATE=1 python test_cli.py"
1 maintainer

Metadata
1 maintainer
Release files for nextplot 0.1.9
For a detailed explanation of source distributions (sdists) and built distributions (wheels), please see the package formats documentation.
Source distribution (sdist)
| File | Size | Uploaded | |
|---|---|---|---|
| nextplot-0.1.9.tar.gz | 5.5 MB | Details |
Built distribution (wheel)
| File | Interpreter | ABI | Platform | Reset |
|---|---|---|---|---|
| nextplot-0.1.9-py3-none-any.whl | Python 3 | none | any | Details |
Total release size: 5.6 MB
Release files / nextplot-0.1.9.tar.gz
| Download URL | nextplot-0.1.9.tar.gz |
|---|---|
| Size | 5.5 MB |
| Tags | Source |
|
SHA-256 checksum How to use checksums |
004c0dfbf48876e59a01760f473aa81a3a1bc7cd81d51a29225a937d56e33846
|
|
BLAKE2b-256 checksum How to use checksums |
a42a2e75de6d65b3ce07651ec9aa5c66871e2b2bc12d6f036018d678d408bd85
|
| Upload date | |
|
Uploaded using Trusted Publishing? What is trusted publishing? |
Yes |
| Uploaded via |
twine/6.1.0 CPython/3.12.9
|
Provenance
Provenance describes where a file came from. On PyPI, provenance is shared via attestations, which provide a verifiable record of the build or publishing details. View details, limitations and caveats.


PyPI Publish Attestation
PyPI verified that this artifact, at this checksum, originated from the publisher listed below.
Signed by GitHub Actions, verified by PyPI on Jul 29, 2025.
Transparency logRelease files / nextplot-0.1.9-py3-none-any.whl
| Download URL | nextplot-0.1.9-py3-none-any.whl |
|---|---|
| Size | 46.0 kB |
| Tags | Python 3 |
|
SHA-256 checksum How to use checksums |
b67d6fdd1345c86f576c1367fd390b3f8115703ddf178e47759db519c60d3f1f
|
|
BLAKE2b-256 checksum How to use checksums |
7f249396d48e1ef33a959e7a307c7ea6b32f3c404a7dde04f26de5353d185483
|
| Upload date | |
|
Uploaded using Trusted Publishing? What is trusted publishing? |
Yes |
| Uploaded via |
twine/6.1.0 CPython/3.12.9
|
Provenance
Provenance describes where a file came from. On PyPI, provenance is shared via attestations, which provide a verifiable record of the build or publishing details. View details, limitations and caveats.
PyPI Publish Attestation
PyPI verified that this artifact, at this checksum, originated from the publisher listed below.
Signed by GitHub Actions, verified by PyPI on Jul 29, 2025.
Transparency log













