
oh-my-gitstats
中文 | English
Collect commit data from multiple git repositories and visualize it as a single interactive HTML report.
Features
- Batch Collection — Recursively scan a directory for all git repositories
- Incremental Sync — Only fetch new commits since the last collection
- Automated Workflow —
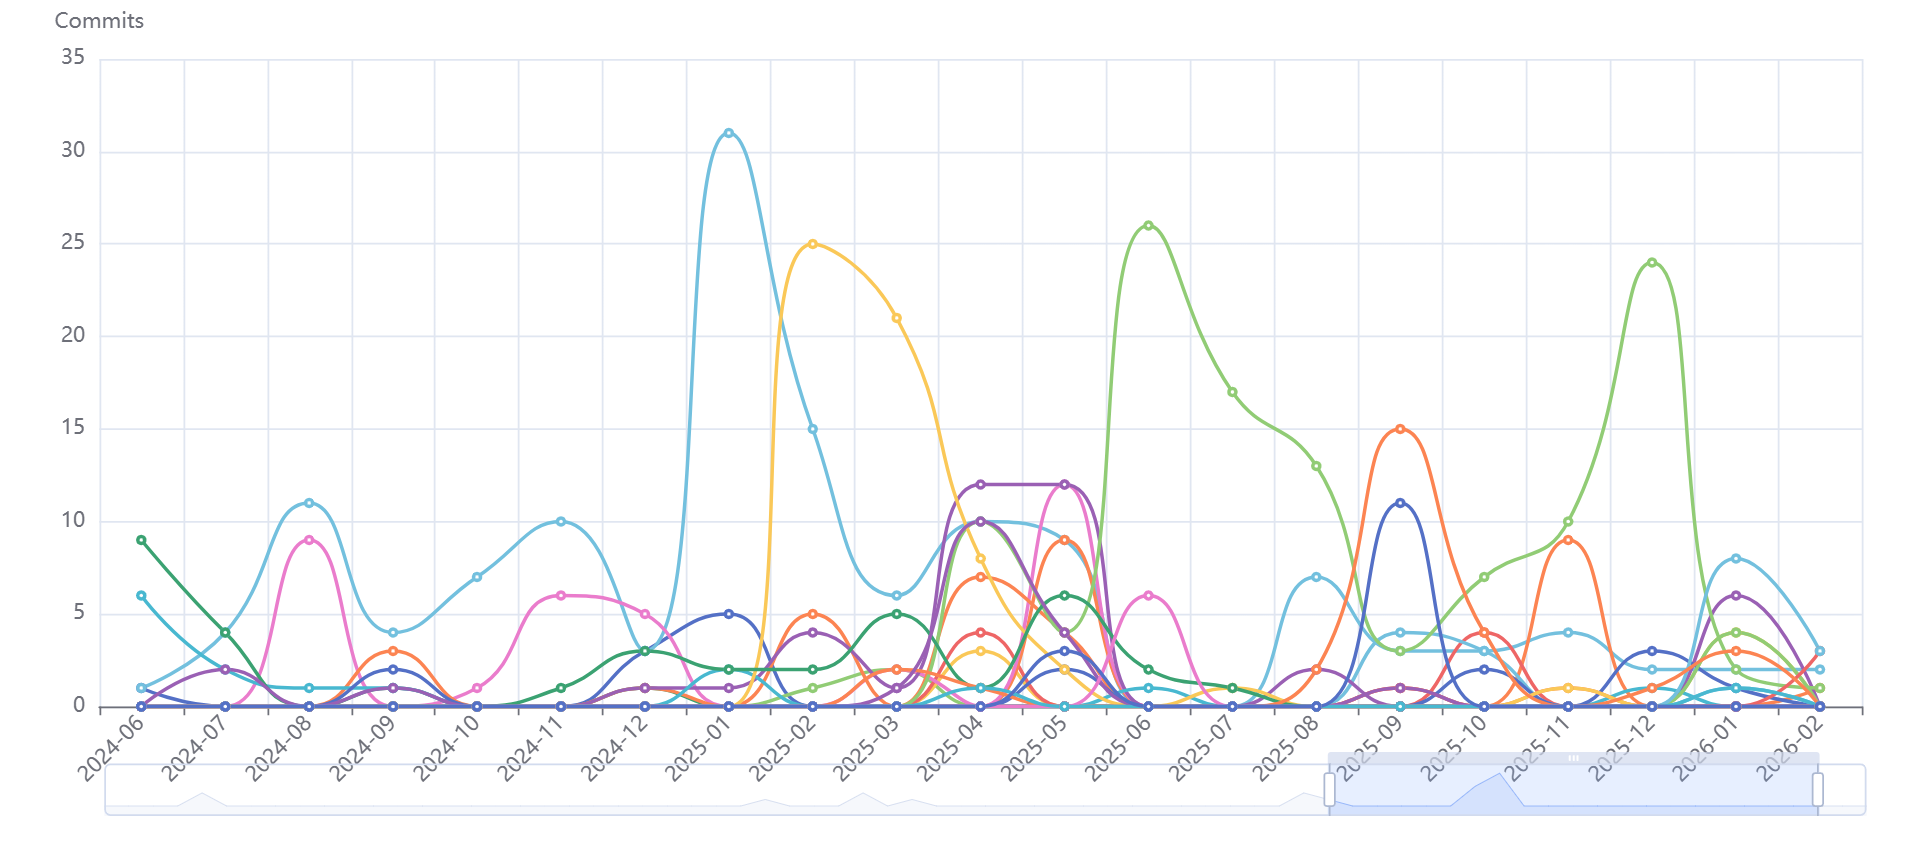
gitstats autoruns collect → sync → visualize and opens the browser - Line Charts — Switch metric (lines changed / commit count) and granularity (day / week / month); editable date range bar (two date inputs + 30D / 90D / 6M / 1Y / ALL presets), with the legend filtered to the selected range
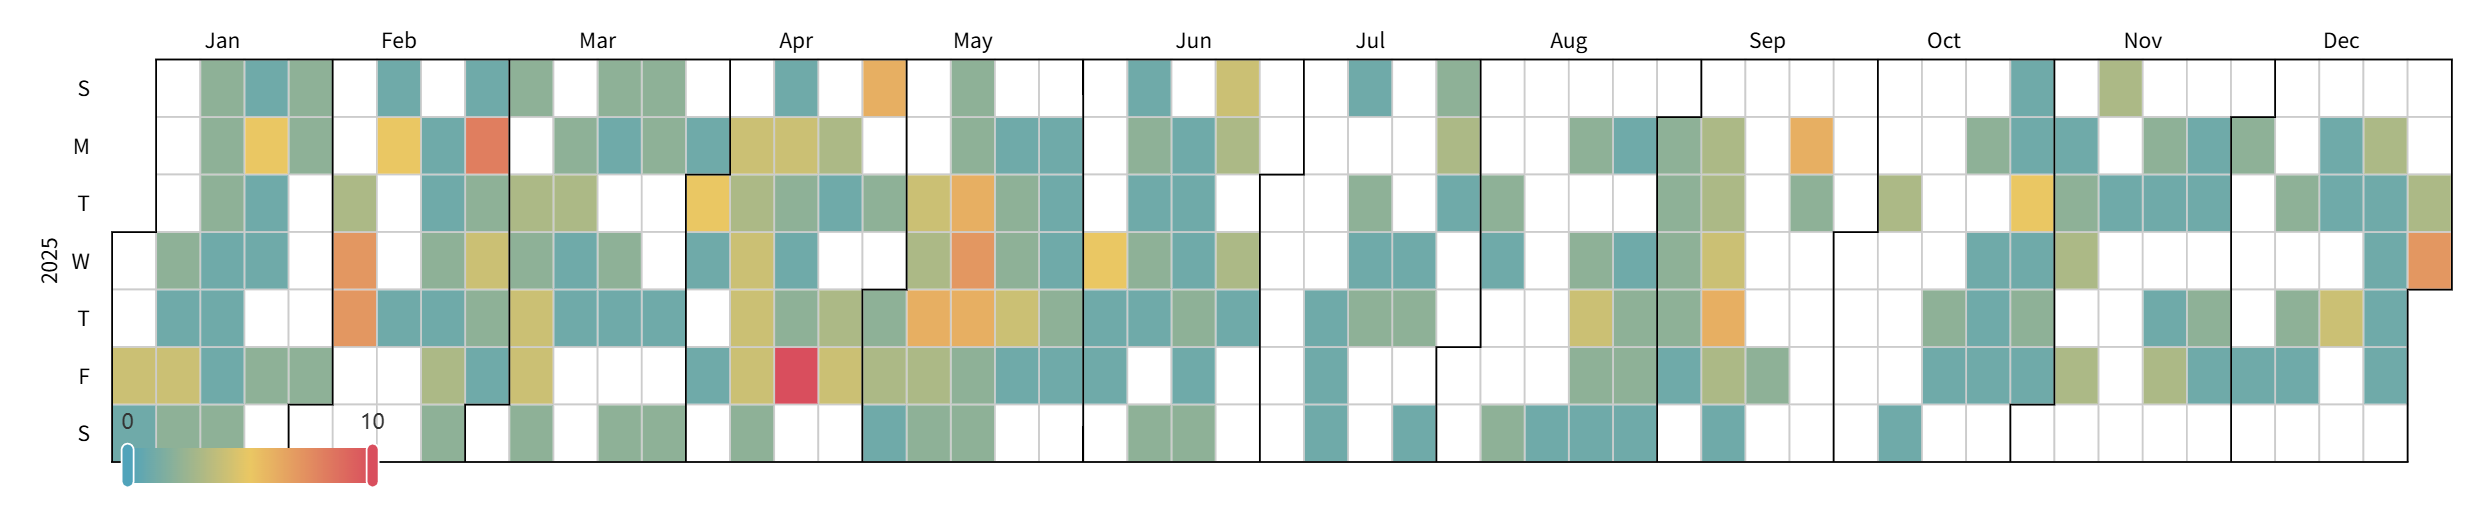
- Calendar Heatmaps — View commit activity filtered by year
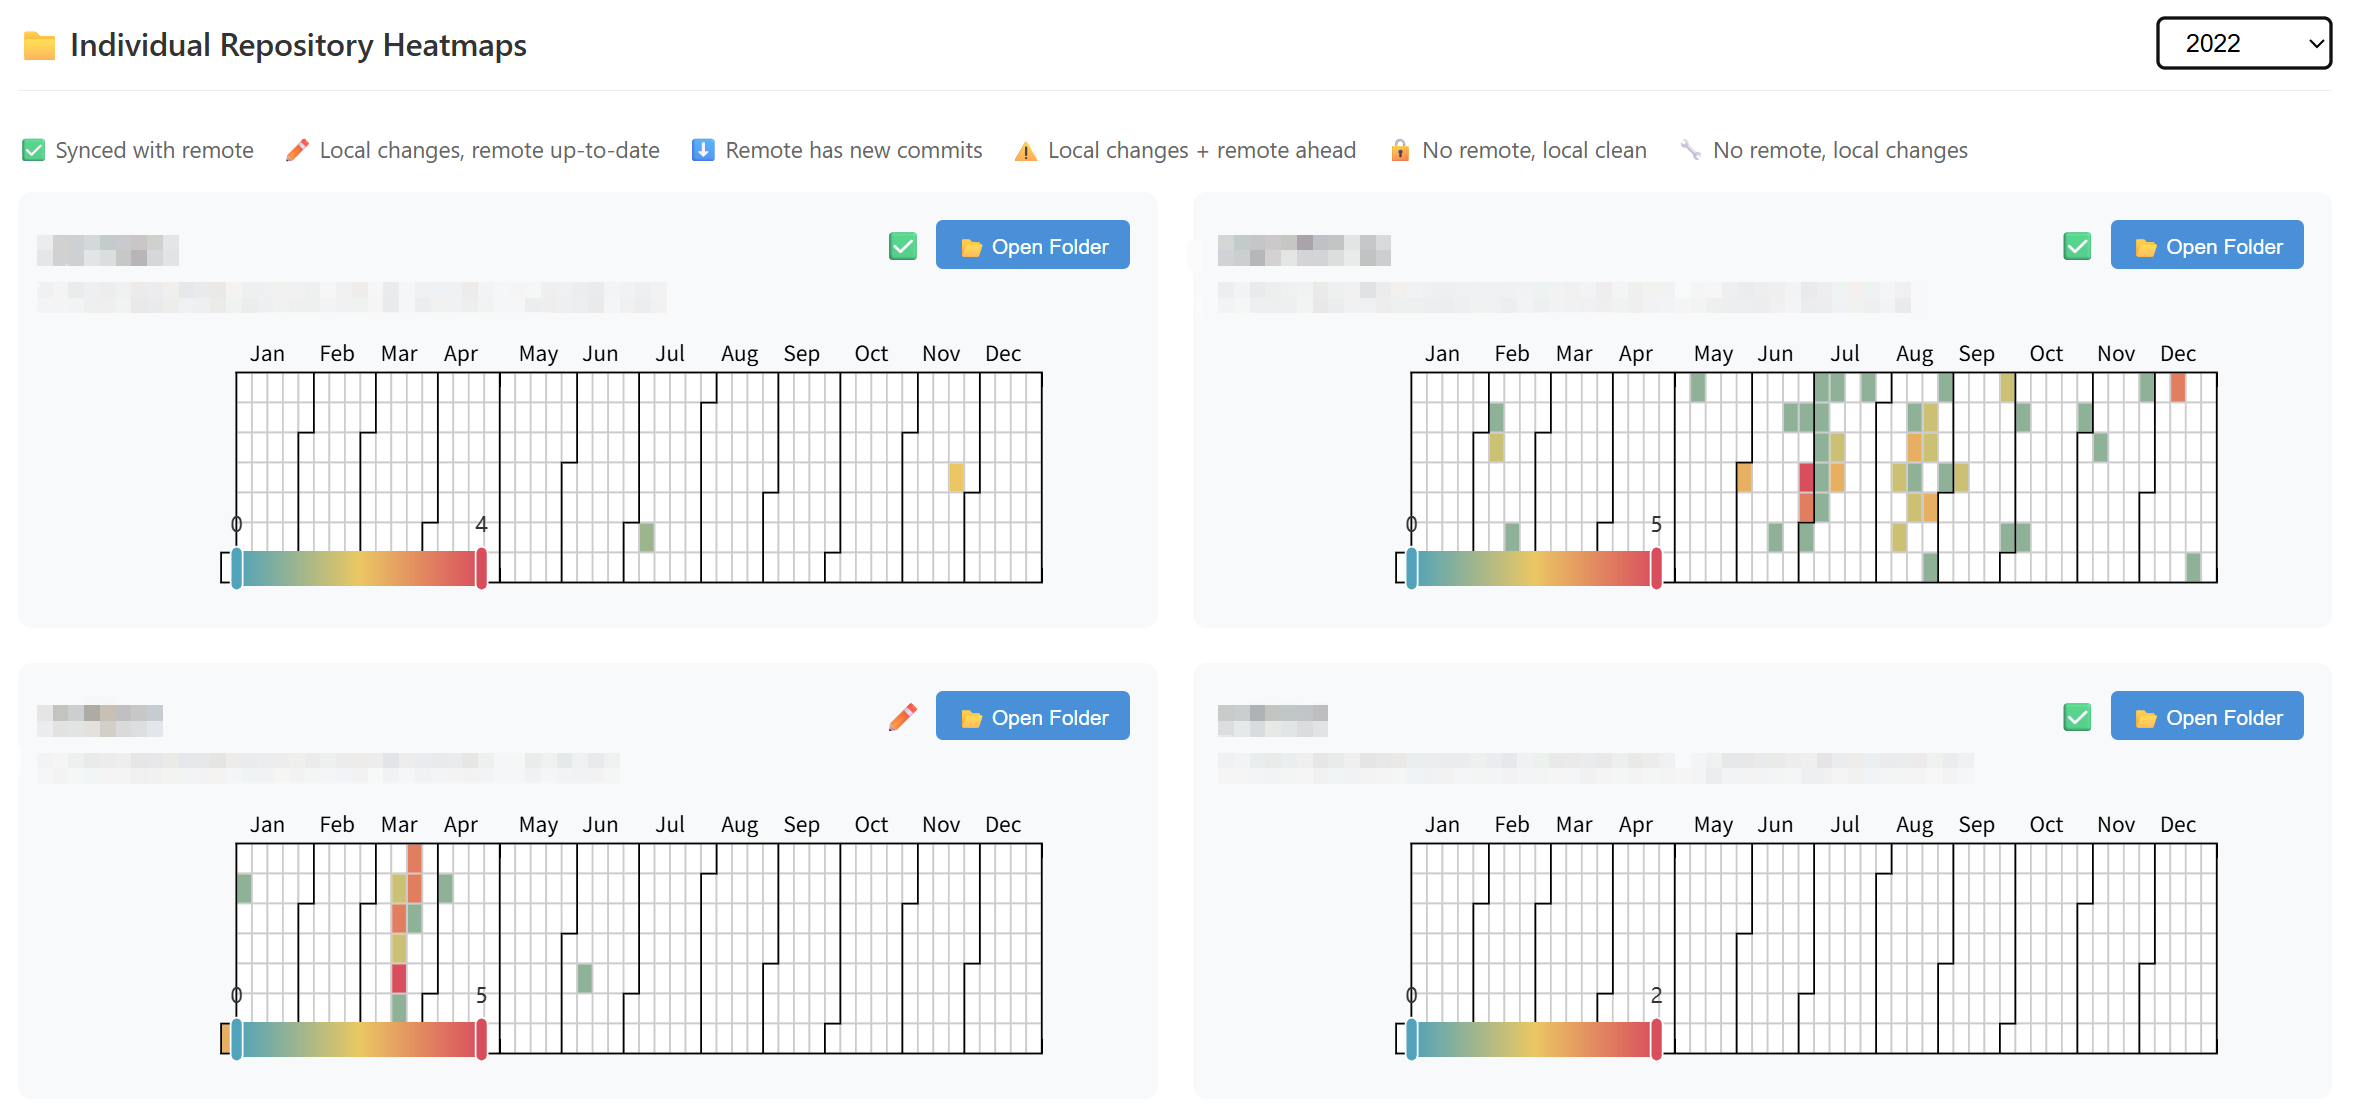
- Aggregate and Per-Repo Views — A 2-column grid showing combined or per-repo statistics
- Repo Detail Modal — Click any repo card to open its line chart, heatmap, and meta info (commits / lines / first / last / local / remote / action)
- Local / Remote Indicators — Each sync status is rendered as two independent signal lamps for working-tree state and remote-tracking state
- VS Code Integration — Open repo folders directly from the HTML report
Installation
pip install oh-my-gitstats
Or install from source:
git clone https://github.com/amomorning/oh-my-gitstats.git
cd oh-my-gitstats
pip install -e .
Quick Start
First time, collect from each project directory (paths are recorded to the config automatically):
cd ~/projects && gitstats collect .
cd ~/work && gitstats collect .
After that, a single command runs collect → sync → visualize and opens the browser:
gitstats auto
You can also edit the config file manually to add directories:
# Auto-created at:
~/.gitstats/settings.json
{
  "collect_paths": [
    "/home/user/projects",
    "/home/user/work"
  ]
}
Options:
| Option | Description |
|---|---|
-v, --verbose |
Show detailed output for each step (default: spinner only) |
--check |
Check GitHub archive status (requires network; set GITHUB_TOKEN for private repos) |
--no-open |
Do not open the HTML file in the browser after generation |
Commands
collect — Collect commit data
Scan a directory for git repositories and export them to JSON:
gitstats collect /path/to/repos
| Option | Description |
|---|---|
-o, --output |
Directory to save JSON files (default: ~/.gitstats/data) |
-q, --quiet |
Suppress output messages |
--skip |
Skip repos that already have a JSON file |
--check |
Check GitHub archive status |
sync — Incremental sync
Update existing JSON files with only new commits — faster than re-collecting:
gitstats sync
| Option | Description |
|---|---|
-q, --quiet |
Suppress output messages |
--check |
Check GitHub archive status |
Typical workflow with multiple directories:
# One-time: collect from different locations
gitstats collect /path/to/work-projects
gitstats collect /path/to/personal-projects --skip

# Later: update all at once
gitstats sync
visualize — Generate visualization
Create an interactive HTML file from the collected data:
gitstats visualize
| Option | Description |
|---|---|
-o, --output |
HTML file path (default: ~/.gitstats/stats.html) |
Granularity and metric can be switched dynamically in the generated HTML — no need to regenerate.
archive — Mark repositories (interactive)
Opens an interactive multi-select list of all known repositories. Use arrow
keys to navigate, space to toggle, and enter to confirm. Repositories that
are currently archived (either via a previous archive run or via --check
from the GitHub API) are pre-checked.
gitstats archive
gitstats archive -o ./data   # use a non-default data directory
| Option | Description |
|---|---|
-o, --data-dir |
Directory containing JSON files (default: ~/.gitstats/data) |
On submit, only repositories whose effective archived state actually changes are rewritten. You will be prompted to refresh the HTML.
Requires an interactive terminal. In CI / non-TTY environments the command exits with an error.
Configuration
Config file at ~/.gitstats/settings.json (auto-created on first run):
{
  "data_dir": "~/.gitstats/data",
  "output_html": "~/.gitstats/stats.html",
  "collect_paths": []
}
| Field | Description |
|---|---|
data_dir |
Where JSON files are stored |
output_html |
Where the HTML visualization is generated |
collect_paths |
Directories gitstats auto scans (auto-populated when you run collect) |
GitHub Token (Optional)
--check queries the GitHub API to check archive status. Without authentication, only public repositories can be checked (rate limit: 60 requests/hour).
If
GITHUB_TOKENis not set, a warning is printed when using--check.
To check private repositories, set the GITHUB_TOKEN environment variable:
Linux / macOS
export GITHUB_TOKEN=ghp_your_token_here
gitstats sync --check
Windows (PowerShell)
Set for the current session:
$env:GITHUB_TOKEN="ghp_your_token_here"
gitstats sync --check
Set permanently: Settings → System → About → Advanced system settings → Environment Variables → User variables → New
Getting a token
- Go to GitHub → Settings → Developer settings → Personal access tokens → Tokens (classic)
- Click Generate new token (classic)
- Give it a name (e.g.
oh-my-gitstats) - Under Select scopes, no additional scopes are needed for public repos
- To access private repositories, check the
reposcope - Click Generate token and copy the value (starts with
ghp_)
Use Tokens (classic), not Fine-grained tokens. With a token, the rate limit increases to 5,000 requests/hour.
Output
The generated HTML contains:
-
Line Chart (01 / Trend) — Metric selector (lines changed / commit count) + granularity selector (day / week / month) + editable date range bar with two
<input type="date">(or<input type="month">when granularity is month) and preset buttons (30D / 90D / 6M / 1Y / ALL). The range drives and is driven by the EChartsdataZoom; the legend is filtered to show only repositories with commits inside the selected range. -
Aggregate Heatmap (02 / Aggregate) — Combined activity across all repos with a year selector (all years / specific year); height auto-adjusts when switching between single-year and multi-year ranges.
-
Individual Heatmaps (03 / Repositories) — A 2-column grid of per-repo cards. Each card shows the repo name, monospace path, Local + Remote signal lamps (small colored circles labeled L / R, in green / yellow / red / gray), and a Continue / Archived button with an MDI icon (
vscode://file/URI). A Show Archived toggle in the section header controls whether archived cards are visible (hidden by default). Click any card to open the detail modal with a per-repo line chart (default granularity day), heatmap, and a 7-cell meta grid (commits / lines / first / last / local / remote / action). Closeable via the × button, a backdrop click, or the Escape key.
JSON Format
Each repository generates a JSON file (~/.gitstats/data/{repo_name}.json):
{
  "repo_name": "my-project",
  "repo_path": "/absolute/path/to/my-project",
  "last_commit_hash": "a1b2c3d4...",
  "sync_status": "synced",
  "is_archived": false,
  "commits": [
    {
      "timestamp": "2024-01-15T10:30:00",
      "additions": 45,
      "deletions": 12
    }
  ]
}
last_commit_hash — HEAD hash at collection time. During sync, repos with a matching hash are skipped.
sync_status — Sync state, decomposed at render time into two independent Local + Remote signal lamps (the stored JSON value is a single enum):
| sync_status | Local | Remote |
|---|---|---|
synced |
🟢 Clean | 🟢 Synced |
local_changes |
🟡 Dirty | 🟢 Synced |
remote_ahead |
🟢 Clean | 🟡 Ahead |
diverged |
🟡 Dirty | 🟡 Ahead |
local_only_clean |
🟢 Clean | ⚪ None |
local_only_dirty |
🟡 Dirty | ⚪ None |
network_error_clean |
🟢 Clean | 🔴 Error |
network_error_dirty |
🟡 Dirty | 🔴 Error |
is_archived — Whether the repo is archived on GitHub (set by --check). Values: true, false, or null (not checked or check failed).
manual_archived — Manual override set by gitstats archive. Values: true, false, or null. When present, it takes priority over is_archived. The rendered HTML shows the effective value (manual wins).
Requirements
- Python 3.9+
- click, gitpython, pyecharts, jinja2, requests, questionary
1 maintainer

Release files for oh-my-gitstats 0.4.0
For a detailed explanation of source distributions (sdists) and built distributions (wheels), please see the package formats documentation.
Source distribution (sdist)
| File | Size | Uploaded | |
|---|---|---|---|
| oh_my_gitstats-0.4.0.tar.gz | 40.8 kB | Details |
Built distribution (wheel)
| File | Interpreter | ABI | Platform | Reset |
|---|---|---|---|---|
| oh_my_gitstats-0.4.0-py3-none-any.whl | Python 3 | none | any | Details |
Total release size: 76.9 kB
Release files / oh_my_gitstats-0.4.0.tar.gz
| Download URL | oh_my_gitstats-0.4.0.tar.gz |
|---|---|
| Size | 40.8 kB |
| Tags | Source |
|
SHA-256 checksum How to use checksums |
ef8f98a84b5b8c7d5e1f2b06d8b61f16748f135b676797eac8080f7a4f86c938
|
|
BLAKE2b-256 checksum How to use checksums |
554d52064a020a1fafc1e6c61aaec7ba88b637e7482d8c3b1257d3d7c3a40b30
|
| Upload date | |
|
Uploaded using Trusted Publishing? What is trusted publishing? |
No |
| Uploaded via |
twine/6.2.0 CPython/3.13.9
|
Release files / oh_my_gitstats-0.4.0-py3-none-any.whl
| Download URL | oh_my_gitstats-0.4.0-py3-none-any.whl |
|---|---|
| Size | 36.1 kB |
| Tags | Python 3 |
|
SHA-256 checksum How to use checksums |
4b48ec17ac4a473138c597e6bb2d617c5e5ec992e75e94ede7fc0ee6d961414c
|
|
BLAKE2b-256 checksum How to use checksums |
f72630ebec31715e5430081eb79735efb1c4e456c22073ddc48a15accf82c214
|
| Upload date | |
|
Uploaded using Trusted Publishing? What is trusted publishing? |
No |
| Uploaded via |
twine/6.2.0 CPython/3.13.9
|














