Git repository commit statistics collector and visualizer

Project description
📊 oh-my-gitstats
中文 | English
A Python CLI tool for collecting git commit statistics and visualizing them as interactive HTML charts.
✨ Features
- 🔍 Batch Collection — Scan multiple git repositories recursively
- ⚡ Incremental Sync — Only fetch new commits since last collection
- 🚀 One-Step Workflow —
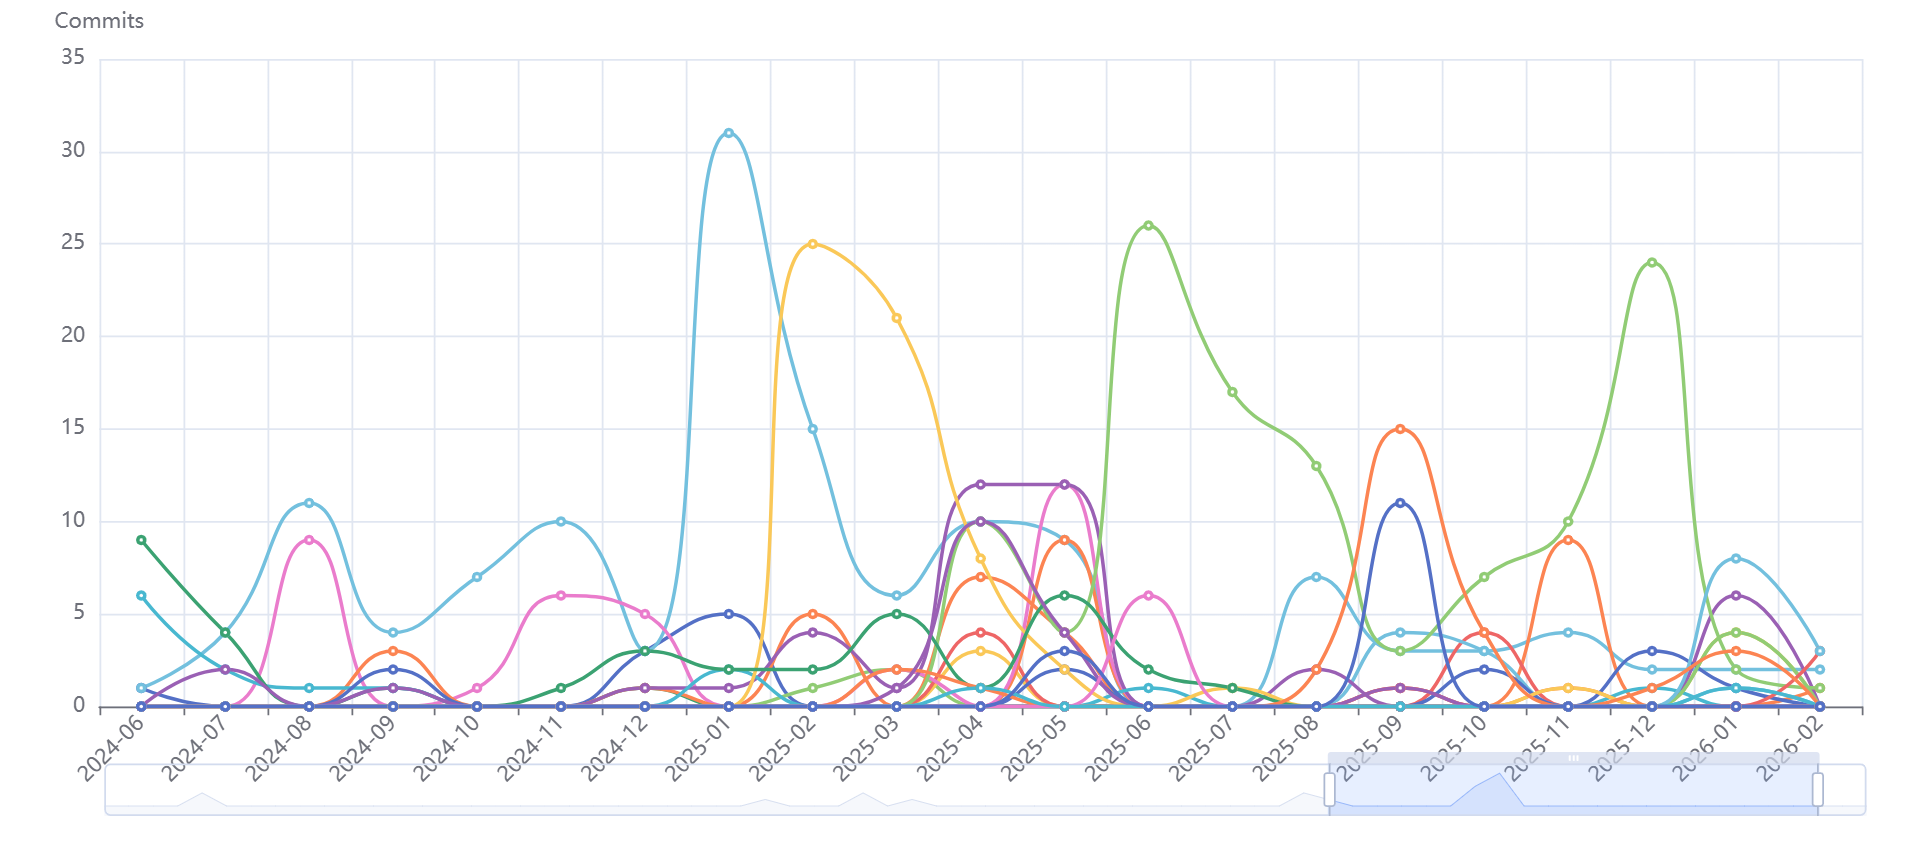
gitstats autodoes everything in one command - 📈 Line Charts — Track changes over time with metric & granularity switching, editable date range inputs + presets (30D / 90D / 6M / 1Y / ALL), and dynamic legend filtering by selected range
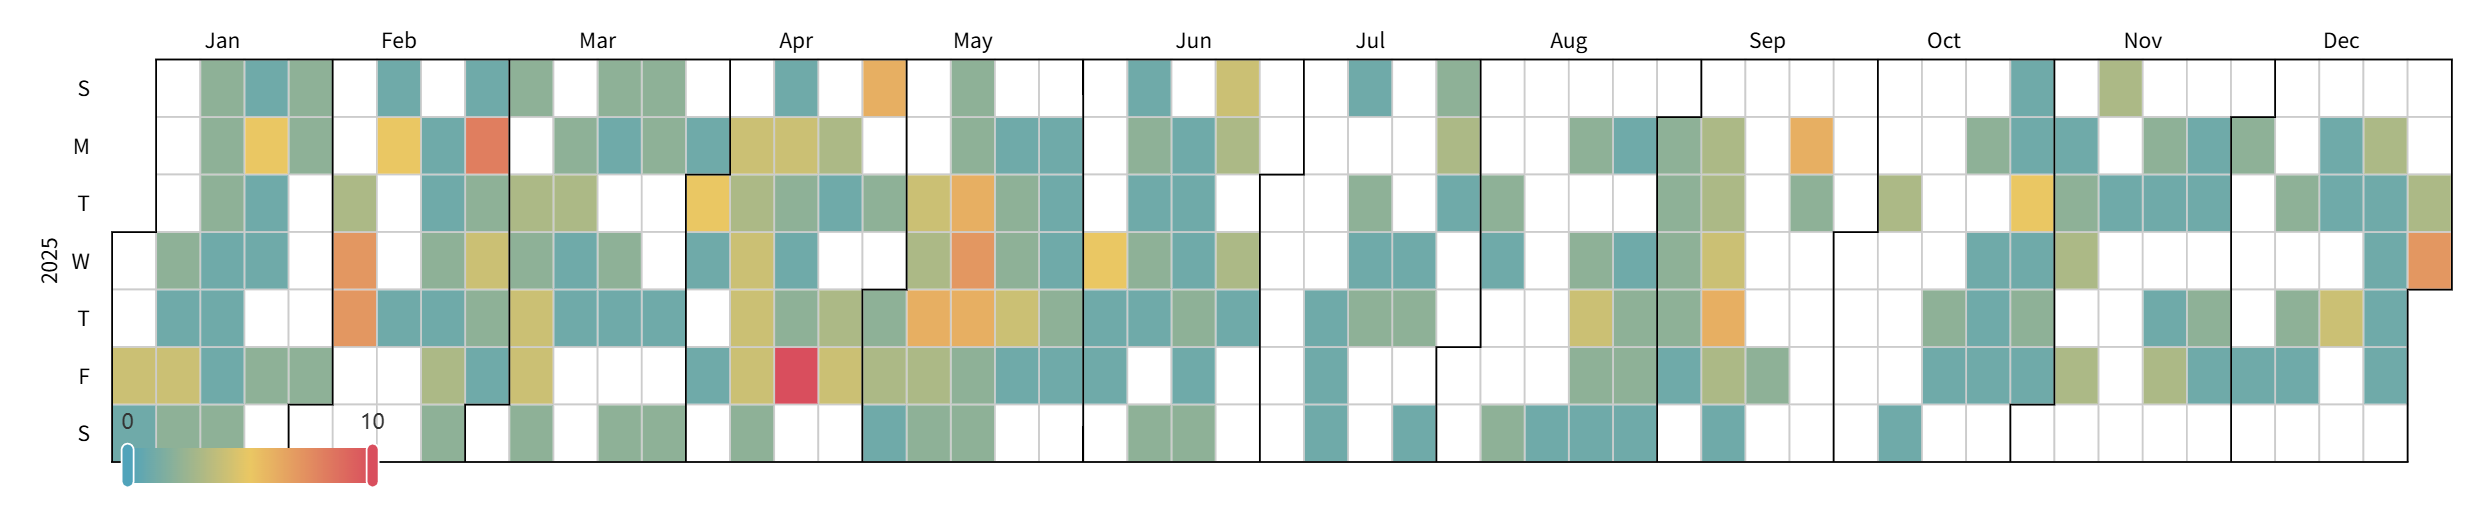
- 🗓️ Calendar Heatmaps — Visualize commit activity with year-based filtering; GitHub-style green gradient, perfectly square day cells
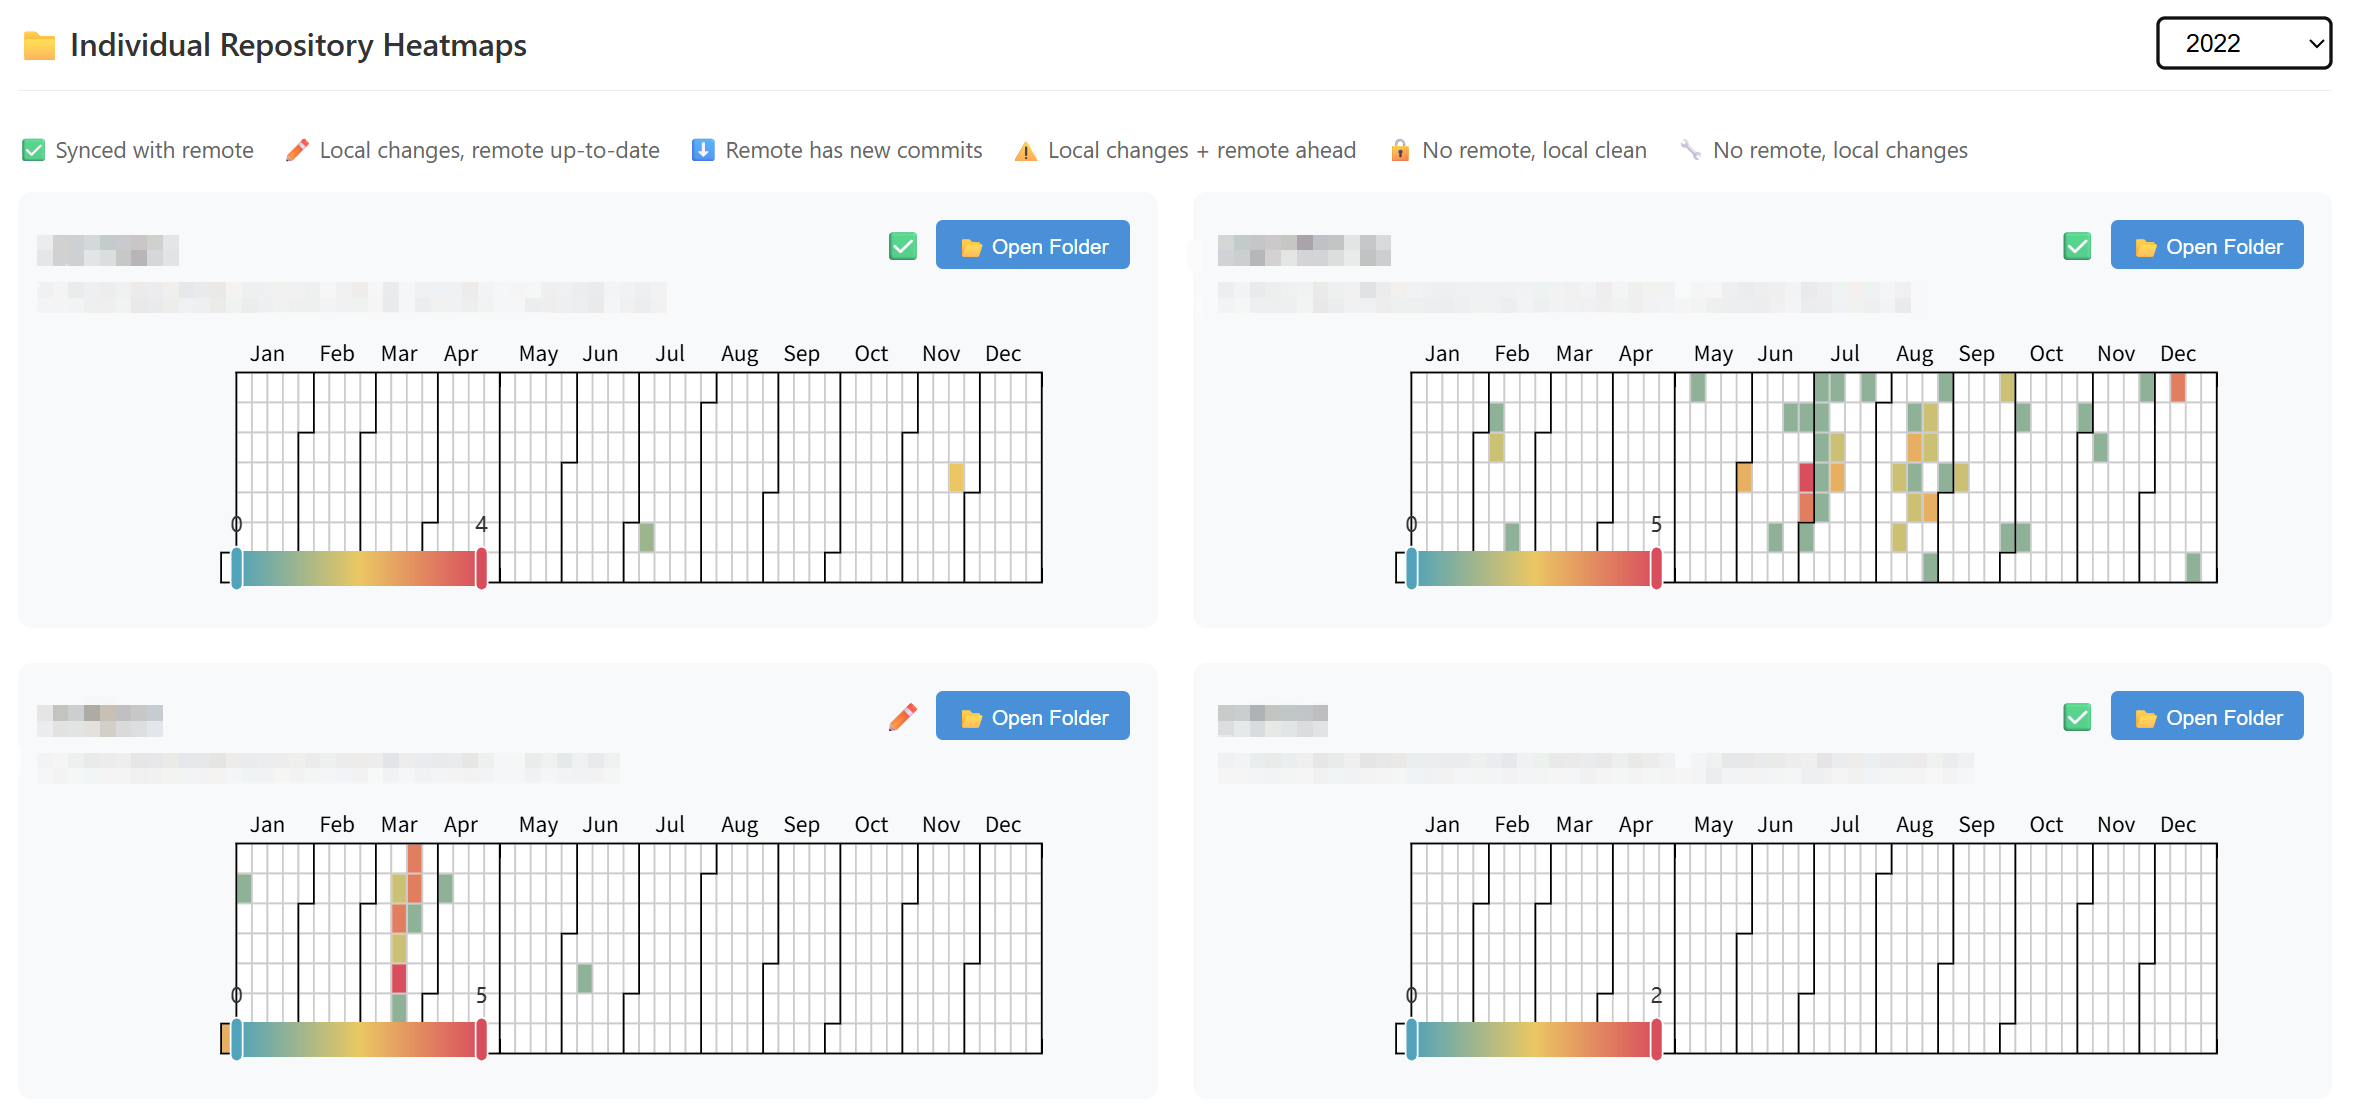
- 🎯 Aggregated & Individual Views — See combined or per-repo statistics in a strict 2-column Swiss grid
- 🔬 Per-Repo Detail Modal — Click any repo card to open a large line chart + heatmap + meta info (Commits / Lines / First / Last / Local / Remote / Action)
- 🚦 Local + Remote Signal Lamps — Each sync status is decomposed into two independent traffic-light indicators (green / yellow / red / gray) for working-tree state and remote-tracking state
- 🎨 Swiss International Style — Pure white background, Inter/Helvetica stack, 12-column grid, horizontal rules instead of shadows, MDI icons (jsDelivr)
- 📂 VS Code Integration — Open repo folders directly from the HTML report
🚀 Installation
pip install oh-my-gitstats
Or install from source:
git clone https://github.com/amomorning/oh-my-gitstats.git
cd oh-my-gitstats
pip install -e .
⚡ Quick Start
First time, collect from each project directory (paths are auto-recorded in config):
cd ~/projects && gitstats collect .
cd ~/work && gitstats collect .
After that, one command does collect → sync → visualize → open browser:
gitstats auto
You can also manually edit the config file to add directories:
# The config file is auto-created at:
~/.gitstats/settings.json
{
  "collect_paths": [
    "/home/user/projects",
    "/home/user/work"
  ]
}
Options:
| Option | Description |
|---|---|
-q, --quiet |
Suppress output messages |
--check |
Check GitHub archive status (requires network; set GITHUB_TOKEN for private repos) |
--no-open |
Do not open the HTML file in browser after generation |
📖 Commands
collect — Collect Commit Data
Scan a directory for git repositories and export to JSON:
gitstats collect /path/to/repos
| Option | Description |
|---|---|
-o, --output |
Directory to save JSON files (default: ~/.gitstats/data) |
-q, --quiet |
Suppress output messages |
--skip |
Skip repos that already have a JSON file |
--check |
Check GitHub archive status |
sync — Incremental Sync
Update existing JSON files with only new commits — much faster than re-collecting:
gitstats sync
| Option | Description |
|---|---|
-q, --quiet |
Suppress output messages |
--check |
Check GitHub archive status |
Typical workflow with multiple directories:
# One-time: collect from different locations
gitstats collect /path/to/work-projects
gitstats collect /path/to/personal-projects --skip

# Later: update all at once
gitstats sync
visualize — Generate Visualization
Create an interactive HTML file from collected data:
gitstats visualize
| Option | Description |
|---|---|
-o, --output |
HTML file path (default: ~/.gitstats/stats.html) |
Granularity and metric can be switched dynamically in the generated HTML — no need to regenerate.
⚙️ Configuration
Config file at ~/.gitstats/settings.json (auto-created on first run):
{
  "data_dir": "~/.gitstats/data",
  "output_html": "~/.gitstats/stats.html",
  "collect_paths": []
}
| Field | Description |
|---|---|
data_dir |
Where JSON files are stored |
output_html |
Where HTML visualization is generated |
collect_paths |
Directories for gitstats auto to scan (auto-populated when you run collect) |
🔑 GitHub Token (Optional)
--check queries the GitHub API to check archive status. Without authentication, only public repositories can be checked (rate limit: 60 requests/hour).
If
GITHUB_TOKENis not set, a warning will be printed when using--check.
To check private repositories, set the GITHUB_TOKEN environment variable:
Linux / macOS
export GITHUB_TOKEN=ghp_your_token_here
gitstats sync --check
Windows (PowerShell)
Set for current session:
$env:GITHUB_TOKEN="ghp_your_token_here"
gitstats sync --check
Set permanently: Settings → System → About → Advanced system settings → Environment Variables → User variables → New
How to get a token
- Go to GitHub → Settings → Developer settings → Personal access tokens → Tokens (classic)
- Click Generate new token (classic)
- Give it a name (e.g.
oh-my-gitstats) - Under Select scopes, no additional scopes are needed for public repos
- To access private repositories, check the
reposcope - Click Generate token and copy the value (starts with
ghp_)
Note: Use Tokens (classic), not Fine-grained tokens. With a token, the rate limit increases to 5,000 requests/hour.
📁 Output
The generated HTML is built with a Swiss International Style design system (pure white, Inter/Helvetica, strict 12-column grid, MDI icons via jsDelivr). It contains:
-
📈 Line Chart (01 / Trend) — Metric selector (Lines Changed / Commit Count) + granularity selector (Day / Week / Month) + editable date range bar with two
<input type="date">(or<input type="month">when granularity is month) and preset buttons (30D / 90D / 6M / 1Y / ALL). Range drives and is driven by EChartsdataZoom; legend items are dynamically filtered to only show repositories with commits inside the selected range. -
🗓️ Aggregate Heatmap (02 / Aggregate) — Combined activity across all repos with year selector (All Years / specific year). GitHub-style green gradient, fixed-square day cells, height auto-adjusts when switching between single-year and multi-year ranges.
-
📊 Individual Heatmaps (03 / Repositories) — 2-column grid of per-repo cards. Each card shows repo name, monospace path, Local + Remote signal lamps (small colored circles labeled L / R, with traffic-light colors green / yellow / red / gray), and a Continue / Archived button with MDI icon (
vscode://file/URI). Click any card to open the Detail Modal with a large per-repo line chart (default granularity Day), large heatmap, and a 7-cell meta grid (Commits / Lines / First / Last / Local / Remote / Action). Closeable via × button, backdrop click, or Escape key.
📋 JSON Format
Each repository generates a JSON file (~/.gitstats/data/{repo_name}.json):
{
  "repo_name": "my-project",
  "repo_path": "/absolute/path/to/my-project",
  "last_commit_hash": "a1b2c3d4...",
  "sync_status": "synced",
  "is_archived": false,
  "commits": [
    {
      "timestamp": "2024-01-15T10:30:00",
      "additions": 45,
      "deletions": 12
    }
  ]
}
last_commit_hash — HEAD hash at collection time. During sync, repos with a matching hash are skipped instantly.
sync_status — Sync state, decomposed at render time into two independent Local + Remote signal lamps (the stored JSON value is a single enum):
| sync_status | Local | Remote |
|---|---|---|
✅ synced |
🟢 Clean | 🟢 Synced |
✏️ local_changes |
🟡 Dirty | 🟢 Synced |
⬇️ remote_ahead |
🟢 Clean | 🟡 Ahead |
⚠️ diverged |
🟡 Dirty | 🟡 Ahead |
🔒 local_only_clean |
🟢 Clean | ⚪ None |
🔧 local_only_dirty |
🟡 Dirty | ⚪ None |
⚠️ network_error_clean |
🟢 Clean | 🔴 Error |
⚠️ network_error_dirty |
🟡 Dirty | 🔴 Error |
is_archived — Whether the repo is archived on GitHub (set by --check). Values: true, false, or null (not checked or check failed). Archived repos show a grayed-out "Archived" button.
🔧 Requirements
- Python 3.9+
- click, gitpython, pyecharts, jinja2, requests
Release history Release notifications | RSS feed


Download files
Download the file for your platform. If you're not sure which to choose, learn more about installing packages.
Source Distribution
Built Distribution
Filter files by name, interpreter, ABI, and platform.
If you're not sure about the file name format, learn more about wheel file names.
Copy a direct link to the current filters
File details
Details for the file oh_my_gitstats-0.3.2.tar.gz.
File metadata
- Download URL: oh_my_gitstats-0.3.2.tar.gz
- Upload date:
- Size: 35.1 kB
- Tags: Source
- Uploaded using Trusted Publishing? No
- Uploaded via: twine/6.2.0 CPython/3.13.9
File hashes
| Algorithm | Hash digest | |
|---|---|---|
| SHA256 |
891f67c34e210e80d1ece64d66aba51b224245e81b84f962ed3dbe3b5182a1b8
|
|
| MD5 |
a3401f78363c0a53a3de0cef011665a1
|
|
| BLAKE2b-256 |
6f37fc715980c4a1bcef3cb1aa1a84aaffe20ee864f5e8f2387fe34608e462fb
|
File details
Details for the file oh_my_gitstats-0.3.2-py3-none-any.whl.
File metadata
- Download URL: oh_my_gitstats-0.3.2-py3-none-any.whl
- Upload date:
- Size: 33.3 kB
- Tags: Python 3
- Uploaded using Trusted Publishing? No
- Uploaded via: twine/6.2.0 CPython/3.13.9
File hashes
| Algorithm | Hash digest | |
|---|---|---|
| SHA256 |
714265be0dcabafdb52cdf798f1afab3a84999685c2dacd0b14acd37ad943627
|
|
| MD5 |
52b8fc55bfdf404b1cae5330caefb8dc
|
|
| BLAKE2b-256 |
b7e289d0d5844288a4660a607c0b55b901e626b5c9996c899194c5c0166c7a00
|


