Investment portfolio analyzing & optimization tools

Project description


Okama
okama is a library with investment portfolio analyzing & optimization tools. CFA recommendations are used in quantitative finance.
okama goes with free «end of day» historical stock markets data and macroeconomic indicators through API.
...entities should not be multiplied without necessity
-- William of Ockham (c. 1287–1347)
Table of contents
- Okama main features
- Financial data and macroeconomic indicators
- Installation
- Getting started
- Documentation
- Financial Widgets
- RoadMap
- Contributing to okama
- Communication
Okama main features
- Investment portfolio constrained Markowitz Mean-Variance Analysis (MVA) and optimization
- Rebalanced portfolio optimization with constraints (multi-period Efficient Frontier)
- Advanced rebalancing strategies: Rebalancing-bands (threshold-based), Calendar-based or hybrid
- Investment portfolios with complex contributions / withdrawals cash flows (DCF)
- Monte Carlo Simulations for financial assets and investment portfolios
- Forecasting with popular theoretical distributions: normal, lognormal and Student's (T)
- Degrees of freedom optimization for Student's t-distribution to fit well at a given confidence level
- Testing distributions on historical data
- Popular risk metrics: VAR, CVaR, semi-deviation, variance and drawdowns
- Different financial ratios: CAPE10, Sharpe ratio, Sortino ratio, Diversification ratio
- Dividend yield and other dividend indicators for stocks
- Backtesting and comparing historical performance of broad range of assets and indexes in multiple currencies
- Methods to track the performance of index funds (ETF) and compare them with benchmarks
- Main macroeconomic indicators: inflation, central banks rates
- Matplotlib visualization scripts for the Efficient Frontier, Transition map and assets risk / return performance
Financial data and macroeconomic indicators
End of day historical data
- Stocks and ETF for main world markets
- Mutual funds
- Commodities
- Stock indexes
Currencies
- FX currencies
- Crypto currencies
- Central bank exchange rates
Macroeconomic indicators
For many countries (China, USA, United Kingdom, European Union, Russia, Israel etc.):
- Inflation
- Central bank rates
- CAPE10 (Shiller P/E) Cyclically adjusted price-to-earnings ratios
Other historical data
- Real estate prices
- Top bank rates
Installation
Requirements
- Python 3.11 or newer
- Core dependencies: pandas, numpy, scipy (plus
matplotlib,pyarrow,statsmodels,archand others). See pyproject.toml for the full list of dependencies and version constraints.
Install from PyPI
pip install okama
Install the latest development version from GitHub
git clone https://github.com/mbk-dev/okama@dev
poetry install
Getting started
1. Compare several assets from different stock markets. Get USD-adjusted performance
import okama as ok

x = ok.AssetList(['SPY.US', 'BND.US', 'DBXD.XFRA'], ccy='USD')
x  # all examples are for Jupyter Notebook/iPython. For raw Python interpreter use 'print(x)' instead.

Get the main parameters for the set:
x.describe()

Get the assets accumulated return, plot it and compare with the USD inflation:
x.wealth_indexes.plot()

2. Create a dividend stocks portfolio with base currency EUR
weights = [0.3, 0.2, 0.2, 0.2, 0.1]
assets = ['T.US', 'XOM.US', 'FRE.XFRA', 'SNW.XFRA', 'LKOH.MOEX']
pf = ok.Portfolio(assets, weights=weights, ccy='EUR')
pf.table

Plot the dividend yield of the portfolio (adjusted to the base currency).
pf.dividend_yield.plot()

3. Draw an Efficient Frontier for 2 popular ETF: SPY and GLD
ls = ['SPY.US', 'GLD.US']
curr = 'USD'
last_date = '2020-10'
# Rebalancing periods is one year (default value)
frontier = ok.EfficientFrontier(ls, last_date=last_date, ccy=curr, rebalancing_strategy=ok.Rebalance(period='year'))
frontier.names

Get the Efficient Frontier points for rebalanced portfolios and plot the chart with the assets risk/CAGR points:
import matplotlib.pyplot as plt

points = frontier.ef_points

fig = plt.figure(figsize=(12,6))
fig.subplots_adjust(bottom=0.2, top=1.5)
frontier.plot_assets(kind='cagr')  # plots the assets points on the chart
ax = plt.gca()
ax.plot(points.Risk, points.CAGR)
* - rebalancing period is one year.

4. Get a Transition Map for allocations
ls = ['SPY.US', 'GLD.US', 'BND.US']
ok.EfficientFrontier(ls, ccy='USD').plot_transition_map(x_axe='risk')

More examples are available in form of Jupyter Notebooks.
Documentation
The official documentation is hosted on readthedocs.org: https://okama.readthedocs.io/
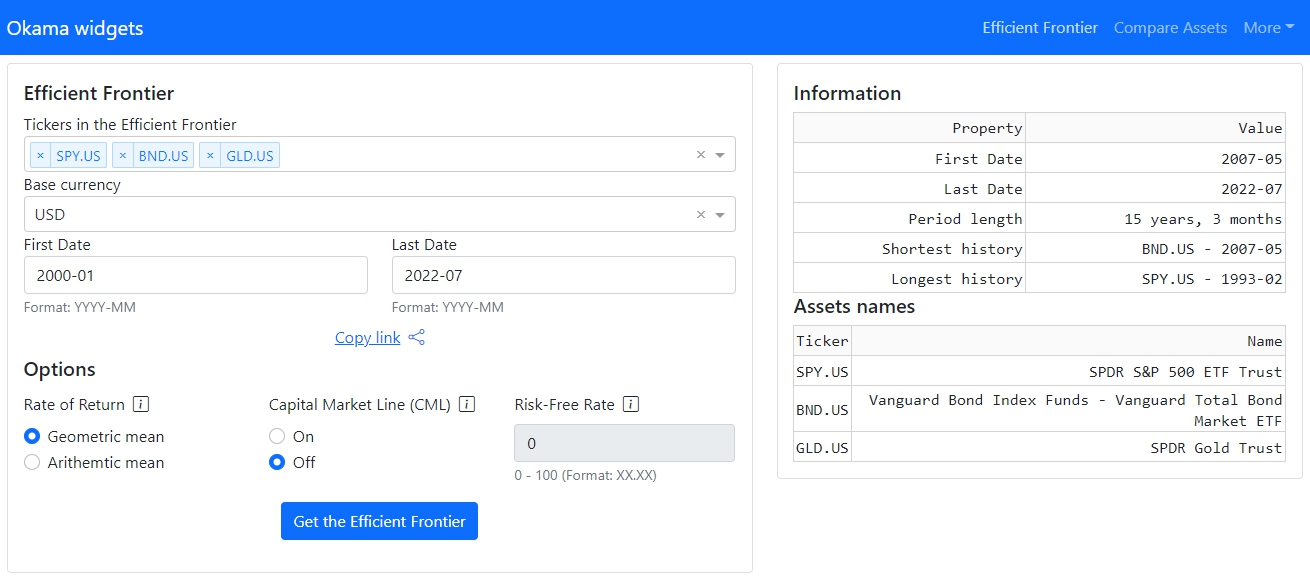
Financial Widgets
okama-dash repository has interactive financial widgets (multi-page web application) build with okama package and Dash (plotly) framework. Working example is available at okama.io.
RoadMap
The plan for okama is to add more functions that will be useful to investors and asset managers.
- Add support for a series of investment portfolios (a financial plan comprising multiple investment strategies, each active until a specific date, after which it transitions to another).
- Add multidimensional Monte Carlo with Ledoit-Wolf shrinkage
- Add IRR to PortfolioDCF
- Add Omega ratio to EfficientFrontier and Portfolio classes.
- Add Black-Litterman asset allocation
- Add different utility functions for optimizers: IRR, portfolio survival period, semi-deviation, VaR, CVaR, drawdowns etc.
- Add more functions based on suggestion of users.
Contributing to okama
Contributions are most welcome. Have a look at the Contribution Guide for more.
Feel free to ask questions on Discussuions.
As contributors and maintainers to this project, you are expected to abide by okama' code of conduct. More information can be found at: Contributor Code of Conduct
Communication
For basic usage questions (e.g., "Is XXX currency supported by okama?") and for sharing ideas please use GitHub Discussions. Russian language community is available at okama.io forums.
License
MIT
Release history Release notifications | RSS feed


Download files
Download the file for your platform. If you're not sure which to choose, learn more about installing packages.
Source Distribution
Built Distribution
Filter files by name, interpreter, ABI, and platform.
If you're not sure about the file name format, learn more about wheel file names.
Copy a direct link to the current filters
File details
Details for the file okama-2.2.0.tar.gz.
File metadata
- Download URL: okama-2.2.0.tar.gz
- Upload date:
- Size: 119.7 kB
- Tags: Source
- Uploaded using Trusted Publishing? No
- Uploaded via: poetry/2.4.1 CPython/3.14.5 Linux/6.6.114.1-microsoft-standard-WSL2
File hashes
| Algorithm | Hash digest | |
|---|---|---|
| SHA256 |
a4521d8bd95812b5aa5fd670831417cd9b87a27e9c89f823d65351dbf14eaa98
|
|
| MD5 |
2fe18875a4470d4c3281537ed1918301
|
|
| BLAKE2b-256 |
31c9c932e67d033a928a37835933f344a879750e440fd6f1363c8902c69970a5
|
File details
Details for the file okama-2.2.0-py3-none-any.whl.
File metadata
- Download URL: okama-2.2.0-py3-none-any.whl
- Upload date:
- Size: 130.5 kB
- Tags: Python 3
- Uploaded using Trusted Publishing? No
- Uploaded via: poetry/2.4.1 CPython/3.14.5 Linux/6.6.114.1-microsoft-standard-WSL2
File hashes
| Algorithm | Hash digest | |
|---|---|---|
| SHA256 |
3586f937bb753f8592c002b63c83d969db30d5d3f1ae7deea36a3abd12d1f5e2
|
|
| MD5 |
25e482b9b3c8e74b7cd0613dd6f2831c
|
|
| BLAKE2b-256 |
93c0f32d50e15f3423f267c9158728e663ba095ed5329a218f414d1eead6fe1e
|


