OGC Observations & Measurements REST API (compliant with OM-JSON OGC DP 15-100r1 and GeoJSON, used by WMO WHOS DAB) client. Part of WMO HydroSOS project

Project description
WHOS data retrieval functionality for HydroSOS
Purpose
To facilitate interoperable timeseries data & metadata retrieval from the WHOS (WMO Hydrological Observations System) DAB (Data Access Broker) using the OM (OGC Observations & Measurements) API.
Features
- Features (monitoring points) retrieval
- Timeseries observations metadata retrieval
- Timeseries observations data retrieval
- Deals with pagination (retrieves next page until last). Optionally retrieve only first n records
- Data/metadata filtering by feature, variable, spatial bounding box, time period, interpolation type, aggregation duration, and others (implements all OM-API filters)
- convert to pandas DataFrame, GeoJSON and CSV
- may be used as:
- import module in python, or
- CLI (Command Line Interface)
TO DO
- properties retrieval
- bulk data download (multiple timeseries observations)
How to use to retrieve WHOS data
-
Register into WHOS and save your access token
-
Install this module (see Installation)
-
Explore WHOS portals and search engines to discover the timeseries of interest
- https://community.wmo.int/en/whos-portals
- https://whos.geodab.eu/gs-service/om-api
- https://alerta.ina.gob.ar/wmlclient/wml/
- https://whos.geodab.eu/gs-service/whos/search
-
Alternatively, retrieve features and timeseries observation metadata as shown in the examples below
-
Take note of the feature id (site) plus observedProperty, or the observationIdentifier of the timeseries of interest
-
Use either a python script or notebook or the CLI to get the data (see examples below) for a given time period
Installation
pip install om-api-client
om-api-client init # creates config file (with default values)
Config file location
- Linux: $HOME/.om-api-client.yml
- Windows: %USERPROFILE%/.om-api-client.yml
- MacOS: $HOME/.om-api-client.yml
You can insert your access token and change other config parameters by editing the config file.
Output
Output format of data retrieval is either:
-
a JSON-serializable list of dicts:
[ { "date": "ISO format date string", "value": float }, ... ] -
or CSV:
date,value
string,float
...
Use
Python script / notebook
from om_api_client import OmApiClient, timeseriesMetadataToDataFrame, featuresToDataFrame, featuresToGeoJSON
import pandas
import plotly.express as px
import logging
from datetime import datetime
parameters
begin_date = "1990-01-01"
end_date = str(datetime.now())[0:10]
feature_id = "FAAC49BA633EFF325BE5D2BA81BE14574A268ABA"
observation_identifiers_csv = "data/ina_timeseries.csv"
observed_property = "Discharge"
aggregation_duration = "P1M"
Instantiate client
client = OmApiClient()
retrieve timeseries using site and variable ids
ts_metadata = client.getTimeseries(
    feature=feature_id,
    observedProperty=observed_property,
    aggregationDuration=aggregation_duration)
Inspect metadata
len(ts_metadata["member"])
Select observation identifier
observationIdentifier = ts_metadata["member"][0]["id"] # '18EB307E3D1C45D3A2842D710A41001AB5083041'
retrieve data
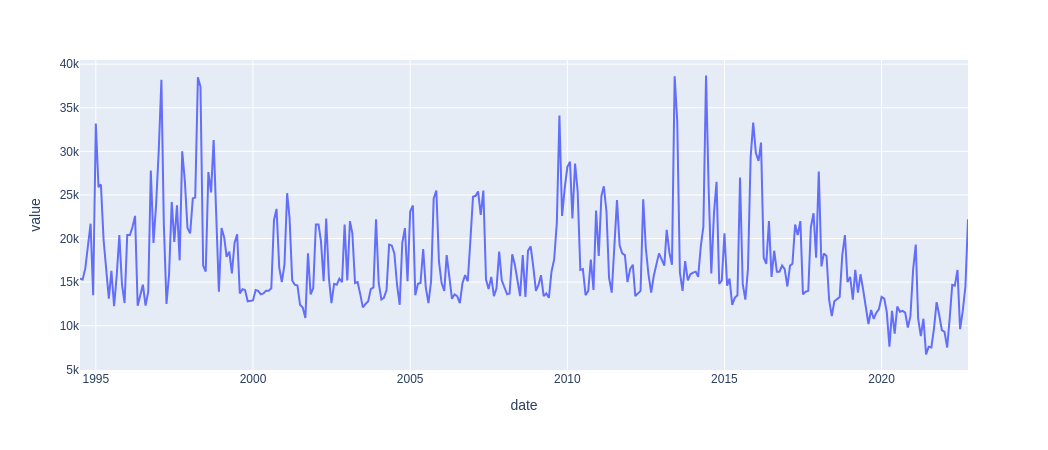
data = client.getData(
    begin_date,
    end_date,
    observationIdentifier = observationIdentifier)
convert to dataframe and plot
df = pandas.DataFrame(data)
df["date"] = pandas.to_datetime(df["date"])
df = df.set_index("date")
px.line(df.reset_index(), x="date", y="value")
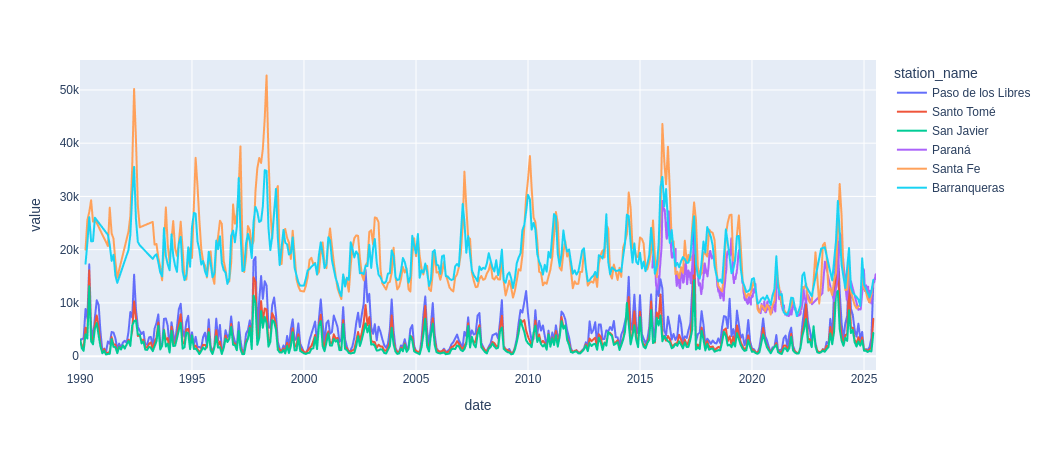
read observation identifiers from csv, retrieve data and plot together
from io import StringIO
csv_data = """stream,station_name,station_id,variable,ObservationId
URUGUAY,Paso de los Libres,72,monthly discharge,8272678FE72DB91CD511E653099DB3219DEE615B
URUGUAY,Santo Tomé,68,monthly discharge,18A95E501B2C4EEC191BE2215D87DDF107AF8A42
URUGUAY,San Javier,65,monthly discharge,9DB2FD5D21BE8FFDF36B699E3CC607CD98FFFB03
PARANA,Paraná,29,monthly discharge,B569750A1B728AB62D03460068CF80CCCD011D13
PARANA,Santa Fe,30,monthly discharge,97A1C9210A637D94FB29B5BACB0500E0F353AB04
PARANA,Barranqueras,20,monthly discharge,24F40961A057CE7DC723EE86BBA3B39729F03CBC
"""
stations = pandas.read_csv(StringIO(csv_data))
df_batch = client.getDataBatch(
        begin_date,
        end_date,
        observationIdentifiers = stations,
        recursive = False
)

px.line(df_batch, x = "date", y = "value", color = "ObservationId")
get metadata first page
ts_metadata = client.getTimeseries(
    observedProperty=observed_property,
    limit=50)
ts_metadata.keys() #  dict_keys(['id', 'member', 'completed', 'resumptionToken'])
len(ts_metadata["member"]) # 50
ts_metadata["completed"] # False
get metadata all pages
ts_metadata = client.getTimeseriesWithPagination(
    observedProperty=observed_property,
    limit=50)
len(ts_metadata["member"]) #  > 50
df_ts = timeseriesMetadataToDataFrame(ts_metadata)
df_ts.head(5)
| sourceId | observedProperty | beginDate | endDate | featureId | ObservationId | uom | interpolationType | aggregationDuration | |
|---|---|---|---|---|---|---|---|---|---|
| 0 | argentina-ina | Discharge, stream | 2020-08-06T03:00:00Z | 2020-08-31T03:00:00Z | 00D3297FBC6A70359AC9C78EC0A56AE2EBBD8B6C | 04CE047C0DF5A150C3FD9F7FD9B75F7E6098EFC9 | metros cúbicos por segundo | Continuous/Instantaneous | None |
| 1 | argentina-ina | Discharge, stream | 2020-08-01T03:00:00Z | 2020-08-01T03:00:00Z | 00D3297FBC6A70359AC9C78EC0A56AE2EBBD8B6C | 33DC6C9A6EC6777C8C1E57391C0539749DC40BE3 | metros cúbicos por segundo | Average in succeeding interval | P1M |
| 2 | argentina-ina | Discharge, stream | 2020-08-01T03:00:00Z | 2020-08-01T03:00:00Z | 00D3297FBC6A70359AC9C78EC0A56AE2EBBD8B6C | 363201EC2149C679D5A7A65C126916A13FABDD5D | metros cúbicos por segundo | Average in succeeding interval | P1M |
| 3 | argentina-ina | Discharge, stream | 2020-08-06T03:00:00Z | 2020-08-31T03:00:00Z | 00D3297FBC6A70359AC9C78EC0A56AE2EBBD8B6C | 68DA7DC5CB959B851B4461E8CA6A875790B8F919 | metros cúbicos por segundo | Average in succeeding interval | P1D |
| 4 | argentina-ina | Discharge, stream | 2020-08-01T03:00:00Z | 2020-08-01T03:00:00Z | 00D3297FBC6A70359AC9C78EC0A56AE2EBBD8B6C | D170EC5D1100F30D913E60AE223E44DDDCCC7078 | metros cúbicos por segundo | Average in succeeding interval | P1M |
5 rows × 9 columns
get features first page
features = client.getFeatures(
    observedProperty=observed_property,
    limit=50)
get features with pagination
features = client.getFeaturesWithPagination(
    observedProperty=observed_property,
    limit=50)
features["results"][0]
{
  "shape": {
    "coordinates": [-57.938011, -31.273969],
    "type": "Point"
  },
  "parameter":
    [
      {
        "name": "country",
        "value": "Argentina"
      },
      {
        "name": "source",
        "value": "Argentina, Instituto Nacional del Agua (INA)"
      },
      {
        "name": "sourceId",
        "value": "argentina-ina"
      },
      {
        "name": "identifier",
        "value": "argentina-ina:alturas_prefe:89"
      }
    ],
  "name": "Aporte Salto Grande",
  "id": "00D3297FBC6A70359AC9C78EC0A56AE2EBBD8B6C",
  "relatedParty": []}
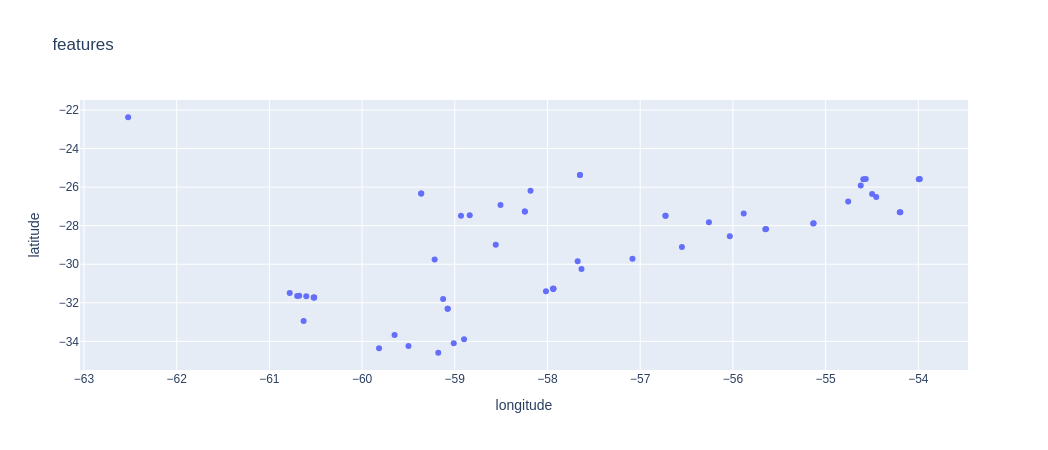
df_features = featuresToDataFrame(features)
df_features.head(5)
| longitude | latitude | country | sourceId | identifier | name | id | author | |
|---|---|---|---|---|---|---|---|---|
| 0 | -57.938011 | -31.273969 | Argentina | argentina-ina | argentina-ina:alturas_prefe:89 | Aporte Salto Grande | 00D3297FBC6A70359AC9C78EC0A56AE2EBBD8B6C | None |
| 1 | -60.780556 | -31.491222 | Argentina | argentina-ina | argentina-ina:alturas_bdhi:103 | Recreo - Ruta Provincial nº 70 | 02E07E2F72A815E237B7896D79BC68193EF3A0A6 | None |
| 2 | -58.558333 | -28.995000 | Argentina | argentina-ina | argentina-ina:sat2:2832 | Corriente - Paso Lucero | 083988DC8C2E39D6E0C82B296A857F6A088B8028 | None |
| 3 | -57.633333 | -30.250000 | Argentina | argentina-ina | argentina-ina:alturas_prefe:74 | Monte Caseros | 0DF4C4284AA14E0A545C0F855B4F6FF558693CEE | None |
| 4 | -55.883333 | -27.366667 | Argentina | argentina-ina | argentina-ina:alturas_prefe:14 | Posadas | 23137FB463C0902450418E9E2F0D38C719419AA9 | None |
featuresToGeoJSON(features)
{
  "type": "FeatureCollection",
  "features": [
    {
      "geometry": {
        "coordinates": [-57.938011, -31.273969],
        "type": "Point"
      },
      "properties": {
        "longitude": -57.938011,
        "latitude": -31.273969,
        "country": "Argentina",
        "sourceId": "argentina-ina",
        "identifier": "argentina-ina:alturas_prefe:89",
        "name": "Aporte Salto Grande",
        "id": "00D3297FBC6A70359AC9C78EC0A56AE2EBBD8B6C",
        "author": null
      }
    },
    ...
  ]
}
px.scatter(featuresToDataFrame(features), "longitude", "latitude", hover_name = "name", title = "features")
Command line interface
data
$ om-api-client data --help
Usage: om-api-client data [OPTIONS] BEGIN_POSITION END_POSITION

Options:
  -t, --token TEXT                WHOS access token
  -u, --url TEXT                  WHOS OM OGC timeseries API url
  -o, --output TEXT               Save result into this file (instead of print
                                  on stdout)
  -c, --csv                       Use CSV format for output (instead of JSON)
  -m, --monitoring_point TEXT     site identifier. It must be user together
                                  with --variable_name
  -v, --variable_name TEXT        variable identifier. It must be used
                                  together with --monitoring_point
  -s, --timeseries_identifier TEXT
                                  timeseries identifier. If set,
                                  --monitoring_point and --variable_name are
                                  ignored
  -a, --aggregation_duration TEXT
                                  Time aggregation that has occurred to the
                                  value in the timeseries, expressed as
                                  ISO8601 duration (e.g., P1D)
  -d, --debug                     Log debug messages
  -r, --recursive                 Get data recursively until endPosition is
                                  reached. The API has a is a limit of 5000
                                  records per request
  --help                          Show this message and exit.
examples
# retrieve data using feature id + variable id + aggregation duration (-m + -v + -a)
# output json to stdout
om-api-client data -m FAAC49BA633EFF325BE5D2BA81BE14574A268ABA -v Discharge -a P1M 1990-01-01 2024-05-01
# output to json file
om-api-client data -m FAAC49BA633EFF325BE5D2BA81BE14574A268ABA -v Discharge -a P1M -o /tmp/data.json 1990-01-01 2024-05-01
# output csv to stdout
om-api-client data -m FAAC49BA633EFF325BE5D2BA81BE14574A268ABA -v Discharge -a P1M -c 1990-01-01 2024-05-01
# output to csv file
om-api-client data -m FAAC49BA633EFF325BE5D2BA81BE14574A268ABA -v Discharge -a P1M -o /tmp/data.csv -c 1990-01-01 2024-05-01
# retrieve using timeseries observation id (-s)
om-api-client data -s 18EB307E3D1C45D3A2842D710A41001AB5083041 1990-01-01 2024-05-01
# retrieve recursively (-r). Sends additional requests until end date is reached
om-api-client data -s 18EB307E3D1C45D3A2842D710A41001AB5083041 1990-01-01 2024-05-01 -r
metadata
$ om-api-client metadata --help
Usage: om-api-client metadata [OPTIONS]

Options:
  -t, --token TEXT                WHOS access token
  -u, --url TEXT                  WHOS OM OGC timeseries API url
  -o, --output TEXT               Save result into this file (instead of print
                                  on stdout)
  -m, --monitoring_point TEXT     site (feature) identifier. It must be user
                                  together with --variable_name
  -v, --variable_name TEXT        variable identifier (=observedProperty). It
                                  must be used together with
                                  --monitoring_point
  -s, --timeseries_identifier TEXT
                                  timeseries identifier. If set,
                                  --monitoring_point and --variable_name are
                                  ignored
  -l, --limit INTEGER             pagination page size
  -h, --has_data                  return only observations with data
  -W, --west FLOAT                west longitude of bounding box
  -S, --south FLOAT               south latitude of bounding box
  -E, --east FLOAT                east longitude of bounding box
  -N, --north FLOAT               north latitude of bounding box
  -O, --ontology TEXT             The ontology to be used to expand the
                                  observed property search term (or URI) with
                                  additional terms from the ontology that are
                                  synonyms and associated to narrower
                                  concepts. Two ontologies are available: whos
                                  or his-central
  -V, --view TEXT                 Identifier of the data subset interesting
                                  for the user
  -T, --time_interpolation TEXT   The interpolation used on the time axis (for
                                  example, MAX, MIN, TOTAL, AVERAGE, MAX_PREC,
                                  MAX_SUCC, CONTINUOUS, ...)
  -i, --intended_observation_spacing TEXT
                                  The expected duration between individual
                                  observations, expressed as ISO8601 duration
                                  (e.g., P1D)
  -a, --aggregation_duration TEXT
                                  Time aggregation that has occurred to the
                                  value in the timeseries, expressed as
                                  ISO8601 duration (e.g., P1D)
  -f, --format TEXT               Response format (e.g. JSON or CSV)
  -F, --filter KEY=VALUE          Set additional filters as key=value. Valid
                                  keys: country, provider
  -1, --first_page_only           Retrieve only first page.
  -r, --resumption_token TEXT     Retrieve next page using the provided
                                  resumption token
  -d, --debug                     Log debug messages
  --help                          Show this message and exit.
examples
# retrieve timeseries observations metadata with variable name filter (-v) and custom page size (-l)
om-api-client metadata -l 50 -v Discharge -o /tmp/whos_metadata.json
# with provider (-F provider=), variable name (-v), ontology (-O). Retrieve first 10 records (-1 -l 10), save as csv (-f csv)
om-api-client metadata -F provider=brazil-inmet -v Precipitation -O whos -1 -l 10 -o /tmp/md_inmet.csv -f csv
features (monitoring points)
$ om-api-client features --help
Usage: om-api-client features [OPTIONS]

Options:
  -t, --token TEXT                WHOS access token
  -u, --url TEXT                  WHOS OM OGC timeseries API url
  -o, --output TEXT               Save result into this file (instead of print
                                  on stdout)
  -m, --monitoring_point TEXT     site (feature) identifier. It must be user
                                  together with --variable_name
  -v, --variable_name TEXT        variable identifier (=observedProperty). It
                                  must be used together with
                                  --monitoring_point
  -s, --timeseries_identifier TEXT
                                  timeseries identifier. If set,
                                  --monitoring_point and --variable_name are
                                  ignored
  -l, --limit INTEGER             pagination page size
  -W, --west FLOAT                west longitude of bounding box
  -S, --south FLOAT               south latitude of bounding box
  -E, --east FLOAT                east longitude of bounding box
  -N, --north FLOAT               north latitude of bounding box
  -O, --ontology TEXT             The ontology to be used to expand the
                                  observed property search term (or URI) with
                                  additional terms from the ontology that are
                                  synonyms and associated to narrower
                                  concepts. Two ontologies are available: whos
                                  or his-central
  -V, --view TEXT                 Identifier of the data subset interesting
                                  for the user
  -T, --time_interpolation TEXT   The interpolation used on the time axis (for
                                  example, MAX, MIN, TOTAL, AVERAGE, MAX_PREC,
                                  MAX_SUCC, CONTINUOUS, ...)
  -i, --intended_observation_spacing TEXT
                                  The expected duration between individual
                                  observations, expressed as ISO8601 duration
                                  (e.g., P1D)
  -a, --aggregation_duration TEXT
                                  Time aggregation that has occurred to the
                                  value in the timeseries, expressed as
                                  ISO8601 duration (e.g., P1D)
  -F, --filter KEY=VALUE          Set additional filters as key=value. Valid
                                  keys: beginPosition, endPosition,
                                  spatialRelation, predefinedLayer, country,
                                  provider
  -f, --format TEXT               Response format (e.g. JSON (raw), GeoJSON or
                                  CSV)
  -1, --first_page_only           Retrieve only first page.
  -r, --resumption_token TEXT     Retrieve next page using the provided
                                  resumption token
  -d, --debug                     Log debug messages
  --help                          Show this message and exit.
examples
# retrieve features with variable name filter (-v) and custom page size (-l)
om-api-client features -l 50 -v Discharge -o /tmp/whos_features.json
# as csv
om-api-client features -l 50 -v Discharge -o /tmp/whos_features.csv -f csv
# as geojson
om-api-client features -l 50 -v Discharge -o /tmp/whos_features.geojson -f geojson
# with country filter (-F country=)
om-api-client features -l 50 -F country=ARG -o /tmp/whos_features.json
# with provider filter (-F provider=)
om-api-client features -l 50 -F provider=argentina-ina -o /tmp/whos_features.json
batch download
$ om-api-client batch --help
Usage: om-api-client batch [OPTIONS] BEGIN_POSITION END_POSITION
                           TIMESERIES_IDENTIFIERS OUTPUT

  Retrieve timeseries data sequentially for all identifiers found in provided
  csv file

  BEGIN_POSITION: Begin date YYYY-MM-DD

  END_POSITION: End date YYYY-MM-DD

  TIMESERIES_IDENTIFIERS: csv file containing timeseries identifiers

  OUTPUT: Save results into this directory

Options:
  -t, --token TEXT      WHOS access token
  -u, --url TEXT        WHOS OM OGC timeseries API url
  -c, --csv             Use CSV format for output (instead of JSON)
  -i, --id_column TEXT  Column of timeseries_identifiers containing the ids
  -d, --debug           Log debug messages
  -r, --recursive       Get data recursively until endPosition is reached. The
                        API has a is a limit of 5000 records per request
  --help                Show this message and exit.
examples
om-api-client batch 1990-01-01 2025-07-15 data/timeseries_identifiers.csv data/downloads -r
Credits
Programa de Sistemas de Información y Alerta Hidrológico de la Cuenca del Plata
Laboratorio de Hidrología
Instituto Nacional del Agua
Argentina
2025-07-15
Release history Release notifications | RSS feed


Download files
Download the file for your platform. If you're not sure which to choose, learn more about installing packages.
Source Distribution
Built Distribution
Filter files by name, interpreter, ABI, and platform.
If you're not sure about the file name format, learn more about wheel file names.
Copy a direct link to the current filters
File details
Details for the file om-api-client-0.0.0.dev5.tar.gz.
File metadata
- Download URL: om-api-client-0.0.0.dev5.tar.gz
- Upload date:
- Size: 382.8 kB
- Tags: Source
- Uploaded using Trusted Publishing? No
- Uploaded via: twine/6.1.0 CPython/3.12.3
File hashes
| Algorithm | Hash digest | |
|---|---|---|
| SHA256 |
859aa6ae76a9463c3d9fc85a93627705df5362b7914cccdd23cd441bfdbb76d4
|
|
| MD5 |
48eaf95de1cfc0442425c5ea049ae151
|
|
| BLAKE2b-256 |
3394323de3ac822992a5bf14b7b8c3c76fca41497888ca17b0b5cd23de1821a7
|
File details
Details for the file om_api_client-0.0.0.dev5-py3-none-any.whl.
File metadata
- Download URL: om_api_client-0.0.0.dev5-py3-none-any.whl
- Upload date:
- Size: 15.2 kB
- Tags: Python 3
- Uploaded using Trusted Publishing? No
- Uploaded via: twine/6.1.0 CPython/3.12.3
File hashes
| Algorithm | Hash digest | |
|---|---|---|
| SHA256 |
46e069b5cad4e7c2d206347a7b25ec9060bd76e73b33ef9eceb95dc5ad502773
|
|
| MD5 |
d0121bb413d75fb5c0d08e6d9e5fd566
|
|
| BLAKE2b-256 |
ed4823555da189003b112f32823f34d52a02277b9510da82b427f9527ff86bf6
|


