Whisp (What is in that plot) is an open-source solution which helps to produce relevant forest monitoring information and support compliance with deforestation-related regulations.

Reason this release was yanked:
incorrect versioning - should be alpha release
Project description
whisp


Convergence of Evidence
Whisp stands for "What is in that plot"?
Numerous publicly available Earth Observation maps provide data on tree cover, land use, and forest disturbances. However, these maps often differ from one another because they use various definitions and classification systems. As a result, no single map can provide a complete picture of any specific area. To address this issue, the Forest Data Partnership (FDaP) and the AIM4Forests Programme advocate for the Convergence of Evidence approach.
The Forest Data Partnership promotes this approach for forest and commodities monitoring, assuming that
- no single source of geospatial data can tell the whole story around any given plot of land;
- all the existing, published and available datasets contribute to telling that story.
Contents
- Whisp pathways
- Whisp datasets
- Whisp notebooks
- System setup
- Add data layers
- Contribute to the code
- Code of conduct
Whisp pathways
Whisp can currently be used directly or implemented in your own code through three different pathways:
-
The Whisp App with its simple interface can be used right here or called from other software by API. The Whisp App currently supports the processing of up to 500 geometries per job. The original JS & Python code behind the Whisp App and API can be found here.
-
Whisp in Earthmap supports the visualization of geometries on actual maps with the possibility to toggle different relevant map products around tree cover, commodities and deforestation. It is practical for demonstration purposes and spot checks of single geometries but not recommended for larger datasets.
-
Datasets of any size, especially when holding more than 500 geometries, can be "whisped" through the Jupyter Notebook in this repository. They can either be uploaded as GeoJSONs or accessed through GEE assets. For the detailed procedure please go to the section Whisp notebooks.
Whisp datasets
Whisp implements the convergence of evidence approach by providing a transparent and public processing flow using datasets covering the following categories:
- Tree and forest cover (at the end of 2020);
- Commodities (i.e., crop plantations and other agricultural uses at the end of 2020);
- Disturbances before 2020 (i.e., degredation or deforestation until 2020-12-31);
- Disturbances after 2020 (i.e., degredation or deforestation from 2021-01-01 onward).
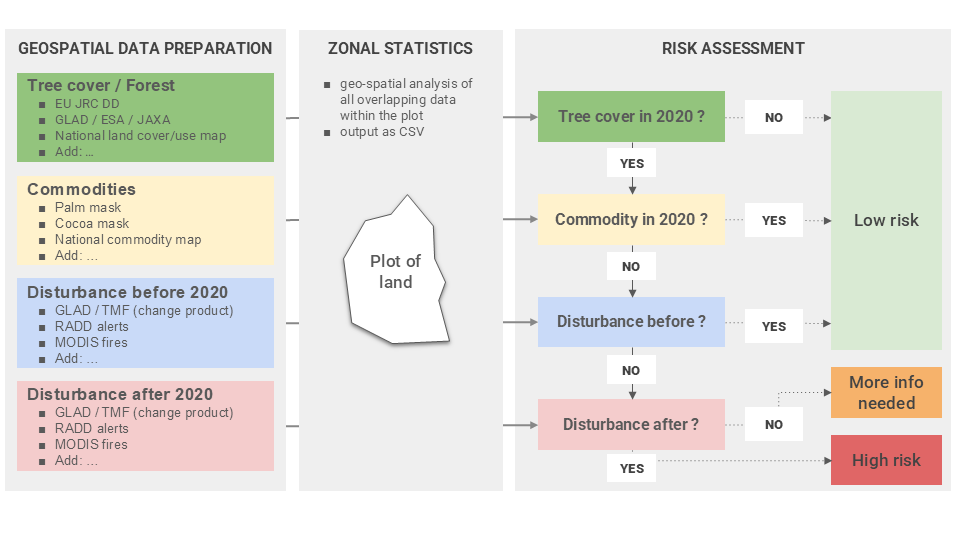
There are multiple datasets for each category. Find the full current list of datasets used in Whisp here. Whisp checks the plots provided by the user by running zonal statistics on them to answer the following questions:
- Was there tree cover in 2020?
- Were there commodity plantations or other agricultural uses in 2020?
- Were there disturbances until 2020-12-31?
- Were there disturbances after 2020-12-31 / starting 2021-01-01?
If no treecover dataset indicates any tree cover for a plot by the end of 2020, Whisp will deem the deforestation risk as low.
If one or more treecover datasets indicate tree cover on a plot by the end of 2020, but a commodity dataset indicates agricultural use by the end of 2020, Whisp will deem the deforestation risk as low.
If treecover datasets indicate tree cover on a plot by late 2020, no commodity datasets indicate agricultural use, but a disturbance datasets indicates disturbances before the end of 2020, Whisp will deem the deforestation risk as low. Such deforestation has happened before the EUDR cutoff date and therefore does not count as high risk for the EUDR.
Now, if the datasets under 1., 2. & 3. indicate that there was tree cover, but no agriculture and no disturbances before or by the end of 2020, the Whisp algorithm checks whether degredation or deforestation have been reported in a disturbance dataset after 2020-12-31. If they have, Whisp will deem the deforestation risk as high.
However, under the same circumstances but with no disturbances reported after 2020-12-31 there is insufficient evidence and the Whisp output will be "More info needed". Such can be the case for, e.g., cocoa or coffee grown under the shade of treecover or agroforestry.
The Whisp algorithm visualized:

Requirements
- A Google Earth Engine (GEE) account.
- A registered cloud GEE project.
- Some experience in Python or a similar language.
Setup
Consider creating a virtual environment to keep your main python installation clean. This can be done through this command line
python -m venv env
More info on virtual environments here: https://docs.python.org/3/library/venv.html
If installing from GitHUb Clone the Whisp repo and install the package:
git clone https://github.com/forestdatapartnership/whisp.git
cd whisp/
pip install .
Create a .env file with the required information for Earth Engine login (you may copy and edit the .env.template
file found in the root directory). The file must contain the following environment variables:
# Earth Engine project name
PROJECT="my-ee-project"
Where you must replace the GEE project name by your own.
Note: this should be a registered cloud project. If unsure of this check pic here: https://developers.google.com/earth-engine/cloud/assets
Contributing
Install the package in editable mode with the additional dependencies required for testing and running pre-commit hooks:
git clone https://github.com/forestdatapartnership/whisp.git
cd whisp/
pip install -e .[dev]
Setup the pre-commit hooks:
pre-commit install
You should be able to run the Pytest suite by simple running the pytest command from the repo's root folder.
Please read the 
whisp pathways
whisp can be implemented through at least three pathways
-
As an operationnal API in JS and Python
-
Through mobile applications to enable smallholder in the field directly generate and own the monitoring data associated with their plots of land
-
Integrated through Graphical User Interfaces for demonstration and verification purposes
-
Python Notebook implementation.
More info on Whisp can be found in here
How to Whisp Your Data Using the Python Notebook Pathway
The Python notebooks are currently set up to run in Sepal and to focus on polygon data provided by the user or geo_ids that allow the notebooks to access polygons stored and registered in the Asset Registry. NB: We value your feedback in terms of what input data we should support.
If your data is available as a feature collection and the GitHub repo is cloned, you are ready to start processing. We suggest first familiarizing yourself with running the notebooks using the default inputs in the notebook code. This will allow you to understand the expected outputs and the general functionality, as well as check if the setup worked successfully.
Whisping a GeoJSON containing plot data
- Open Jupyter Lab (see Apps).
- Open the notebook
whisp_geojson.ipynbfrom inside the "notebooks" folder. - To run the notebook cells, press the Play icon, or use the Shift + Enter shortcut. For more info on Jupyter and controlling notebooks, see here.
- Once you have initialised and agreed to the Google Earth Engine access requirements, you can process a geojson file containing plot informations.
- The outputs from the notebook can be set to where you want to store them.
- Outputs from the process include a CSV file
whisp_output_table.csv. - NB If the processing job is large this may take some time. IF the outputs fail to process due to memory or time out errors, you can use the alternative function 'whisp_stats_geojson_to_drive', that sends a csv outpout to your Google drive. We are developing functionality to upload the csv automatically. In the meantime manually downloading from Google Drive and saving the csv is required. You can then import the csv as a pandas dataframe and use the 'validate_dataframe_using_lookups' function to get the Whisp output format (i.e., using a set schema for a standardised output, useful for showing in Power Bi etc).
Adding risk indicators to your results
- Finally, functions at the end of the notebook allow the user to add EUDR risk indicators to the table. NB: these risk indicators are still at the experimental stage.
Output 1
- A CSV called
whisp_output_table.csvcontains results from the whisp processing.
Output 2
- A CSV called
whisp_output_table_w_risk.csvcontains results from the whisp processing and risk indicators.
Other Files
Parameters Folder
A folder containing a series of Python scripts and a CSV. These files are used to define various parameters used in the analysis.
Key files include:
lookup_gee_datasets.csvcontains the list of input datasets, the order they will be displayed, which ones are to be excluded from the current analysis, and which ones are shown as flags (i.e., shown as presence or absence instead of figures for area/percentage coverage of the plot).config_runtime.pycontains parameters such as default file and column names. WARNING: USERS SHOULD NOT EDIT PACKAGE CONFIG ; IF THEY WANT TO, THEY SHOULD INSTALL THE PACKAGE IN EDITABLE MODE IN ORDER TO BE ABLE TO MODIFY CONFIGS WITHOUT HAVING TO RE-INSTALL THE PACKGE EVERY TIME
src code
Various functions for the main Whisp analysis along with some for interacting with the AgStack Asset Registry.
Key files:
datasets.pycontains a series of functions related to the creation of a single multiband GEE image to be used in the Whisp summary statistics analysis.stats.pycontains functions to run the Whisp analysis for each of the various datasets and to provide results for coverage of each plot as a percentage (or as an area in hectares).
Setting Up Your System
Setting Up SEPAL
SEPAL is closely linked to Google Earth Engine (GEE), a Google-powered Earth-observation cloud-computing platform, as it builds in many of its functionalities. Currently, you will need to have connected SEPAL and GEE accounts. SEPAL provides a stable processing environment and allows you to link up with your Google account saving time with permissions. Currently, we are supporting the use within SEPAL, but you can run the scripts outside of SEPAL if required, although this will require extra code to account for the various dependencies SEPAL already has built in.
- Login to SEPAL.
- Start an instance (see Terminal info) to provide you with free processing power.
- If you don’t have SEPAL set up:
- To create a SEPAL account, please follow the registration steps described here and then familiarize yourself with the tool by exploring its interface.
- To create a Google Earth Engine (GEE) account, please follow these steps and don’t forget to initialize the home folder.
Setting Up the Whisp GitHub Repository
-
Make sure you have a GitHub account set up.
-
To run the Whisp notebooks in SEPAL, you need to copy the Whisp repository into your SEPAL files. The notebooks rely on functions and parameters that are stored in other files in this repository.
-
To clone (i.e., copy) the GitHub repository so that it is accessible in SEPAL, type into the SEPAL terminal:
git clone https://github.com/forestdatapartnership/whisp.git
-
If this works, on the left-hand pane you should now be able to view a Whisp folder containing Notebooks along with other supporting files and folders.
How to add data layers to Whisp
There are two main approaches: to request a layer be incorporated into the core Whisp inputs, or to add in your own data directly to complement the core ones in Whisp
Requesting a dataset addition
If you think a particular dataset has wide applicability for Whisp users, you can request it be added to the main Whisp repository by logging as an issue in Github [here] (https://github.com/forestdatapartnership/whisp/issues/).
Adding your own dataset for a bespoke Whisp analysis (using the Python Notebooks)
Adding your To add other datasets, such as that are specific to your circumstances, or can’t be shared directly in GEE, follow the steps and guidance below.
- Edit modules/datasets.py and add in a function to make a binary GEE image (i.e., where values are either 0 or 1*). Make sure the function name ends with "_prep", as only functions with this suffix are used.
- Choose a name to represent the data layer in the final CSV output. Place in speech brackets in the .rename() section at the end of the function. See examples elsewhere in the functions in this script.
- Edit parameters/lookup_gee_datasets.csv to include the chosen dataset name in a new row. Make sure other relevant columns are filled in.
The above assumes a single band image that is being included, which results in a single column being added. If you have multiband images to add and want each band to be a layer in Whisp, make sure each band is named. Make sure to add all the bands to the lookup CSV (see Step 3), else they won’t appear in the output.
How to fill out the columns parameters/lookup_gee_datasets.csv a. name: the name for the dataset column. NB must be exactly the same as the name of the image band in step 1. b. order: choose a number for where you want the dataset column placed in the CSV output. c. theme: a word denoting the dataset Theme. Currently there are five themes where i to iv correspond to: i. treecover: for forest or treecover at the end of 2020 ii. commodities: representing commodities in 2020 (typically ones that tree cover might be confused with in remote sensing products). iii. disturbance_before: forest/tree cover disturbance before the end of 2020 iv. disturbance_after: forest/tree cover disturbance after the end of 2020 v. ancillary: other relevant layers, such as representing protected areas or areas of importance for biodiversity. d. use_for_risk: if 1 is added here this dataset is included in the risk calculations. The type of risk indicator it will contribute to is automatically governed by the “theme” column. NB if there is in a 1 in the "exclude_from_output" column this over-rules all of the above and the dataset is ignored. There are functions (in the modules/risk.py), to create lists for each of the 4 indicators from the lookup csv. These are used in the "whisp_risk" function for creating default columns to include in the final overall risk column. e. exclude_from_output: removes the column from the formatted final table (to remove input code out the function in the datasets.py) f. col_type: - choose 'float32' (most ) - exceptions are 'bool' for showing True/False, where values >0 gives True. e. is nullable: set to 1 f. is required: set to 0 g. corresponding variable: the name of the function for creating the dataset in datasets.py (should end with "_prep")
Tips for preparing and adding in your data
• It’s sometimes easier to do initial checks in JavaScript and check all looks ok on the map in Code Editor, and then convert the code into Python. Tools that can help convert include AI interfaces such as ChatGPT, or [geemap] (https://giswqs.medium.com/15-converting-earth-engine-javascripts-to-python-code-with-just-a-few-mouse-clicks-6aa02b1268e1/). • Check your data: Python functions will still need sense checking and putting on a map is one way to do this using functions in [geemap] (https://geemap.org/notebooks/09_plotting/) • A binary input image is expected, but non-integer values are allowed if they range between 0 and 1. This is most appropriate for datasets that have proportion of coverage in a pixel (e.g., a value of 0.5 would represent having half the pixel covered). • If you are adding timeseries data, when creating the function you can use loops/mapping to compile a multiband input and to name each band accordingly.
Contributing to the Whisp code base
Contributions to the Whisp code in GitHub are welcome. They can be made by forking the repository making and pushing the required changes, then making a pull request to the Whisp repository. After briefly reviewing the request, we can make a branch for which to make a new pull request to. If in doubt get in contact first or log as an issue [here] (https://github.com/forestdatapartnership/whisp/issues/).
Release history Release notifications | RSS feed


Download files
Download the file for your platform. If you're not sure which to choose, learn more about installing packages.
Source Distribution
Built Distribution
Filter files by name, interpreter, ABI, and platform.
If you're not sure about the file name format, learn more about wheel file names.
Copy a direct link to the current filters
File details
Details for the file openforis_whisp-0.0.1.tar.gz.
File metadata
- Download URL: openforis_whisp-0.0.1.tar.gz
- Upload date:
- Size: 41.1 kB
- Tags: Source
- Uploaded using Trusted Publishing? No
- Uploaded via: poetry/2.0.1 CPython/3.12.0 Windows/10
File hashes
| Algorithm | Hash digest | |
|---|---|---|
| SHA256 |
cddadb841cc20f4515733f95269c8278f310bef27fd41d2bca25840af54f759d
|
|
| MD5 |
429b4aa051311ae4ef1f7c81ff852def
|
|
| BLAKE2b-256 |
e1da41681172ffd882c3a7a9fff5c608cbb20470e39d25d7384fb048d6fc9cf3
|
File details
Details for the file openforis_whisp-0.0.1-py3-none-any.whl.
File metadata
- Download URL: openforis_whisp-0.0.1-py3-none-any.whl
- Upload date:
- Size: 38.4 kB
- Tags: Python 3
- Uploaded using Trusted Publishing? No
- Uploaded via: poetry/2.0.1 CPython/3.12.0 Windows/10
File hashes
| Algorithm | Hash digest | |
|---|---|---|
| SHA256 |
c36dd615877020d87e2e0d05798e32dce7f3888660b0b6b6d964edbdd9462aab
|
|
| MD5 |
92ee898ca87768b3a1e4650c3bd4c5c1
|
|
| BLAKE2b-256 |
d34de355d811ce1d49b48109959ce5d1f78012d15162f6cd519cf882c9533d39
|


