

Installation
To get the latest release:
pip install openretailscience
Alternatively, if you want the very latest version of the package you can install it from GitHub:
pip install git+https://github.com/Data-Simply/openretailscience.git
Features
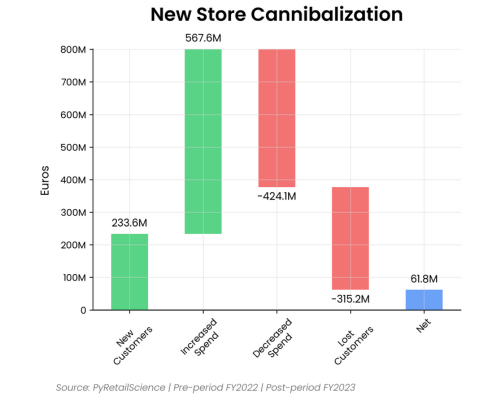
- Tailored for Retail: Leverage pre-built functions designed specifically for retail analytics. From customer segmentations to gains loss analysis, OpenRetailScience provides over a dozen building blocks you need to tackle retail-specific challenges efficiently and effectively.
-
Reliable Results: Built with extensive unit testing and best practices, OpenRetailScience ensures the accuracy and reliability of your analyses. Confidently present your findings, knowing they're backed by a robust, well-tested framework.
-
Professional Charts: Say goodbye to hours of tweaking chart styles. OpenRetailScience delivers beautifully standardized visualizations that are presentation-ready with just a few lines of code. Impress stakeholders and save time with our pre-built, customizable chart templates.
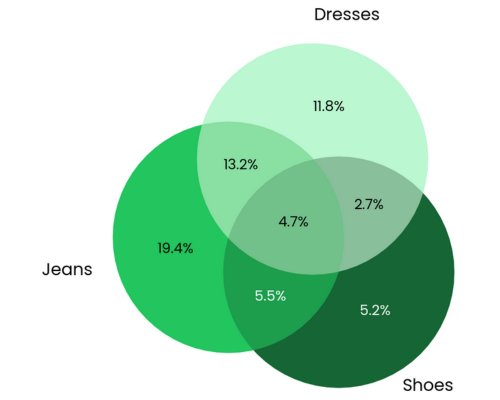
- Workflow Automation: OpenRetailScience streamlines your workflow by automating common retail analytics tasks. Easily loop analyses over different dimensions like product categories or countries, and seamlessly use the output of one analysis as input for another. Spend less time on data manipulation and more on generating valuable insights.
Examples
Gains Loss Analysis
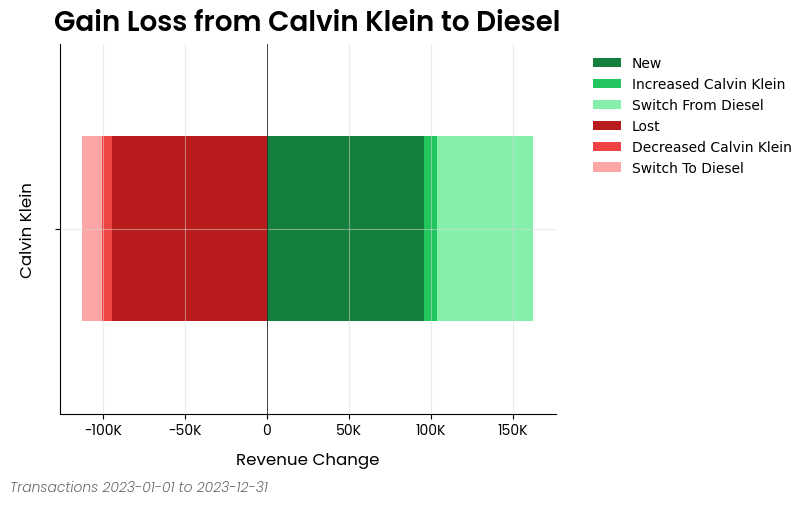
Here is an excerpt from the gain loss analysis example notebook
from openretailscience.analysis.gain_loss import GainLoss

gl = GainLoss(
    df,
    # Flag the rows of period 1
    p1_index=time_period_1,
    # Flag the rows of period 2
    p2_index=time_period_2,
    # Flag which rows are part of the focus group.
    # Namely, which rows are Calvin Klein sales
    focus_group_index=df["brand_name"] == "Calvin Klein",
    focus_group_name="Calvin Klein",
    # Flag which rows are part of the comparison group.
    # Namely, which rows are Diesel sales
    comparison_group_index=df["brand_name"] == "Diesel",
    comparison_group_name="Diesel",
    # Finally we specifiy that we want to calculate
    # the gain/loss in total revenue
    value_col="total_price",
)
# Ok now let's plot the result
gl.plot(
    x_label="Revenue Change",
    source_text="Transactions 2023-01-01 to 2023-12-31",
    move_legend_outside=True,
)
plt.show()
Cross Shop Analysis
Here is an excerpt from the cross shop analysis example notebook
from openretailscience.analysis import cross_shop

cs = cross_shop.CrossShop(
    df,
    group_1_col="category_name",
    group_1_val="Jeans",
    group_2_col="category_name",
    group_2_val="Shoes",
    group_3_col="category_name",
    group_3_val="Dresses",
    labels=["Jeans", "Shoes", "Dresses"],
)
cs.plot(
    title="Jeans are a popular cross-shopping category with dresses",
    source_text="Source: Transactions 2023-01-01 to 2023-12-31",
    figsize=(6, 6),
)
plt.show()
# Let's see which customers were in which groups
display(cs.cross_shop_df.head())
# And the totals for all groups
display(cs.cross_shop_table_df)
Customer Retention Analysis
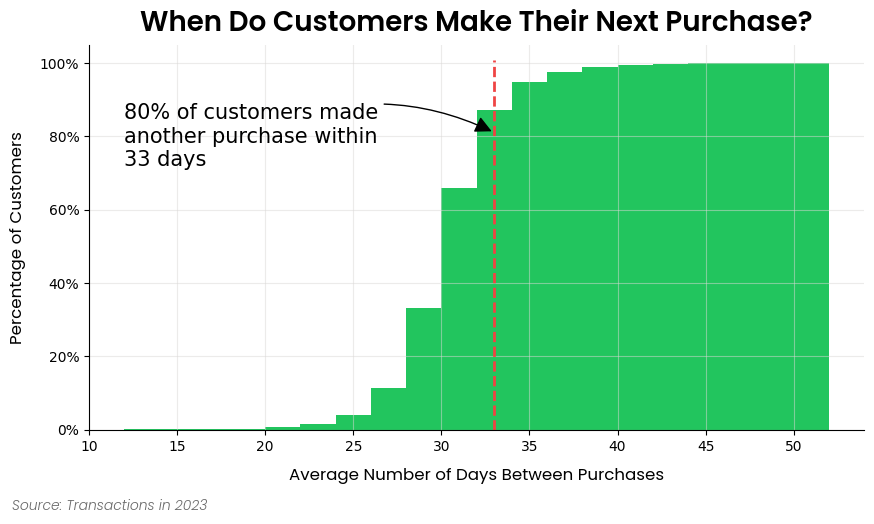
Here is an excerpt from the customer retention analysis example notebook
from openretailscience.plots import histogram
from openretailscience.plots.styles.graph_utils import set_axis_percent

ax = histogram.plot(
    df=dbp.df["avg_days_between_purchases"],
    figsize=(10, 5),
    bins=20,
    cumulative=True,
    density=True,
    source_text="Source: Transactions in 2023",
    title="When Do Customers Make Their Next Purchase?",
)
set_axis_percent(ax.yaxis, decimals=0, xmax=1.0)

# Let's dress up the chart a bit of text and get rid of the legend
churn_period = dbp.purchases_percentile(0.8)
ax.axvline(x=churn_period, color="black", linestyle="--", lw=2)
ax.annotate(
    f"80% of customers made\nanother purchase within\n{round(churn_period)} days",
    xy=(churn_period, 0.81),
    xytext=(dbp.df["avg_days_between_purchases"].min(), 0.8),
    fontsize=15,
    ha="left",
    va="center",
    arrowprops=dict(facecolor="black", arrowstyle="-|>", connectionstyle="arc3,rad=-0.25", mutation_scale=25),
)
ax.legend().set_visible(False)
plt.show()
Documentation
Please see this site for full documentation, which includes:
- Analysis Modules: Overview of the framework and the structure of the docs.
- Examples: If you're looking to build something specific or are more of a hands-on learner, check out our examples. This is the best place to get started.
- API Reference: Thorough documentation of every class and method.
Contributing
We welcome contributions from the community to enhance and improve OpenRetailScience. To contribute, please follow these steps:
- Fork the repository.
- Create a new branch for your feature or bug fix.
- Make your changes and commit them with clear messages.
- Push your changes to your fork.
- Open a pull request to the main repository's
mainbranch.
Please make sure to follow the existing coding style and provide unit tests for new features.
Contact / Support
This repository is supported by Data simply.
If you are interested in seeing what Data Simply can do for you, then please email email us. We work with companies at a variety of scales and with varying levels of data and retail analytics sophistication, to help them build, scale or streamline their analysis capabilities.
Contributors

Made with contrib.rocks.
Acknowledgements
Built with expertise doing analytics and data science for scale-ups to multi-nationals, including:
- Loblaws
- Dominos
- Sainbury's
- IKI
- Migros
- Sephora
- Nectar
- Metro
- Coles
- GANNI
- Mindful Chef
- Auchan
- Attraction Tickets Direct
- Roman Originals
Testing
OpenRetailScience includes comprehensive unit and integration tests to ensure reliability across different backends.
Unit Tests
Run unit tests using pytest:
# Install dependencies
uv sync

# Run all unit tests
uv run pytest

# Run specific test file
uv run pytest tests/test_file.py

# Run with coverage
uv run pytest --cov=openretailscience
Multi-Python Version Testing
OpenRetailScience supports Python 3.10, 3.11, 3.12, and 3.13. You can test across all supported versions locally using tox:
# Test all supported Python versions
tox -e py310,py311,py312,py313

# Test specific Python version
tox -e py313

# Run tests in parallel across versions
tox -p auto
Prerequisites:
- Multiple Python versions installed on your system
- tox installed (
uv syncinstalls it automatically)
Integration Tests
Integration tests verify that all analysis modules work correctly across different backends: distributed computing engines (PySpark, BigQuery, Snowflake) and relational databases (SQL Server, Oracle). These tests ensure the Ibis-based code paths function properly across different execution environments. SQL Server and Oracle run against throwaway Docker containers, so they execute the same way locally and in CI.
PySpark Integration Tests
The PySpark integration tests run locally using the same pytest framework as other tests.
Prerequisites:
- Python environment with dependencies installed (
uv sync)
Running locally:
# Run all PySpark tests
uv run pytest tests/integration -k "pyspark" -v

# Run specific PySpark test
uv run pytest tests/integration/test_cohort_analysis.py -k "pyspark" -v
BigQuery Integration Tests
The BigQuery integration tests verify compatibility with Google BigQuery as a backend.
Prerequisites:
- Access to a Google Cloud Platform account
- A service account with BigQuery permissions
- The service account key JSON file
- The test dataset loaded in BigQuery (dataset:
test_data, table:transactions)
Running locally:
# Set up authentication
export GOOGLE_APPLICATION_CREDENTIALS=/path/to/your/service-account-key.json
export GCP_PROJECT_ID=your-project-id

# Install dependencies
uv sync

# Run all BigQuery tests
uv run pytest tests/integration -k "bigquery" -v

# Run specific test module
uv run pytest tests/integration/bigquery/test_cohort_analysis.py -v
Snowflake Integration Tests
The Snowflake integration tests verify compatibility with Snowflake as a backend.
Prerequisites:
- Access to a Snowflake account with a warehouse, database, and schema configured
- A key-pair authentication private key (PEM format) for the Snowflake user
- The test dataset loaded in Snowflake (table:
TRANSACTIONS)
Running locally:
# Set up Snowflake connection
export SNOWFLAKE_CI_ACCOUNT=your-account-identifier
export SNOWFLAKE_CI_USER=your-username
export SNOWFLAKE_CI_WAREHOUSE=your-warehouse
export SNOWFLAKE_CI_DATABASE=your-database
export SNOWFLAKE_CI_SCHEMA=your-schema
export SNOWFLAKE_CI_PRIVATE_KEY_PATH=/path/to/your/private-key.p8

# Install dependencies
uv sync

# Run all Snowflake tests
uv run pytest tests/integration -k "snowflake" -v

# Run specific test module
uv run pytest tests/integration/test_cohort_analysis.py -k "snowflake" -v
SQL Server and Oracle Integration Tests
SQL Server and Oracle run against throwaway Docker containers, so they execute the same way locally and in CI. CI covers the supported free editions — SQL Server Developer 2022 and 2025, and Oracle 23ai Free.
These backends have a one-time setup (the SQL Server ODBC driver) and per-version image tags, so their instructions live next to the Compose files. See tests/integration/docker/README.md for prerequisites, the version matrix, and the commands to start a container and run the tests.
License
This project is licensed under the Elastic License 2.0 - see the LICENSE file for details.
1 maintainer

Release files for openretailscience 0.48.0
For a detailed explanation of source distributions (sdists) and built distributions (wheels), please see the package formats documentation.
Source distribution (sdist)
| File | Size | Uploaded | |
|---|---|---|---|
| openretailscience-0.48.0.tar.gz | 10.1 MB | Details |
Built distribution (wheel)
| File | Interpreter | ABI | Platform | Reset |
|---|---|---|---|---|
| openretailscience-0.48.0-py3-none-any.whl | Python 3 | none | any | Details |
Total release size: 10.7 MB
Release files / openretailscience-0.48.0.tar.gz
| Download URL | openretailscience-0.48.0.tar.gz |
|---|---|
| Size | 10.1 MB |
| Tags | Source |
|
SHA-256 checksum How to use checksums |
e0286d20217a991ee11174c196125b113416cced6d60a944b35496f4652020aa
|
|
BLAKE2b-256 checksum How to use checksums |
825832bb8599b48097128f3d64e78cdb3cd117079cfc9bef229e3bcf9a950ac7
|
| Upload date | |
|
Uploaded using Trusted Publishing? What is trusted publishing? |
Yes |
| Uploaded via |
twine/6.1.0 CPython/3.13.14
|
Provenance
Provenance describes where a file came from. On PyPI, provenance is shared via attestations, which provide a verifiable record of the build or publishing details. View details, limitations and caveats.


PyPI Publish Attestation
PyPI verified that this artifact, at this checksum, originated from the publisher listed below.
Signed by GitHub Actions, verified by PyPI on Jul 31, 2026.
Transparency logRelease files / openretailscience-0.48.0-py3-none-any.whl
| Download URL | openretailscience-0.48.0-py3-none-any.whl |
|---|---|
| Size | 618.1 kB |
| Tags | Python 3 |
|
SHA-256 checksum How to use checksums |
7eeb3cd78335d9145d8407bb7958da680d2f3ef7ac5f55eaf1e3056636116bc0
|
|
BLAKE2b-256 checksum How to use checksums |
5e1f3daadd2ff3b71db0a9077dc171fb433e90a042129e6217aa2c2a0c004f38
|
| Upload date | |
|
Uploaded using Trusted Publishing? What is trusted publishing? |
Yes |
| Uploaded via |
twine/6.1.0 CPython/3.13.14
|
Provenance
Provenance describes where a file came from. On PyPI, provenance is shared via attestations, which provide a verifiable record of the build or publishing details. View details, limitations and caveats.
PyPI Publish Attestation
PyPI verified that this artifact, at this checksum, originated from the publisher listed below.
Signed by GitHub Actions, verified by PyPI on Jul 31, 2026.
Transparency log













