
OpenStatz




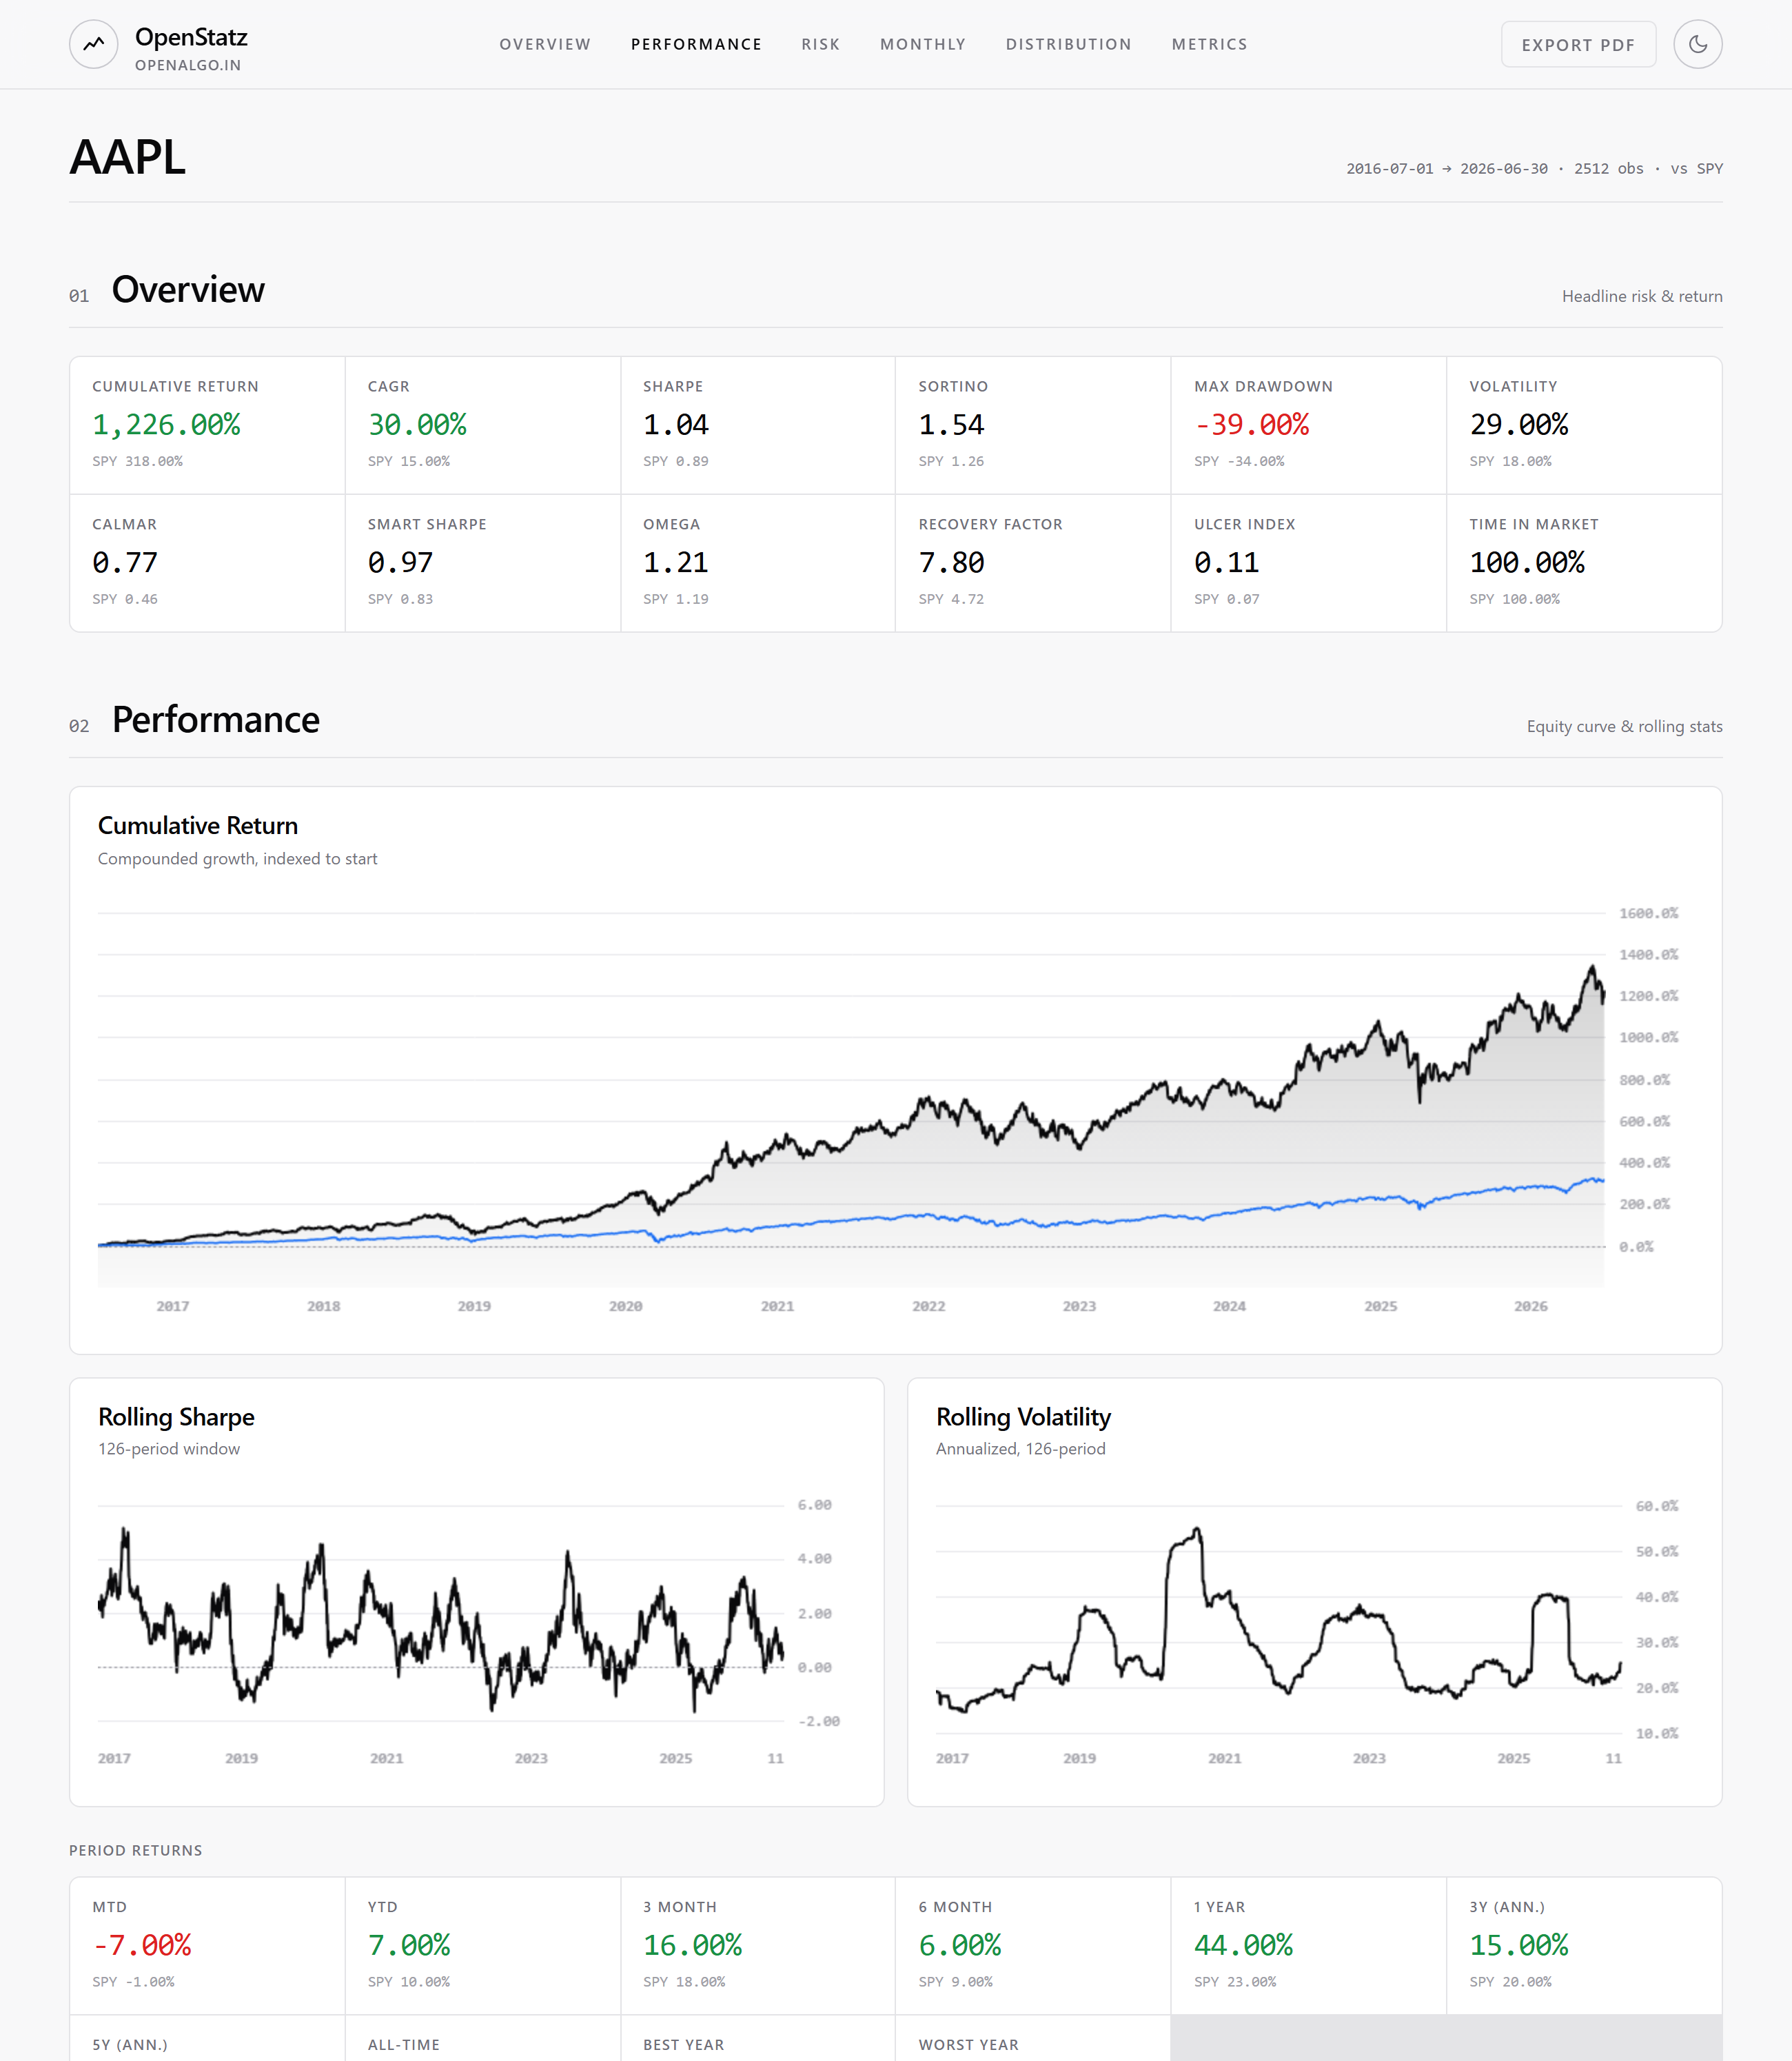
OpenStatz is a modern rebuild of QuantStats. It gives you the same portfolio analytics and the same numbers, plus a modern, interactive web tearsheet you can open in a browser — all in a single offline HTML file, no server required.
Maintained by OpenAlgo and marketcalls.
What you can do
- Use it in Python as a drop-in for QuantStats.
- Generate the modern web tearsheet as a single offline HTML file. It works on a plain
pip install openstatz, with no server and no Node.js. - Or run the same dashboard as a live server (
openstatz serve) to type tickers and upload CSVs. - Send your backtest returns (a CSV file or a pandas Series) and get a full report.
- Compare several strategies side by side and see which one is better on each metric.
Inside the tearsheet
The dashboard is organized into scannable sections — equity and rolling stats, risk, seasonality, and return distribution — with light and dark themes and one-click PDF export.
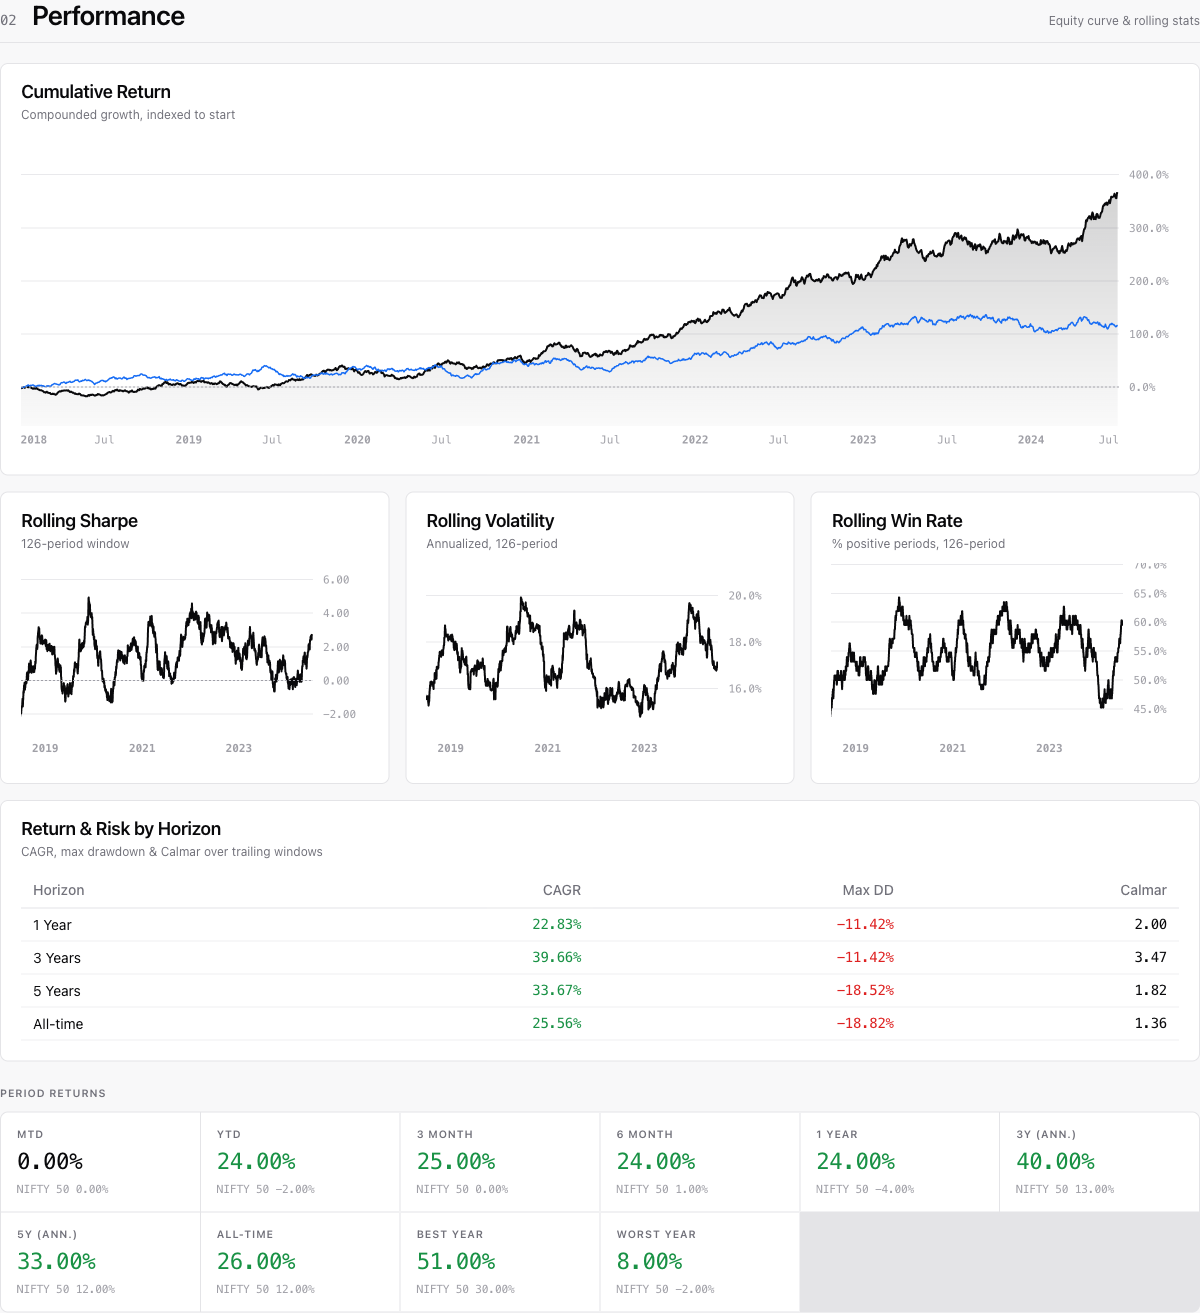
Performance — equity curve, rolling Sharpe / volatility / win-rate, and a Return & Risk by Horizon table (CAGR, max drawdown and Calmar over trailing 1Y / 3Y / 5Y / all-time windows):
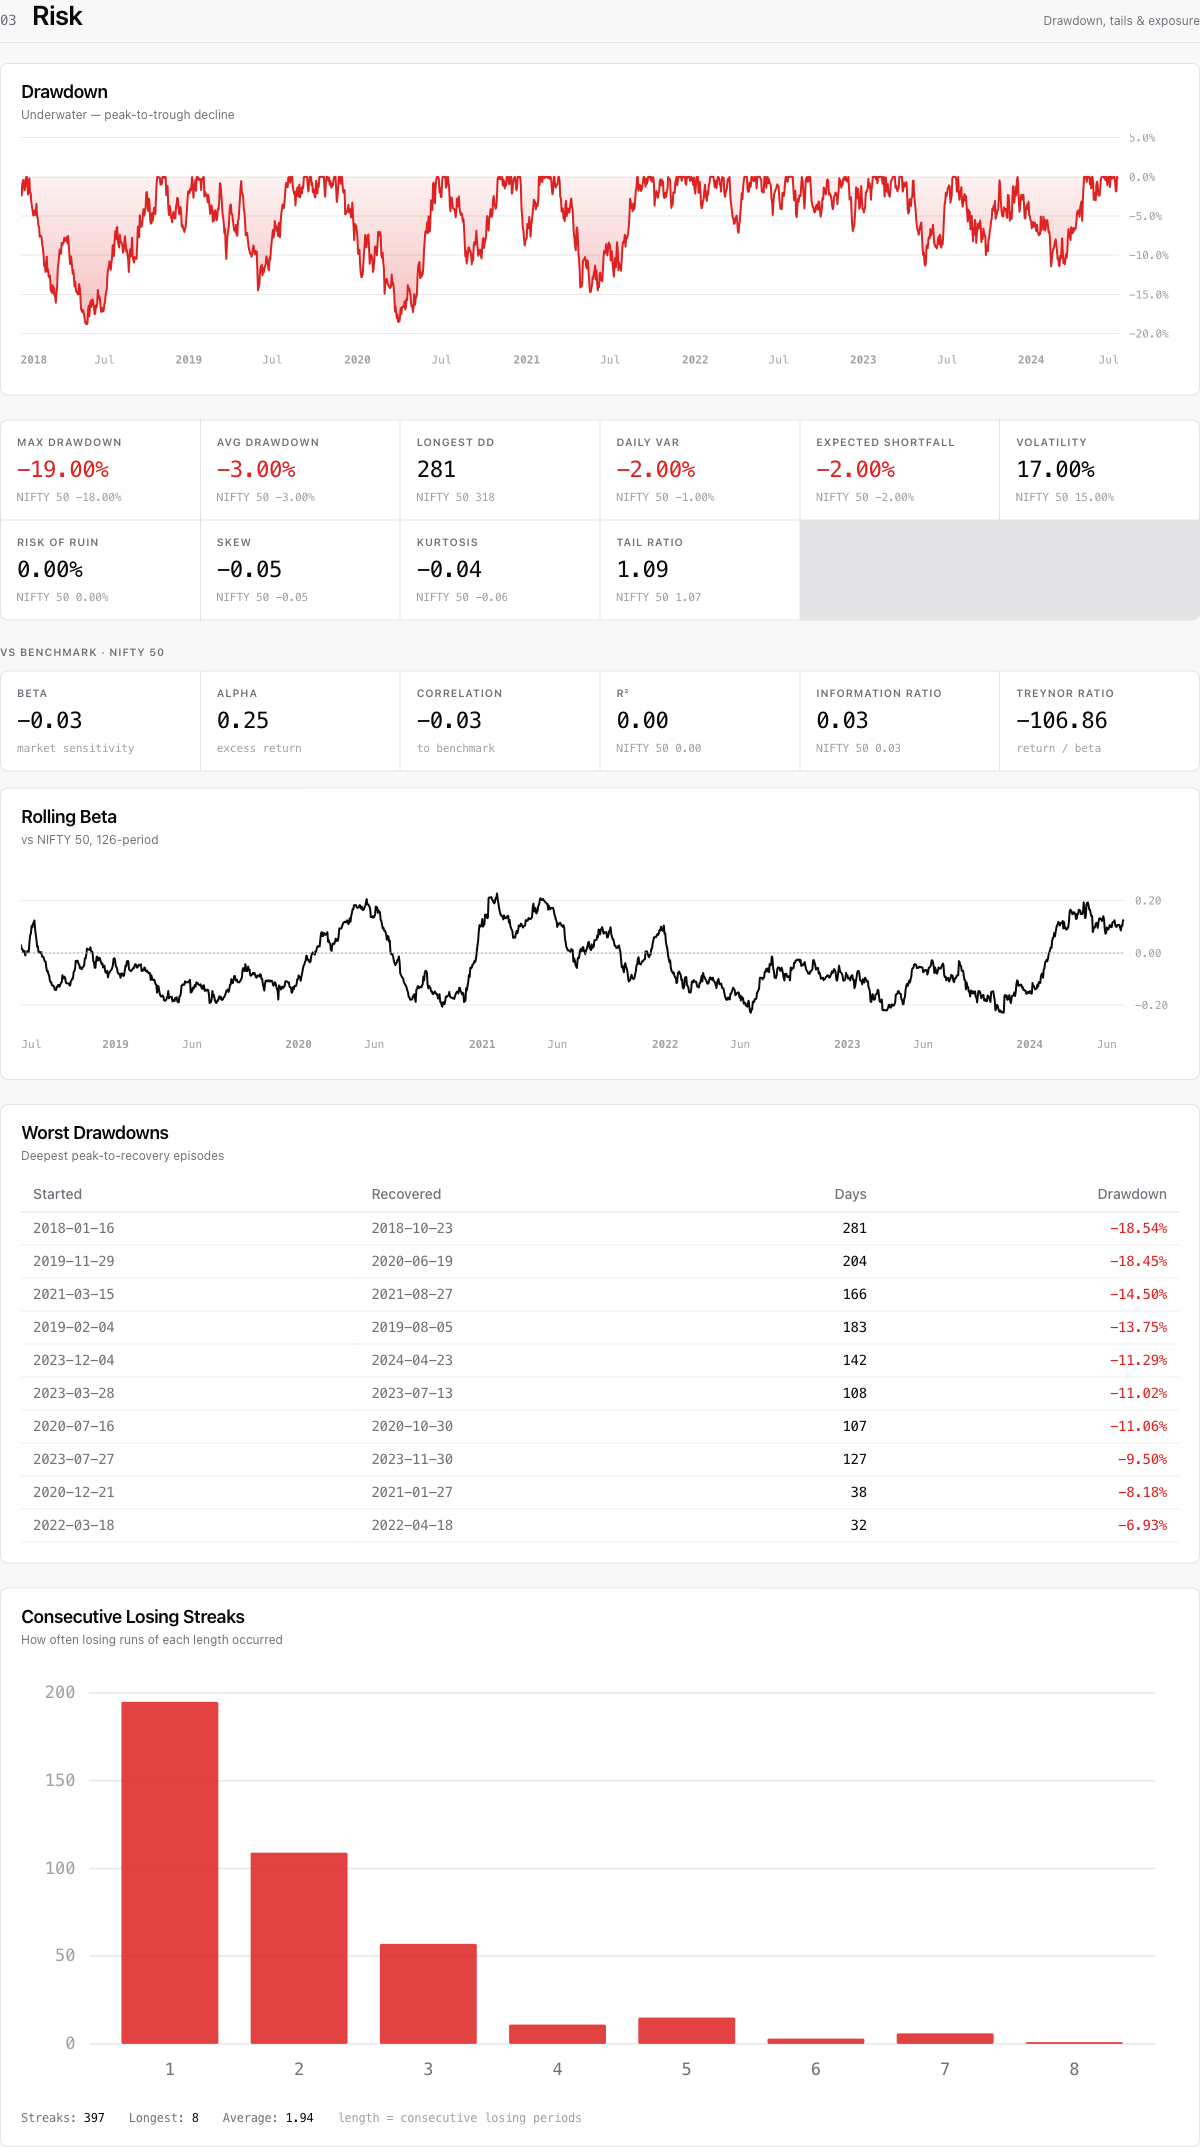
Risk — underwater drawdown curve, tail and exposure metrics, the worst drawdown episodes, and the distribution of consecutive losing streaks:
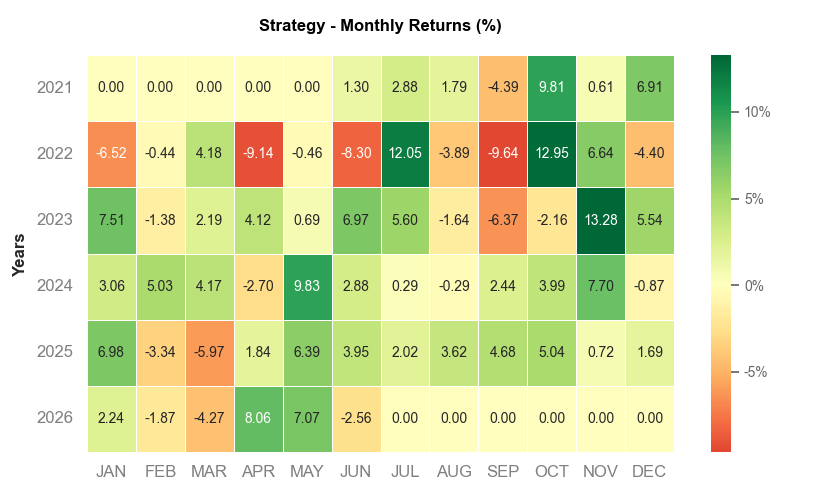
Seasonality — monthly and weekly return heatmaps and end-of-year returns vs the benchmark:
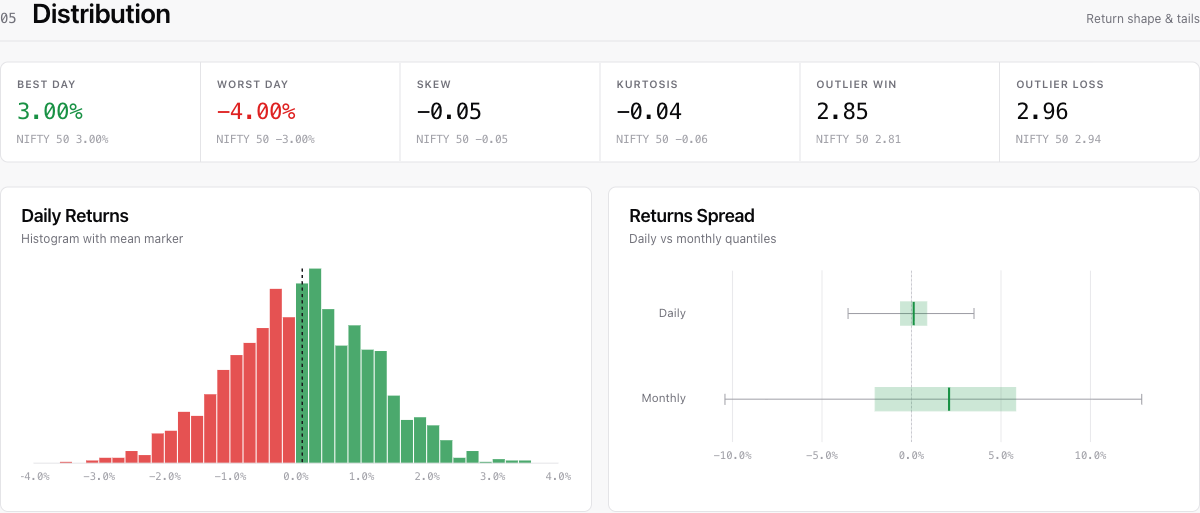
Distribution — return histogram with a mean marker, and a daily-vs-monthly spread box plot:
Install
pip install openstatz          # the library
pip install "openstatz[app]"   # also installs the web app and API
Use it in Python
It works like QuantStats. You only change the import.
import openstatz as os

returns = my_backtest.returns                 # a pandas Series of daily returns
benchmark = os.utils.download_returns("SPY")

os.reports.html(returns, benchmark=benchmark, output="tearsheet.html")
os.reports.metrics(returns, mode="full", display=True)

os.extend_pandas()
returns.sharpe()
The qs alias also works. Note that the os alias hides Python's built-in os inside files that
use it, so write import os as _os if you need both.
Two ways to make a tearsheet
Both work on a plain pip install openstatz, with no [app] extra, no server, and no Node.js.
Modern tearsheet. The same dashboard as openstatz serve, written to a single self-contained
HTML file with the analysis baked in (charts, heatmaps, metrics, light and dark themes, PDF export):
import openstatz as os

os.dashboard(returns, benchmark=benchmark, output="report.html")
The file embeds the data and inlines the JS/CSS, so you can email it or commit it and it just opens.
Classic tearsheet. The original QuantStats-style report (matplotlib charts in a static HTML template). Use this when you want the familiar QuantStats look or exact upstream parity:
import openstatz as os

os.reports.html(returns, benchmark=benchmark, output="tearsheet.html")
os.reports.metrics(returns, mode="full", display=True)
Examples for traders
US market (a stock vs the market).
import openstatz as os

aapl = os.utils.download_returns("AAPL")     # or NVDA, MSFT, TSLA, ...
spy  = os.utils.download_returns("SPY")

os.dashboard(aapl, benchmark=spy, output="aapl.html")      # modern tearsheet
os.reports.html(aapl, benchmark=spy, output="aapl_classic.html")   # classic tearsheet
Indian market (a stock vs the Nifty 50).
import openstatz as os

reliance = os.utils.download_returns("RELIANCE.NS")   # NSE tickers end in .NS
nifty    = os.utils.download_returns("^NSEI")          # Nifty 50 index

os.dashboard(reliance, benchmark=nifty, output="reliance.html")
Your own backtest strategy. Feed a pandas Series of daily returns straight from your backtest.
import openstatz as os

returns = my_backtest.returns          # pd.Series of daily returns
bench   = os.utils.download_returns("SPY")

os.dashboard(returns, benchmark=bench, output="strategy.html")
os.reports.metrics(returns, benchmark=bench, mode="full", display=True)
CSV works too: a date, return file (with an optional third benchmark column). Load it with
pandas and pass the Series, or drop it into the web app (see below).
Compare strategies
See which of several strategies is better, at a glance. Start the server and open the Compare tab, or call the API. Best value per metric is green, worst is red, and the leader wins the most key metrics.
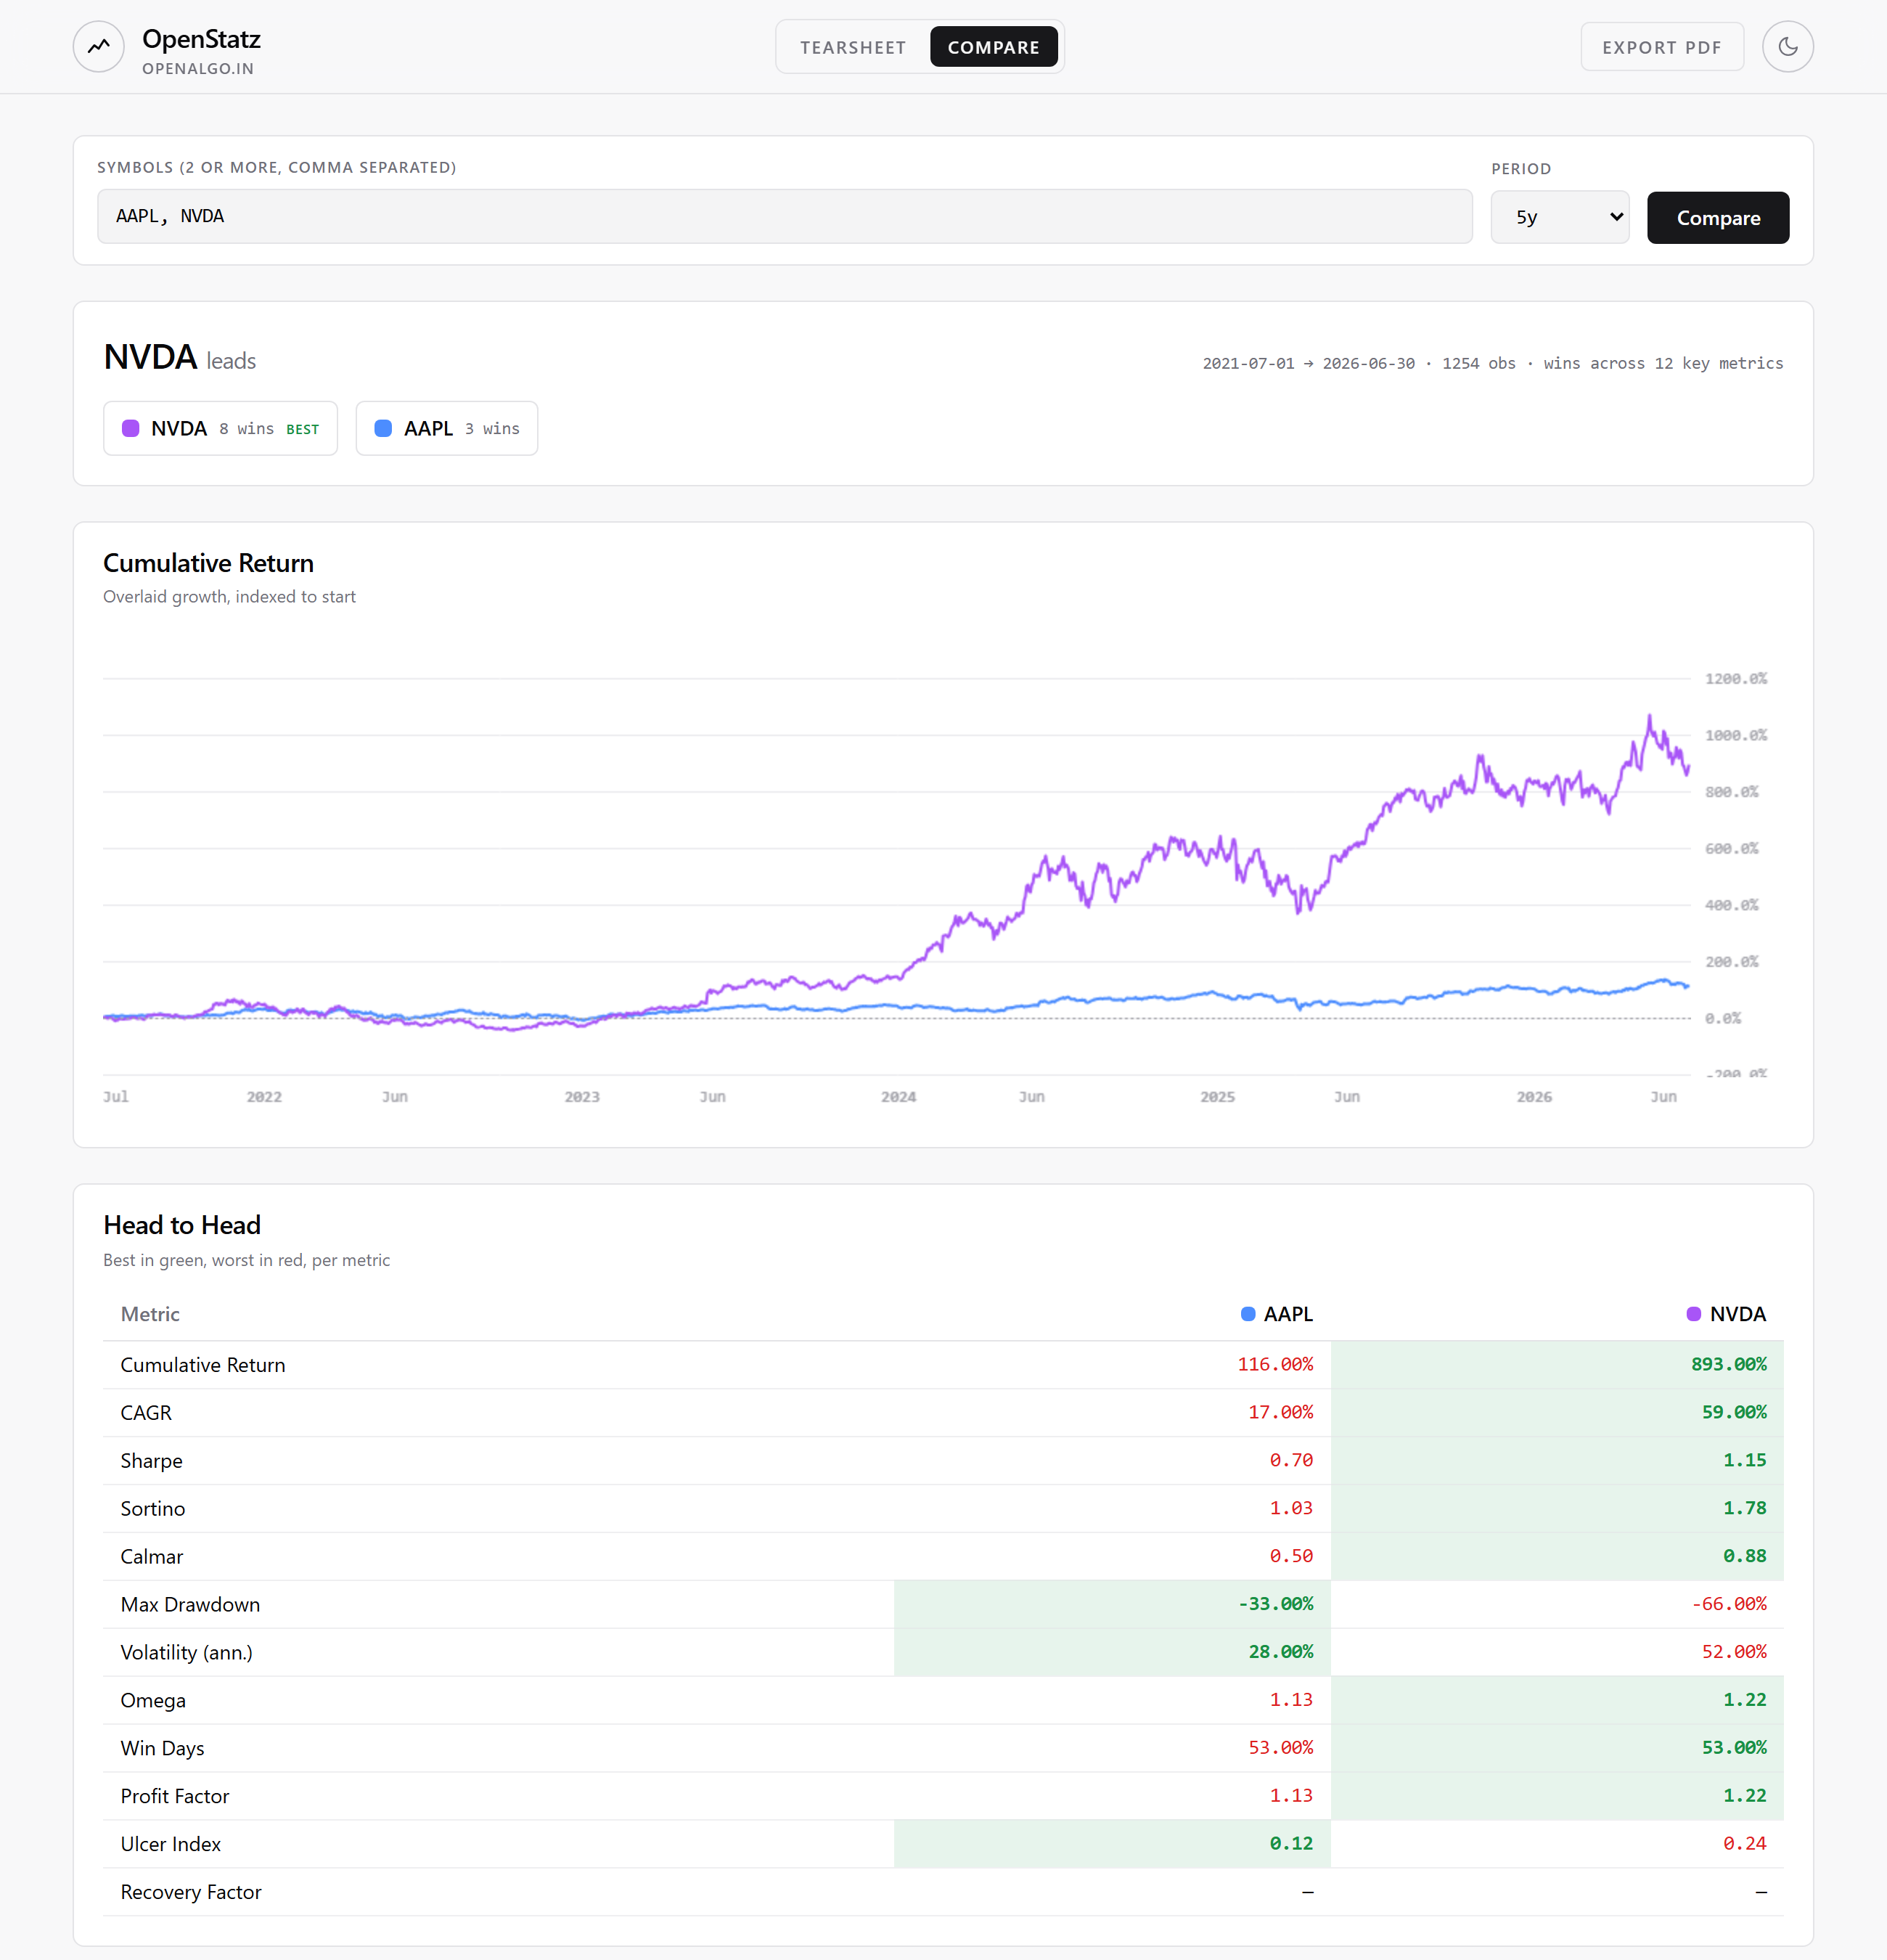
openstatz serve # then click "Compare" and enter, e.g., AAPL, NVDA
# Or the API, for tickers or your own strategies:
curl -X POST http://127.0.0.1:8000/api/compare/symbols \
  -H "Content-Type: application/json" \
  -d '{"symbols": ["AAPL", "NVDA", "MSFT"], "period": "5y"}'
Open the web tearsheet (live server)
pip install "openstatz[app]"
openstatz serve        # opens the API and UI at http://127.0.0.1:8000
To run on a different port:
openstatz serve --port 8200            # http://127.0.0.1:8200

# or without installing the command:
python -m openstatz serve --port 8200
In the browser you can:
- Type a ticker and a benchmark, for example RELIANCE.NS and ^NSEI.
- Or upload a CSV of your own returns. Columns: date, return, and an optional benchmark. See docs/example_returns.csv for the format.
The page shows the cumulative return, drawdown, monthly and weekly heatmaps, yearly returns, the return distribution, and a full table of metrics. It has light and dark themes and a PDF export.
Send a backtest with the API
curl -X POST http://127.0.0.1:8000/api/analyze \
  -H "Content-Type: application/json" \
  -d '{"dates": ["2024-01-02", "..."], "returns": {"Strategy": [0.001, "..."]}}'
Endpoints:
GET /api/healthPOST /api/analyzefor your own returnsPOST /api/analyze/symbolfor a ticker the server fetches for youPOST /api/compare/symbolsandPOST /api/compareto compare several strategies
The same numbers as QuantStats
OpenStatz reuses the QuantStats math without changes, so the results are the same. A test suite checks this on every change. It runs the real QuantStats and OpenStatz side by side and fails if any number, table, or chart differs (to within 1e-9). It has been verified to match exactly, even on live market data.
python tests/parity/generate_fixtures.py   # build the reference output from QuantStats
pytest tests/parity -q                       # run the check
Data sources
openstatz.providers fetches returns for a symbol. yfinance is the default. OpenAlgo is an optional
source for users on that platform.
Run old QuantStats code unchanged
import openstatz.compat
openstatz.compat.install_quantstats_shim()

import quantstats as qs        # this is now OpenStatz
Project layout
openstatz/         the library (drop-in for quantstats)
  app/             optional FastAPI server and JSON serializers
  app/static/      the built web UI, shipped inside the package
app/               web UI source (React, Vite, Tailwind)
tests/parity/      the check against QuantStats
Build the web UI (for contributors)
The shipped app is pre-built, so users need no Node.js. To rebuild it from source:
cd app && npm ci && npm run build
cp -r dist/* ../openstatz/app/static/
License
Apache 2.0. See LICENSE.txt and NOTICE.
OpenStatz is built on QuantStats (Copyright 2019 to 2025, Ran Aroussi, Apache 2.0). The portfolio math is reused without changes. Thanks to Ran Aroussi and the QuantStats contributors.
1 maintainer

Release files for openstatz 0.4.1
For a detailed explanation of source distributions (sdists) and built distributions (wheels), please see the package formats documentation.
Source distribution (sdist)
| File | Size | Uploaded | |
|---|---|---|---|
| openstatz-0.4.1.tar.gz | 739.9 kB | Details |
Built distribution (wheel)
| File | Interpreter | ABI | Platform | Reset |
|---|---|---|---|---|
| openstatz-0.4.1-py3-none-any.whl | Python 3 | none | any | Details |
Total release size: 1.5 MB
Release files / openstatz-0.4.1.tar.gz
| Download URL | openstatz-0.4.1.tar.gz |
|---|---|
| Size | 739.9 kB |
| Tags | Source |
|
SHA-256 checksum How to use checksums |
92e93996d53dc88d7e9f7a71054b1c2ee891f86a27148a79b3307721083aab14
|
|
BLAKE2b-256 checksum How to use checksums |
5bc124005f46ab2f9a2667c53e293e20534d09712b4af174810206ab3f0c1943
|
| Upload date | |
|
Uploaded using Trusted Publishing? What is trusted publishing? |
No |
| Uploaded via |
twine/6.2.0 CPython/3.13.0
|
Release files / openstatz-0.4.1-py3-none-any.whl
| Download URL | openstatz-0.4.1-py3-none-any.whl |
|---|---|
| Size | 753.5 kB |
| Tags | Python 3 |
|
SHA-256 checksum How to use checksums |
e7217dcb4c5b3e4af3d71fb6e0e9be6539a447c07a58a6d19f873da2d45b15a5
|
|
BLAKE2b-256 checksum How to use checksums |
072d28f1c204d35838b2060a011f4e641db40487fcac56a8e71a310628d4642e
|
| Upload date | |
|
Uploaded using Trusted Publishing? What is trusted publishing? |
No |
| Uploaded via |
twine/6.2.0 CPython/3.13.0
|














