
Overfitting (Futures Backtesting)

Overfitting simulates a realistic crypto futures trading environment including
- Liquidation, Margin, Leverage for stress testing
- Multiple Currency Trading (e.g., backtesting BTC PERP & ETH PERP at the same time)
- Four Different Order Types: LIMIT, MARKET, STOP_LIMIT, STOP_MARKET
- Slippage/Commission Setting
Installation
$ pip install overfitting
Usage
Run from the repository root; the example reads the sample data in examples/data/.
import pandas as pd
from overfitting import Strategy
from overfitting.indicators import sma, crossover, crossunder

def load_data():
    df = pd.read_csv('examples/data/BTCUSDT.csv')
    benchamrk_df = pd.read_csv('examples/data/BTCUSDT.csv') # BTC buy and Hold
    df['timestamp'] = pd.to_datetime(df['timestamp'], unit='ms')
    df.set_index('timestamp', inplace=True)

    start_time = pd.to_datetime('2023-01-01 00:00:00')
    df = df.loc[start_time:]

    return df, benchamrk_df

class MyStrategy(Strategy):
    def init(self):
        self.asset = 'BTC'
        self.set_leverage(self.asset, 1)

        close = self.data[self.asset].close
        self.fast = self.I(sma, close, 20)
        self.slow = self.I(sma, close, 50)

    def next(self):
        position = self.get_position(self.asset)

        # Golden cross (entry)
        if crossover(self.fast, self.slow) and position.qty == 0:
            price = self.price(self.asset)
            lot_size = self.get_balance() // price
            self.limit_order(self.asset, lot_size, price)

        # Death cross (exit)
        elif crossunder(self.fast, self.slow) and position.qty > 0:
            self.market_order(self.asset, -position.qty)

price_df, benchmark_data = load_data()
strategy = MyStrategy(
    data={"BTC": price_df},
    benchmark=benchmark_data, # Default = None Optional
    initial_capital=100_000, # Default Optional
    commission_rate=0.0002, # Default Optional
    maint_margin_rate=0.005, # Default Optional
    maint_amount=50  # Default Optional
)
returns = strategy.run()
strategy.plot(returns)
Results
Performance Summary
Overview
Start Date 2023-01-01 00:00
End Date 2024-08-29 00:00
Number of Years 1.663
Initial Balance 100,000.00
Final Balance 205,328.91
Total Return 105.33%
CAGR 54.13%
Returns
Annualized Mean Return 48.64%
Best Day 10.08%
Worst Day -5.38%
Best Month 27.88%
Worst Month -13.71%
Positive Days 34.93%
Positive Months 70.00%
Average Up Day 1.59%
Average Down Day -0.95%
Longest Winning Streak (days) 7
Longest Losing Streak (days) 7
Risk
Volatility (annualized) 33.08%
Downside Deviation (annualized) 17.38%
Sharpe Ratio 1.470
Sortino Ratio 2.799
Calmar Ratio 2.040
Omega Ratio 1.316
Gain to Pain Ratio 0.316
Tail Ratio 1.569
Common Sense Ratio 2.064
Daily Value at Risk (95%) -2.19%
Daily Value at Risk (99%) -3.74%
Daily Expected Shortfall (95%) -3.16%
Daily Expected Shortfall (99%) -4.17%
Skew (daily) 1.804
Excess Kurtosis (daily) 7.538
Autocorrelation (1 day) 0.075
Kelly Fraction 4.445
Drawdown
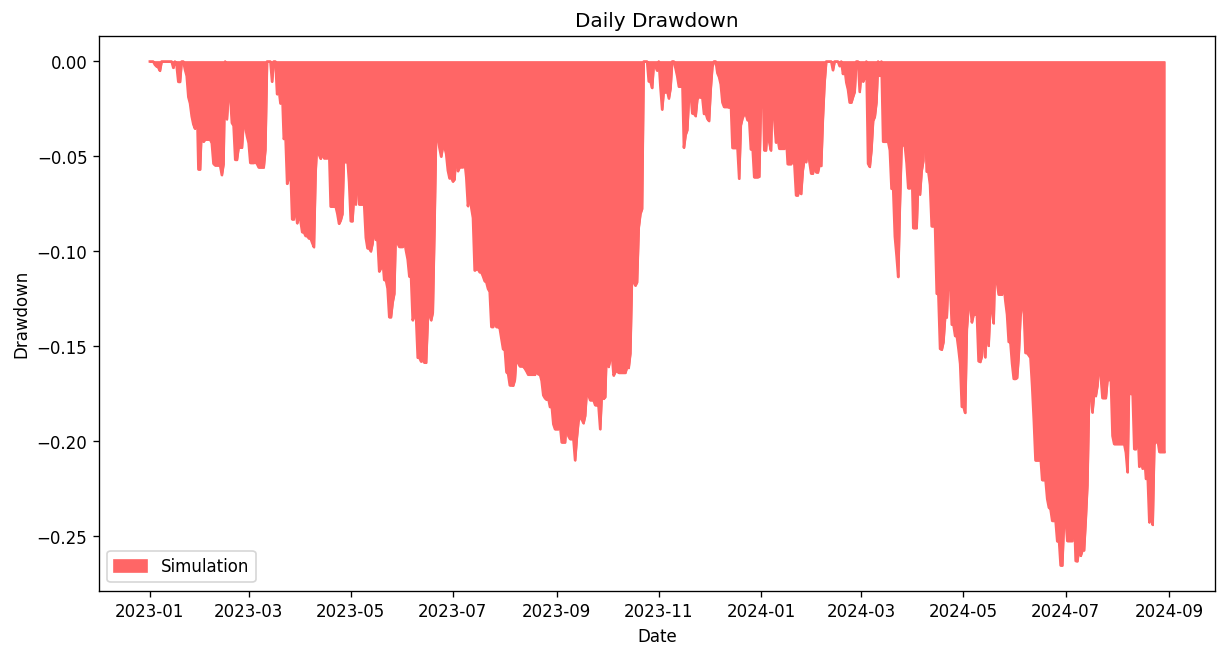
Max Drawdown -26.53%
Current Drawdown -20.56%
Average Drawdown -4.91%
Longest Drawdown (days) 219
Average Drawdown Duration (days) 31.500
Average Recovery Time (days) 6.765
Time Underwater 93.41%
Ulcer Index 12.12%
Pain Index 9.74%
Recovery Factor 3.970
Martin Ratio 4.465
Drawdowns Deeper Than 5% 6
Drawdowns Deeper Than 10% 2
Drawdowns Deeper Than 20% 2
Sharpe Ratio Reliability
Sharpe Standard Error 0.726
Sharpe 95% Range (low) 0.047
Sharpe 95% Range (high) 2.894
Probability Sharpe Above 0 97.86%
Days Needed To Confirm Sharpe 401
Benchmark
Alpha (annualized) 3.44%
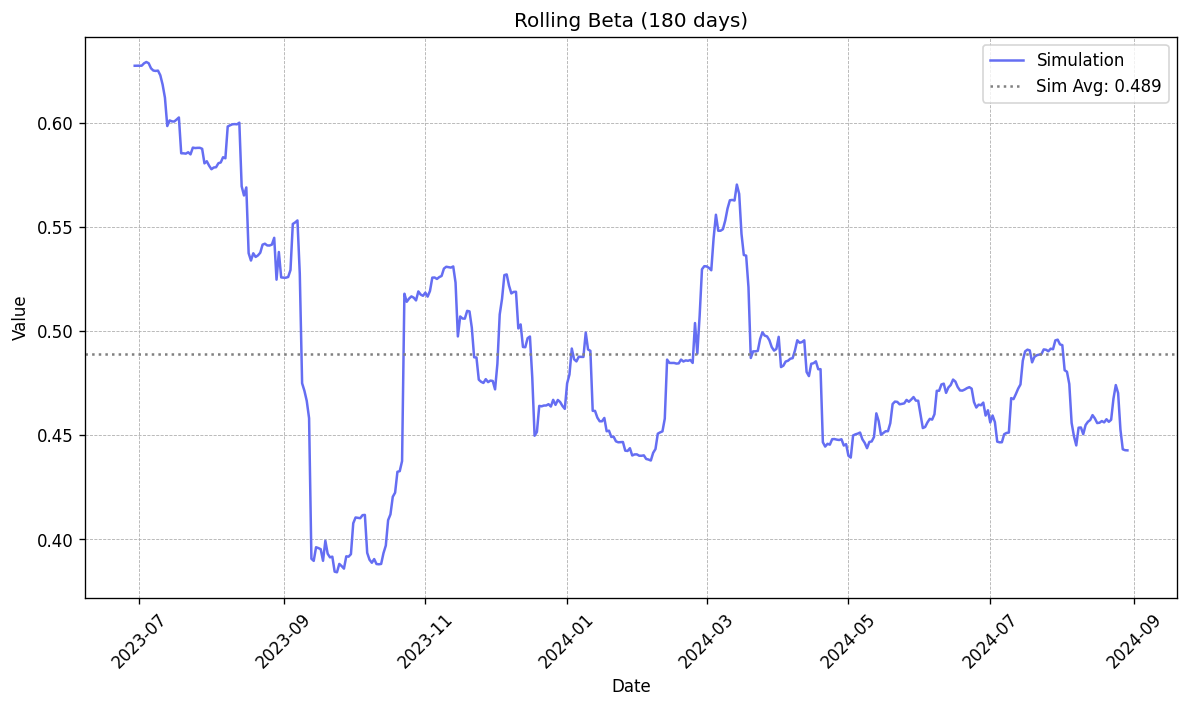
Beta 0.509
Correlation 0.758
R-Squared 0.574
Tracking Error (annualized) 32.39%
Information Ratio -1.238
Excess Return (annualized) -61.21%
Up Capture 0.493
Down Capture 0.479
Days Beating Benchmark 43.00%
Trades
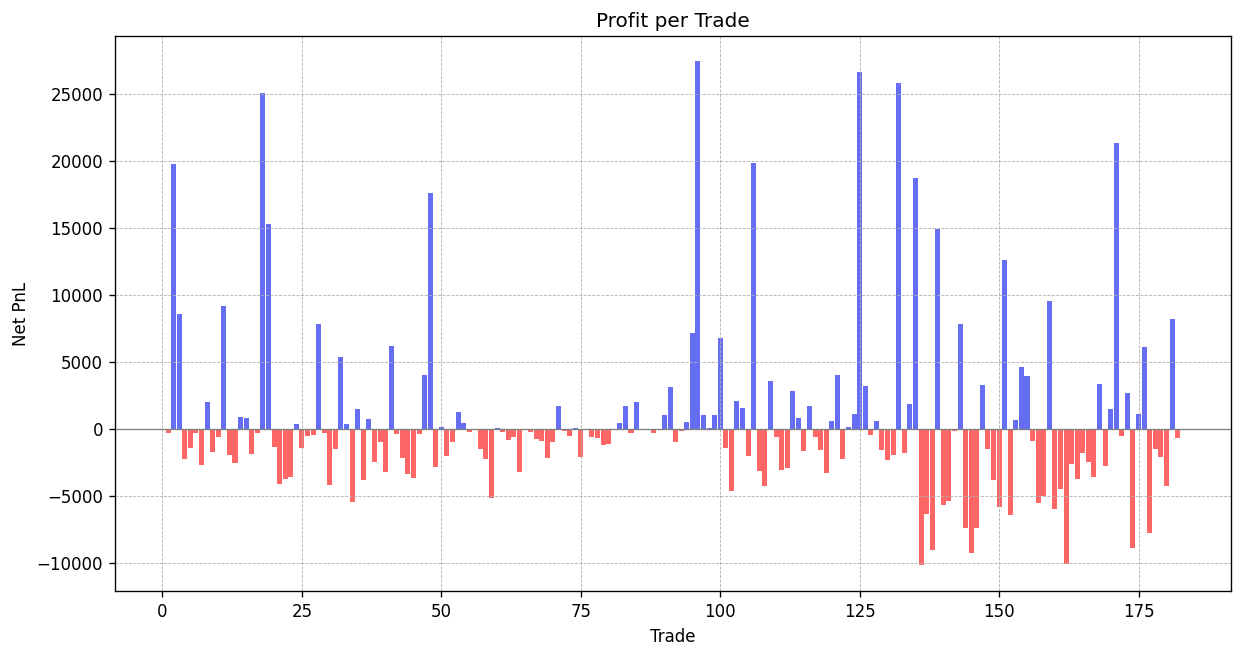
Total Trades 182
Long Trades 182
Short Trades 0
Win Rate 37.36%
Win Rate (long) 37.36%
Win Rate (short) n/a
Average Win 5,837.17
Average Loss -2,557.89
Largest Win 27,402.74
Largest Loss -10,211.93
Payoff Ratio 2.282
Profit Factor 1.361
Expectancy per Trade 578.73
Average Trade Return 0.52%
Average Winning Return 3.94%
Average Losing Return -1.52%
Expectancy (R) 0.226
System Quality Number 1.220
Average Holding Time (bars) 43.352
Median Holding Time (bars) 33.000
Longest Holding Time (bars) 282
Average Holding Time, Winners (bars) 73.294
Average Holding Time, Losers (bars) 25.491
Longest Winning Streak (trades) 7
Longest Losing Streak (trades) 8
Trades per Month 9.233
Profit From Best Trade 26.02%
Profit From Best 5 Trades 119.77%
Net Profit Without Best 5 Trades -20,822.32
Gross Profit 396,927.83
Gross Loss -291,598.92
Net Profit 105,328.91
Trade Quality
Average Adverse Excursion -1.85%
Average Favourable Excursion 3.08%
Edge Ratio 1.665
Profit Captured 18.08%
Average Profit Given Back 2.52%
Liquidations 0
Costs
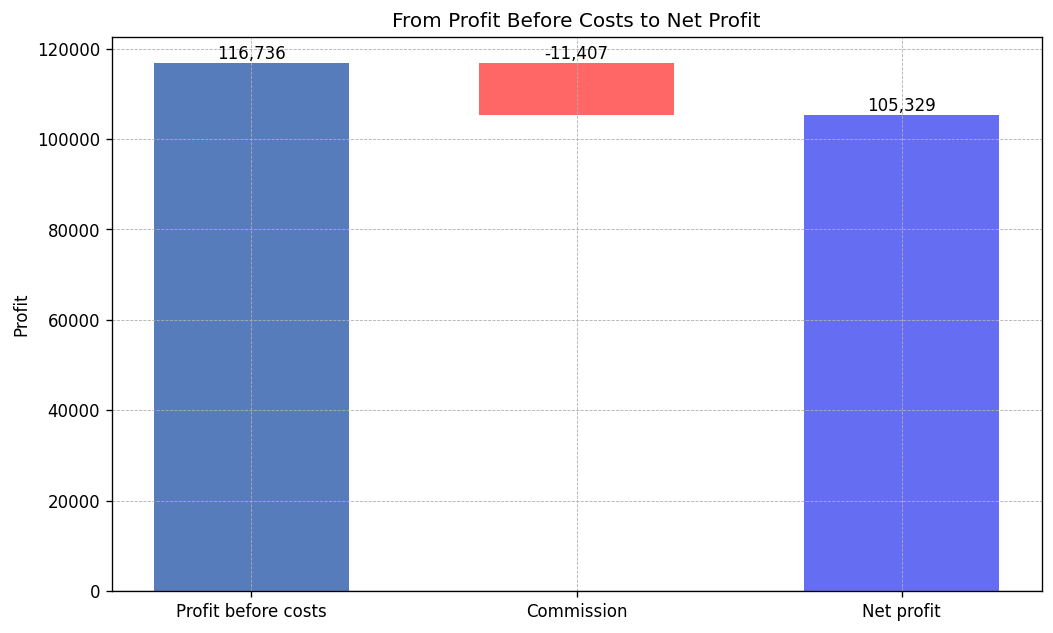
Total Commission 11,407.29
Total Slippage 0.00
Funding Paid 0.00
Funding Received 0.00
Total Costs 11,407.29
Profit Before Costs 116,736.20
Costs as Share of Profit Before Costs 9.77%
Average Cost per Fill 31.34
Break-Even Commission Multiple 10.233
Traded Value 57,036,444.00
Turnover (times equity per year) 196.244
Exposure and Margin
Time in Market 54.25%
Average Leverage 0.491
Average Leverage in Market 0.906
Maximum Leverage 0.991
Average Net Exposure 49.14%
Average Margin Usage 48.02%
Peak Margin Usage 102.54%
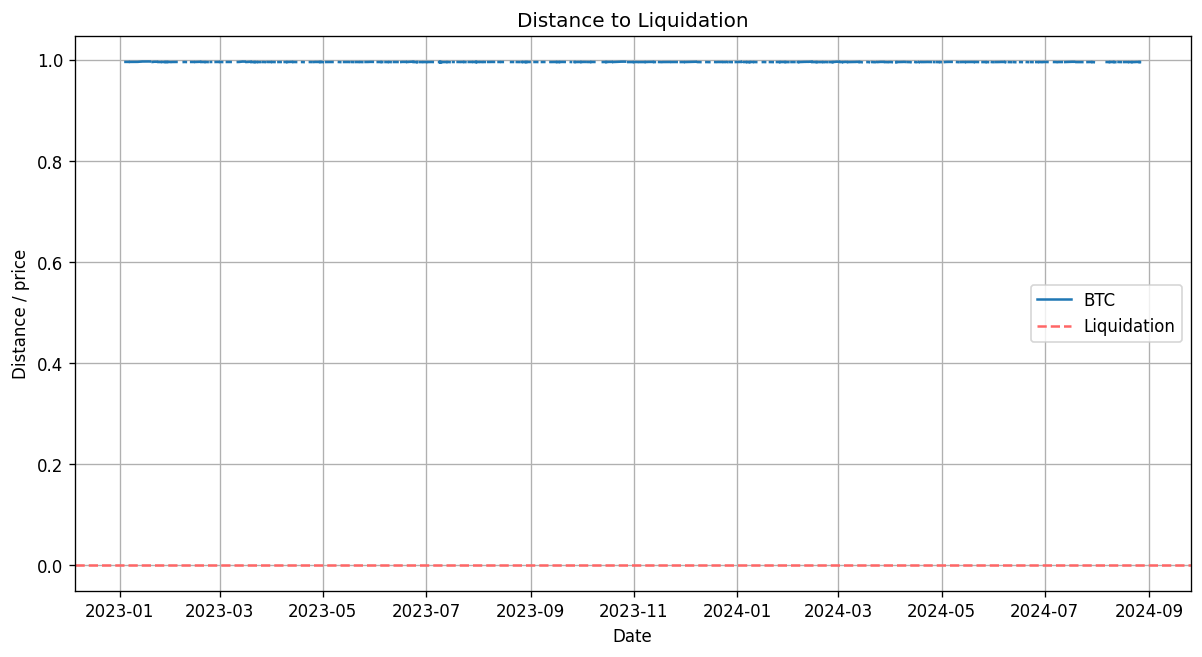
Closest Distance to Liquidation 99.50%
Average Distance to Liquidation 99.54%
Liquidation Loss 0.00
Orders
Orders Placed 364
Orders Filled 364
Orders Cancelled 0
Orders Rejected 0
Orders Still Open 0
Fill Rate 100.00%
Average Slippage per Fill 0.00%
By Symbol
Trades Win rate Net PnL Average PnL Profit factor Share of profit Time held
Symbol
BTC 182 37.4% 105,328.91 578.73 1.36 100.0% 54.2%
Worst Drawdowns
Net drawdown in % Peak date Valley date Recovery date Duration (days)
0 26.533797 2024-03-13 2024-06-28 NaT 169
1 20.996185 2023-03-17 2023-09-12 2023-10-23 219
2 7.051091 2023-12-05 2024-01-22 2024-02-09 65
3 5.980692 2023-01-21 2023-02-13 2023-02-15 24
4 5.578214 2023-02-15 2023-03-07 2023-03-12 24
5 5.550106 2024-03-04 2024-03-06 2024-03-11 6
6 4.538401 2023-11-10 2023-11-16 2023-12-04 23
7 2.530832 2023-11-01 2023-11-03 2023-11-09 7
8 2.162228 2024-02-18 2024-02-23 2024-02-27 8
9 1.603446 2024-02-28 2024-02-29 2024-03-04 4
Indicators
An indicator is a plain function that takes price series and returns one value per bar. Declare it in init() with self.I, then read it in next() relative to the current bar:
from overfitting.indicators import sma, rsi, bollinger, crossover

def init(self):
    bars = self.data["BTC"]
    self.fast = self.I(sma, bars.close, 20)
    self.rsi = self.I(rsi, bars.close, 14)
    self.bands = self.I(bollinger, bars.close, 20, 2)    # several outputs

def next(self):
    self.fast[-1]            # value at the last completed bar
    self.fast[-2]            # the bar before
    self.bands.upper[-1]     # one output of a multi-output indicator
    crossover(self.rsi, 30)  # True when RSI just moved above 30
- Inside
next(), an indicator only shows bars that have finished. The bar being traded and later bars cannot be read, so there is no look-ahead to guard against. - Before there is enough history the value is
NaN, andcrossover/crossunderreturnFalse. self.price("BTC")is the open of the current bar, the price a market order placed now fills at.- Built in:
sma,ema,wma,rsi,macd,stochastic,bollinger,atr,donchian. - A custom indicator is any function of the same shape; see
examples/donchian_breakout.py.
next(self, i) with the bar index is still supported. The class-based indicators (SMA, EMA, ...) and self.indicator(...) still work but are deprecated.
Slippage
MyStrategy(data, slippage=0.001)             # every fill is 0.1% worse than the order price

from overfitting.slippage import skewed
MyStrategy(data, slippage=skewed(0.15))      # slips 15% of the way from the open to the bar's extreme

MyStrategy(data, slippage=lambda order, bar: order.theoretical_price + 0.5)   # your own model
A slippage model is a function (order, bar) -> executed price. order.qty is positive for a buy, and bar has open, high, low and close. slippage_model= and Slippage.FixedPercent(f=...) still work but are deprecated.
Report and Charts
The summary has eleven sections: overview, returns, risk, drawdown, Sharpe ratio reliability, benchmark, trades, trade quality, costs, exposure and margin, and orders, followed by a per-symbol table and the worst drawdowns.
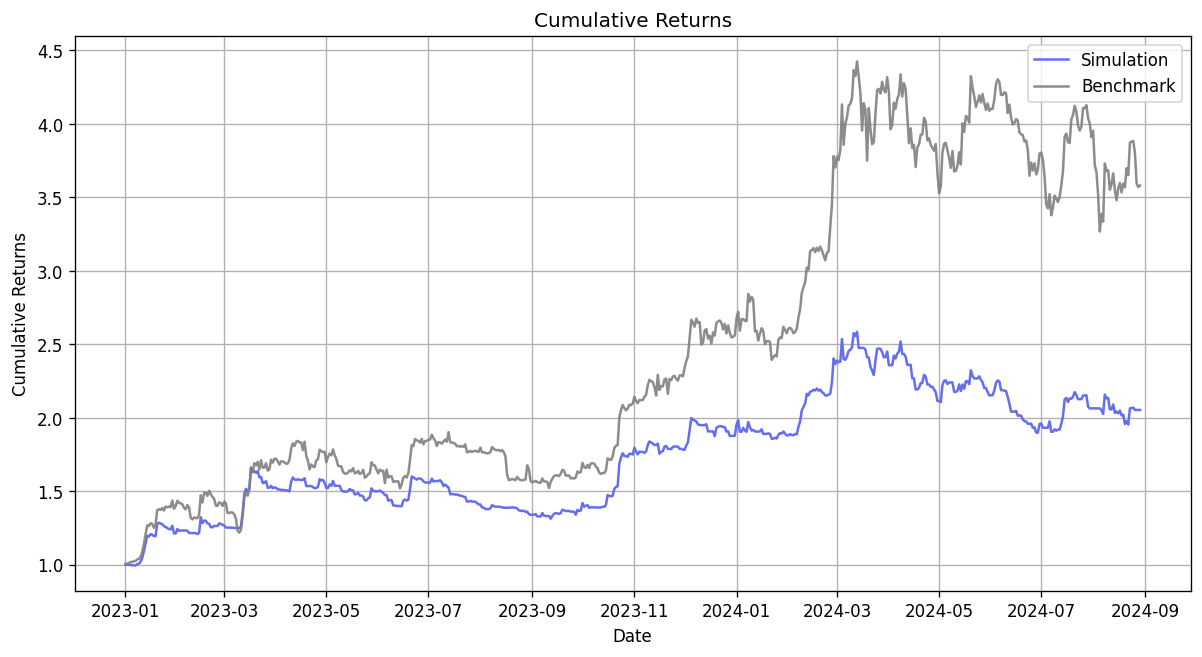
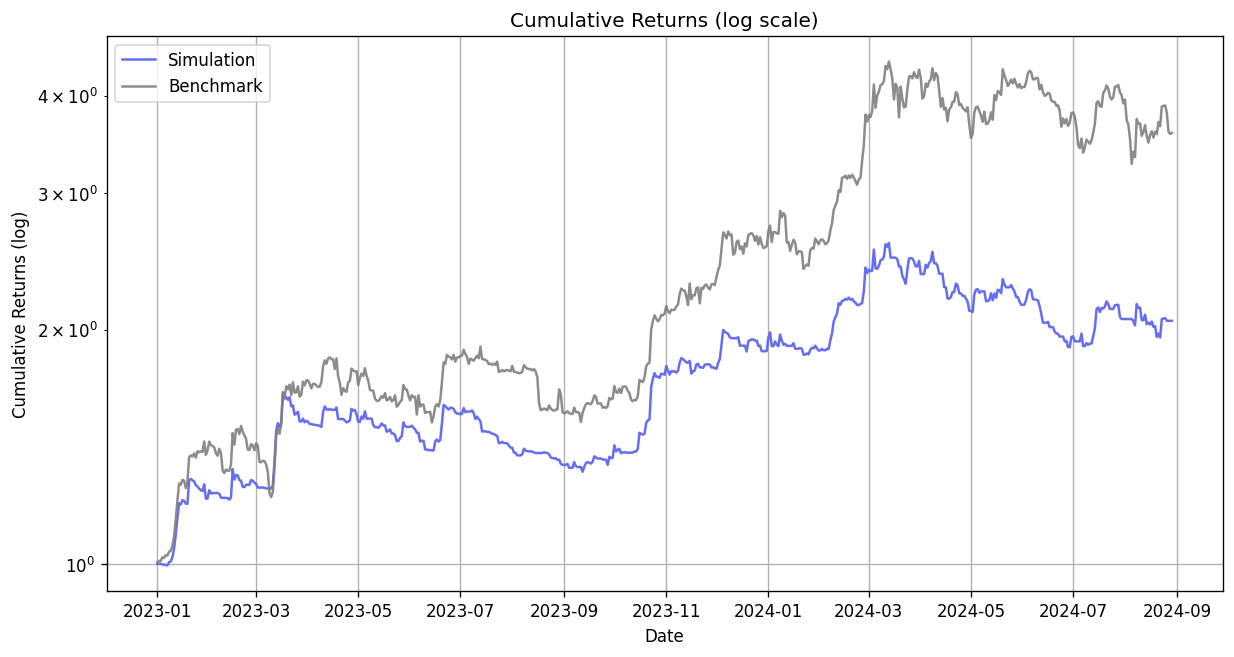
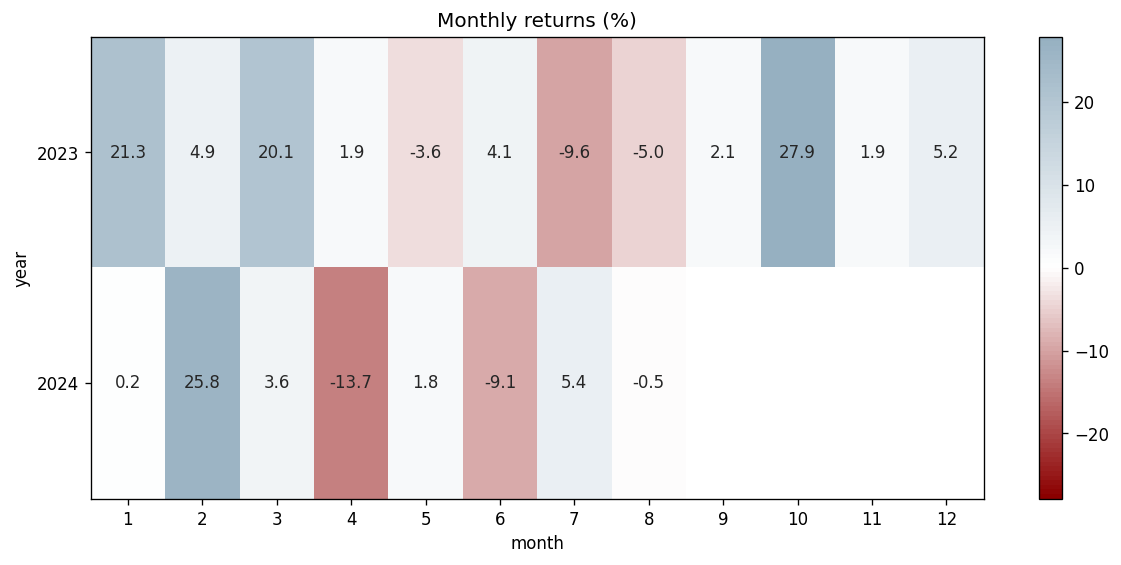
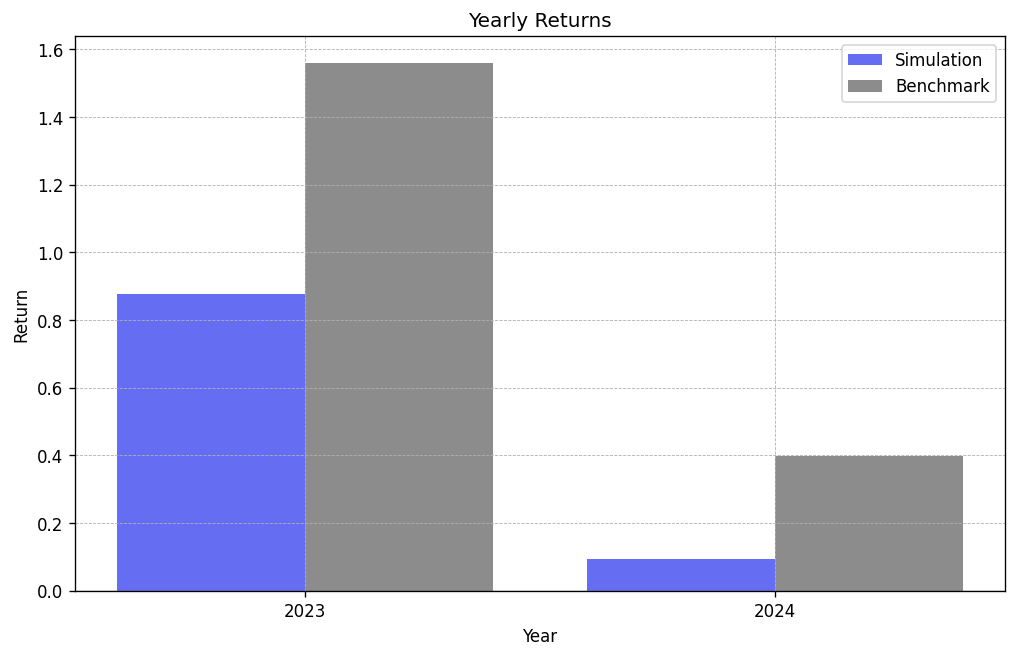
strategy.plot(returns) prints the summary above and shows 13 charts, one after another.
- In a Jupyter or VS Code notebook the charts appear inline.
- In a script each opens in a matplotlib window.
strategy.plot(returns)                         # print the summary and show the charts
strategy.plot(returns, save_path="results")    # also save each chart as a PNG in results/
strategy.plot(returns, title="SMA cross")      # name used on the charts
| Chart | Function in overfitting.analysis.plots |
Needs |
|---|---|---|
| Cumulative returns | cumulative_returns |
|
| Cumulative returns, log scale | cumulative_returns_log |
|
| Monthly returns heatmap | monthly_heatmap |
|
| Yearly returns | yearly_returns |
|
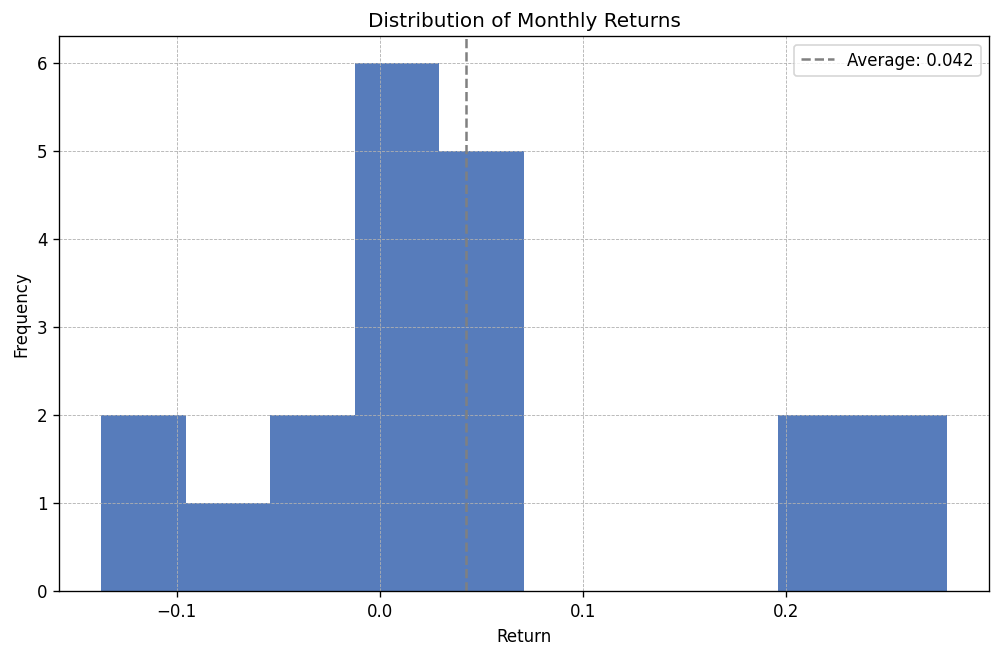
| Distribution of monthly returns | monthly_distribution |
|
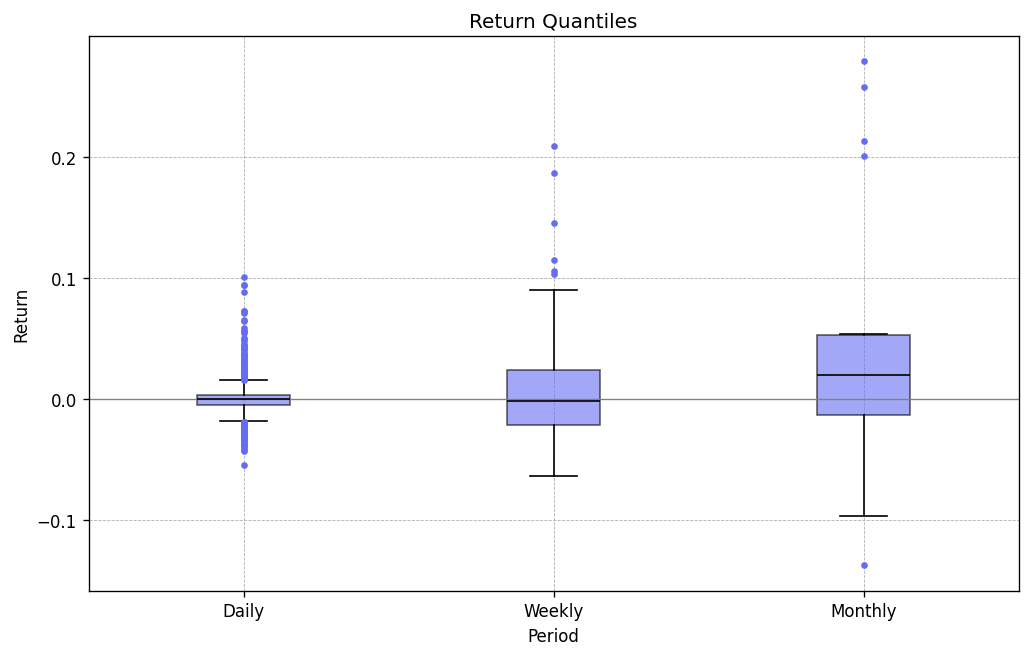
| Return quantiles (box plot of daily, weekly, monthly returns) | return_quantiles |
|
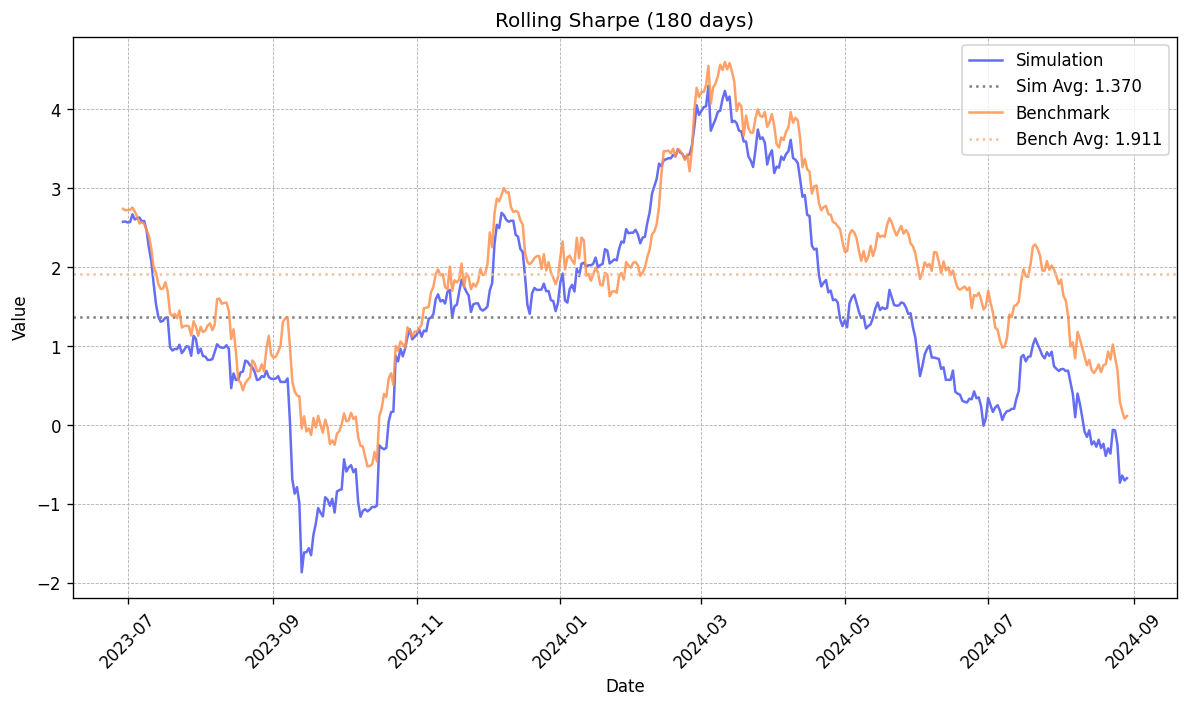
| Rolling Sharpe | rolling_sharpe |
|
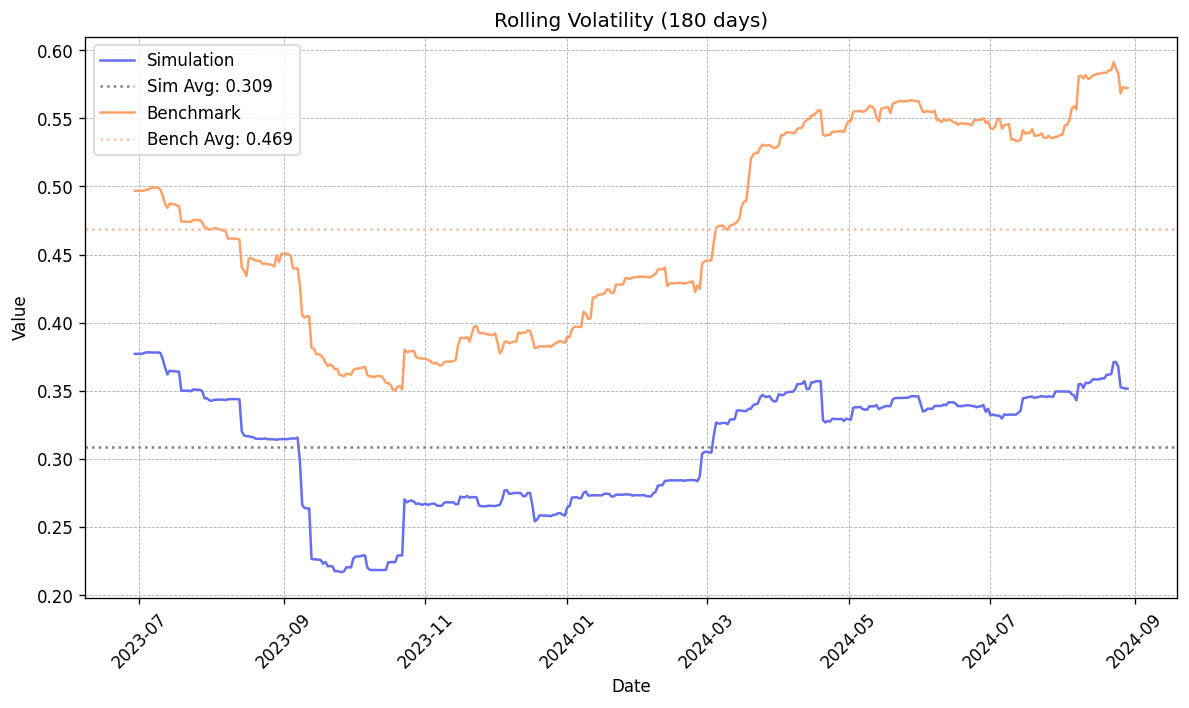
| Rolling volatility | rolling_volatility |
|
| Drawdown | drawdown |
|
| Rolling beta | rolling_beta |
a benchmark |
| Profit per trade | profit_per_trade |
|
| Cost breakdown | cost_breakdown |
|
| Distance to liquidation | liquidation_distance |
Rolling beta is skipped when no benchmark is given. Each chart is also available on its own, and every number behind them is in overfitting.analysis.metrics:
from overfitting.analysis import metrics, plots

daily = metrics.aggregate_returns(returns, "D")
plots.drawdown(daily).savefig("drawdown.png")
plots.profit_per_trade(strategy.fetch_round_trips())
metrics.summary(daily)       # 49 metrics as a pandas Series

metrics.trade_summary(strategy.fetch_round_trips())   # win rate, expectancy, streaks ...
metrics.by_symbol(strategy.fetch_round_trips())       # results per symbol
metrics.by_weekday(strategy.fetch_round_trips())      # results by entry weekday
The 13 charts, from the example above:
Trade and Account Data
After strategy.run(), everything that happened is available as pandas DataFrames:
strategy.fetch_round_trips()            # one row per completed trade
strategy.fetch_trades()                 # one row per fill
strategy.fetch_orders()                 # every order placed, with its status
strategy.fetch_account_history()        # the account on every bar
strategy.fetch_position_history("BTC")  # one symbol's position on every bar
strategy.fetch_funding()                # funding payments
- Round trips run from opening a position until it is flat again or flips sides. Each row has entry and exit time and price, holding time, gross PnL, commission, funding, net PnL, and
mae/mfe: how far the price moved against and in favour of the position while it was open, as a fraction of the entry price. - Orders carry a
statusofOPEN,FILLED,CANCELLEDorREJECTED, areject_reasonwhen rejected, and theslippagecost of each fill. - Account history has cash, equity, margin in use, gross and net exposure, and leverage.
- Position history has size, entry price, close, exposure, margin, liquidation price and unrealized PnL.
Liquidation Handling
The liquidation logic is based on isolated margin mode:
- Initial Margin = Entry Price × Quantity / Leverage
- Maintenance Margin = Entry Price × Quantity × Maintenance Margin Rate − Maintenance Amount
- Liquidation Price is then calculated based on whether the position is long or short.
- Long Position Liquidation Price => Entry Price - (Initial Margin - Maintenance Margin)
- Short Position Liquidation Price => Entry Price + (Initial Margin - Maintenance Margin)
When the price crosses the calculated liquidation level, the position is force-closed and the entire initial margin is lost. Nothing more is charged on top, so an isolated position can never lose more than the margin posted for it. Liquidations are marked in the trade log with is_liquidation_order = True.
Margin Check
An order that opens or increases a position needs price × quantity / leverage of free margin, where free margin is the cash balance minus the margin locked in open positions.
- If the account cannot afford the order when it is placed,
InsufficientMarginis raised. - If the account can no longer afford a resting order when it fills, the order is dropped and listed in
strategy.fetch_rejected_orders(). - Orders that reduce or close a position are always accepted.
Equity Curve
strategy.run() returns are based on equity: cash plus the unrealized PnL of open positions, marked at each bar's close. Drawdown and Sharpe therefore include losses on positions that are still open.
returns = strategy.run()                       # mark-to-market (default)
returns = strategy.run(mark_to_market=False)   # realized only: moves when trades close

strategy.equity_curve        # cash + unrealized PnL per bar
strategy.realized_balances   # cash per bar
Funding Rate
Add a funding_rate column to a symbol's DataFrame to simulate funding. A non-zero value on a bar means funding is settled at that bar's open, on the position held into it:
payment = -position quantity × open price × funding rate
Longs pay and shorts receive when the rate is positive. Bars with 0 or NaN settle nothing. Payments change the cash balance and are listed in strategy.fetch_funding().
Supported Order Types
Supports four order types: LIMIT, MARKET, STOP LIMIT, and STOP MARKET. Each behaves according to standard trading conventions.
[NOTE] Rules
- For MAKRET Orders, the system will automatically execute the trade with "open" price.
- For STOP Orders, the system will automatically trigger the order when:
- Long: Price (High) >= Stop Price
- Short: Price (Low) <= Stop Price
- Stop Order Immediate Rejection Rule: If a STOP LIMIT or STOP MARKET order would trigger immediately upon creation (because the current price already breaches the stop price), the system rejects the order with "STOP order would Immediately Trigger" message.
limit_order(symbol: str, qty: float, price: float)
market_order(symbol: str, qty: float)
stop_limit_order(symbol: str, qty: float, price: float, stop_price: float)
stop_market_order(symbol: str, qty: float, stop_price: float)
Multiple Currency Backtesting
You can simply test multiple currencies by passing data as dict[str, pd.DataFrame]. For examples, please refer to "multi_currency_sma_corss.ipynb" under "examples" folder.
Upcoming Features
- Parameter Optimizer
A simple optimizer to help find the best-performing strategy parameters (like SMA windows, thresholds, etc.) based on backtest results.
💡 Got feedback or suggestions? Feel free to open an issue or contribute via pull request.
1 maintainer

Metadata
1 maintainer
Release files for overfitting 0.5.0
For a detailed explanation of source distributions (sdists) and built distributions (wheels), please see the package formats documentation.
Built distribution (wheel)
| File | Interpreter | ABI | Platform | Actions Reset |
|---|---|---|---|---|
| overfitting-0.5.0-1-py3-none-any.whl | Python 3 | none | any | Details for overfitting-0.5.0-1-py3-none-any.whl |
Release files / overfitting-0.5.0-1-py3-none-any.whl
| Download URL | overfitting-0.5.0-1-py3-none-any.whl |
|---|---|
| Size | 55.5 kB |
| Tags | Python 3 |
|
SHA-256 checksum How to use checksums |
3403828de2ce1064620acb362ab3c69feeaa099f49f489b89e43a92374217d69
|
|
BLAKE2b-256 checksum How to use checksums |
ec9cb1fac7e79b0b828178be7cad7ea1810abd1e3c04e7e906f507caf5906678
|
| Upload date | |
|
Uploaded using Trusted Publishing? What is trusted publishing? |
No |
| Uploaded via |
twine/6.1.0 CPython/3.13.3
|
Security for overfitting 0.5.0
Provenance
Provenance describes where a file came from. On PyPI, provenance is shared via attestations, which provide a verifiable record of the build or publishing details. View details, limitations and caveats.
No provenance found
None of the files in this release were uploaded with provenance metadata.
A note on package security
PyPI is a repository for distributing packages, not a service for auditing them. While third-party security researchers and our staff do their best to detect and remove malicious packages, PyPI cannot guarantee the quality, security or suitability of any given package.
To learn more about protecting yourself from malicious actors, visit our package security documentation.














