
This release is a pre-release and may not be stable for production use.
ovos-tui-client
A split-pane terminal UI for talking to and debugging OpenVoiceOS without a microphone or speaker - type what you'd say, read what OVOS says back, and watch exactly what's happening on the message bus while it happens.
Actively maintained. The core experience is stable today and it's a solid, working replacement for the old CLI clients - see the comparison below. It'll keep picking up refinements and fixes, but you don't need to wait for a "1.0" to get real use out of it.



What it looks like
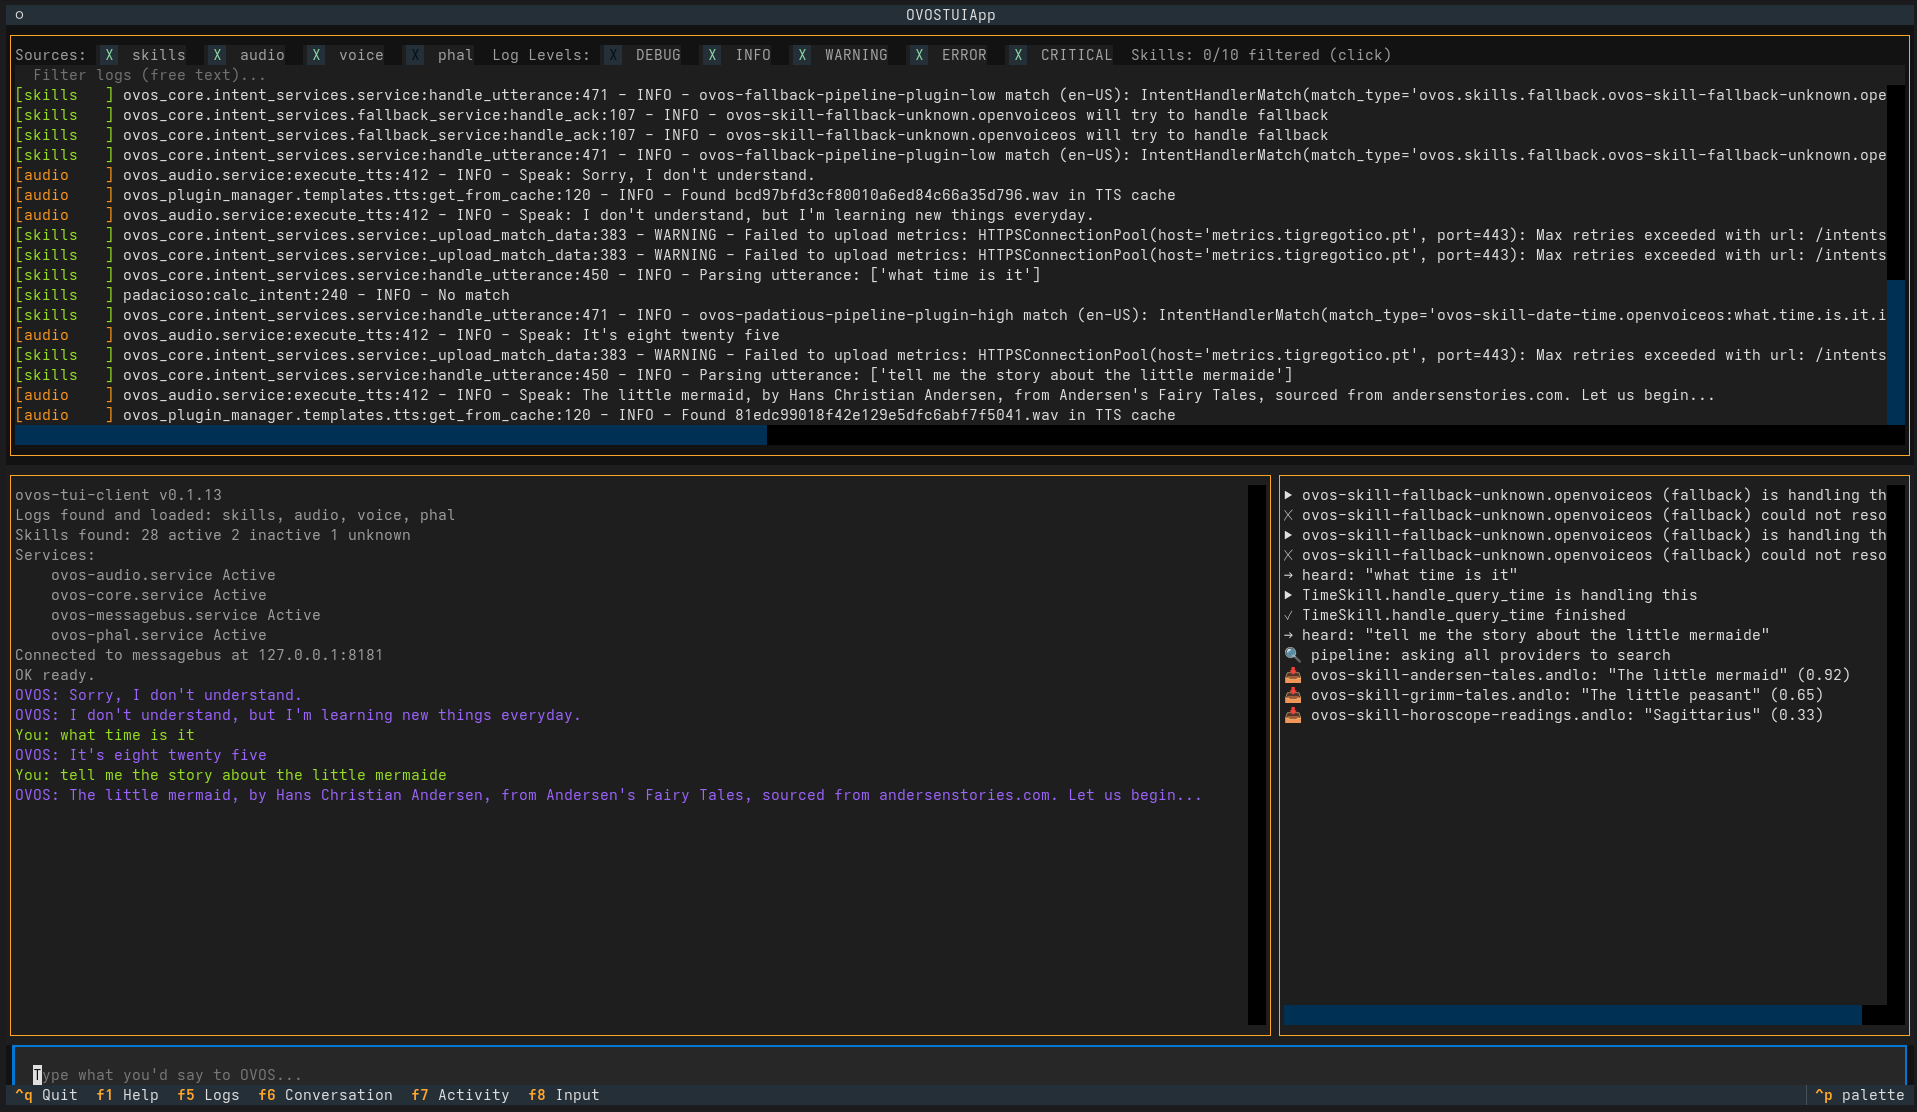
The four panes in text form, for anywhere images don't render (a
plain-text README viewer, pip show, etc):
┌────────────────────────────────────────────┐
│ Sources: [X]bus [X]skills [X]audio ...     │
│ Log Levels: [X]DEBUG [X]INFO ... Skills:.. │
│ Filter logs (free text)...                 │
│ LOGS                              scroll↕  │
├────────────────────────────┬───────────────┤
│ CONVERSATION (2/3)         │ ACTIVITY (1/3)│
│ You: read me a grimm story │ 🔍 pipeline:  │
│ OVOS: Here's Cinderella... │ asking all... │
│                            │ 📥 grimm-tale │
│                            │ s: "Cindere.. │
├────────────────────────────┴───────────────┤
│ > _                                        │
└────────────────────────────────────────────┘
Four panes at once: raw logs, a normal back-and-forth conversation, a live simplified feed of what's happening behind the scenes, and a text input that stands in for your voice. Everything updates in real time as OVOS processes what you type.
What it does
- Logs - tails every OVOS service log it can find (bus, skills, audio, voice, GUI, PHAL, etc), color-coded by source, timestamps stripped for readability, errors bolded. Filter by source, log level, free text, or a specific skill - any combination, live, without restarting anything (with nothing checked in a category everything shows; checking one or more narrows to just those). Scroll up to read something and new lines won't yank you back down.
- Conversation - what you typed and what OVOS said back, plus what anyone else said to OVOS - the microphone (
🎤 Mic said: …), HiveMind clients, another ovos-tui-client (💻 laptop said: …) - and other TUIs' scripted test runs as they happen (their header shows⚠ laptop: Test: Weather - All 3/14), plus quiet status lines for everything else this tool does (service restarts, skill toggles, startup info) kept visually distinct so they don't clutter the actual conversation. - Activity - a simplified, human-readable feed of what's happening on the bus right now: which skill is handling the request, wake word and speech start/stop, which fallback skill caught something nothing else understood (and whether it actually resolved anything), and for content-reading requests specifically, which providers answered and at what confidence.
- A searchable command palette (
Ctrl+P) for everything else - restart a stuck service, activate or deactivate a skill, check the intent pipeline order, browse real example phrases pulled from installed skills' own metadata (search "Example"), or toggle any log filter - all searchable by typing, with results appearing right in the conversation pane instead of popup windows. A help panel (F1) covers the rest of the keybindings. - Scripted test runs - replay a skill's own golden test utterances (search "Test") or your own saved scripts (search "Script") against the live install, again and again. Every simulated utterance, OVOS's reply, a ✓/✗ per step and a closing summary land in the conversation pane - see Scripted test runs.
- Type what you'd say and press Enter, same as talking to a real OVOS device. Up/Down arrows browse what you've typed before, like shell history.
Why this is worth having
Testing OVOS by voice means dealing with wake-word misfires, STT mistakes, and no visibility into why something did or didn't happen. Typing directly and watching the activity feed skips all of that - and makes some genuinely hard-to-see things visible:
- See which skill actually answered - and which ones tried and gave up. Ask a factual question and watch each candidate skill respond in real time, including the ones that came back empty - useful for figuring out why you got a weird or unhelpful answer instead of a good one.
- Catch vocabulary gaps as you find them. Type a phrasing you'd expect to work; if nothing responds, or the wrong skill claims it, that's immediately visible instead of a silent failure you'd only notice by accident.
- Understand fallback behavior. When nothing matches normally, OVOS asks a chain of fallback skills whether they can help - the activity feed shows exactly which one stepped in, and whether it actually resolved anything or just apologized.
- Check the intent pipeline order without digging through config files. Search "pipeline" in the command palette to see every matching stage in the exact order OVOS evaluates them.
- Restart a stuck service in two keystrokes, without switching to another terminal.
None of this requires working audio hardware, a wake word, or STT accuracy getting in the way - just type.
Install
pip install ovos-tui-client
A container image is also published on every release - see Docker/Podman companion image below if that fits your setup better.
Usage
ovos-tui
Connects to 127.0.0.1:8181 by default. Options:
ovos-tui --host 192.168.1.50 --port 8181 --lang da-dk --log-dir ~/.local/state/mycroft --mycroft-conf ~/ovos/config/mycroft.conf
--log-dir: the log directory is auto-detected against a list of known candidate paths (which vary by OVOS install method). If nothing is found, the logs pane says so - pass this to point at the right directory explicitly.--mycroft-conf: path to a specificmycroft.conffor the pipeline view in the command palette to read. Only needed on Docker/Podman installs (see below) - without it, the pipeline view may read the wrong file or find nothing on those installs. It won't crash, but it won't be accurate either.
Scripted test runs
Replay the same utterances again and again against your real, running OVOS and see - step by step - whether each one lands on the skill and intent it should. Because it runs against the live install, with every other skill, fallback and persona present, it catches exactly the intent collisions an isolated CI test never sees.
Open the Command Palette (Ctrl+P):
Test: <Skill> - All- runs that skill's owntest/end2end/golden_utterances_<lang>.jsonl(the rows its CI asserts on) for the TUI's--lang.Test: All installed skillsruns every installed skill that has them.Test: <Skill> - Choose- opens a checklist of that skill's utterances, grouped by intent: tick single utterances or a whole intent group, filter long lists by text, then Run (Ctrl+R). Esc cancels. This is the one window in the tool - picking some of 100+ utterances is multi-select, which the palette can't do.Test: <Skill> - Last selection (N)- appears after a chosen run and replays exactly that subset again, no window (this session).Script: <name>- runs one of your own scripts from~/.config/ovos-tui-client/scripts/(or--scripts-dir).Script: Where do scripts go?prints the folder and format.Script: Stop running script- aborts a run.
While a script runs, the conversation pane gets a heavy yellow border
with the progress in its title (▶ Test: Weather - All 3/14), the header
shows the same, and the input box is disabled so typing can't
interleave with the script. Each step is written like typed input but
numbered ([3/14] You: …), followed by OVOS's reply and the verdict:
✓ weather.intent, ✗ expected …, got … or ⏱ no response. The run
ends with a summary line and the list of failing utterances.
Only routing is checked - which skill/intent handled the utterance - not the wording of the reply. Utterances go to your real OVOS: timers, alarms, media and so on really happen.
Where golden utterances come from. test/ isn't part of an
installed skill package, so they're looked up in this order:
--golden-dir DIR(repeatable): local checkouts, asDIR/<skill-repo>/test/end2end/golden_utterances_<lang>.jsonl- handy while you're changing a skill's golden file.- The skill's GitHub repo, found from the installed package's own
metadata (
url=in setup.py), fetched fresh on each run and cached in~/.cache/ovos-tui-client/golden/. Works for Docker/Podman installs too, as long as the skill package is also installed where the TUI runs - otherwise use--golden-dir. - That cache, when offline.
- No golden file anywhere? The skill's own
skill.jsonexamplesare used instead - checked at skill level only ("did this skill answer"), since examples carry no intent label.
Script format - *.txt is one utterance per line (# for
comments), sent without a check. *.jsonl uses the same rows as
golden files; skill_id/intent_label are optional, and a
{"golden": "<skill_id>"} row pulls in that skill's whole golden set:
# before a release: my own phrasings plus two skills' own tests
{"utterance": "hvad er klokken", "skill_id": "ovos-skill-date-time.openvoiceos", "intent_label": "what_time_is_it"}
{"utterance": "hvornår går solen ned"}
{"golden": "ovos-skill-weather.openvoiceos"}
{"golden": "ovos-skill-naptime.openvoiceos"}
A step counts as done on ovos.utterance.handled (newer ovos-core),
else on handler-complete / intent-failure, else - once something has
matched - after a few quiet seconds on the bus (ovos-core 2.1.x sends
no end-marker for pipeline plugins or converse captures), else after
30 s. If TTS started, it also waits for speech to end so replies don't
overlap. A skill stuck waiting in get_response() captures every
utterance; that's reported as such instead of a plain mismatch.
Each step is sent in its own OVOS session (like ovoscope's golden tests), so a skill left waiting for an answer in the default session, or a previous step's follow-up question ("shall I read you this one?"), can't capture the next step.
Running as a web app instead of in a terminal
pip install ovos-tui-client[web]
ovos-tui --web
Visit the printed URL in a browser and use the exact same interface -
no separate app, just this one running on a server instead of your
own terminal. --web-port sets the port (default 8000); --web-host
sets the address this binds to (auto-detected if you don't set
it, since guessing wrong here shows a broken, unstyled page instead of
a clear error).
When --web-host can't be both the bind address and the reachable one
--web-host doubles as the address baked into the page's own asset
and WebSocket URLs, so it normally needs to be both a) an address this
process can actually bind, and b) an address your browser can actually
reach. Usually that's the same value. It stops being the same value
behind Docker port-publishing, NAT, or a Home Assistant OS Supervisor
add-on's own isolated network namespace — confirmed directly while
packaging this as a Supervisor add-on: the container could bind
0.0.0.0 or its own internal hostname/IP just fine, but a real LAN IP
crashed it outright (OSError: could not bind on any address out of [...]) since a container can't bind an address it doesn't own without
host networking, and the addresses it could bind either got baked
into the page as literally http://0.0.0.0:8000/... (meaningless to a
browser) or only resolved via mDNS on networks that support it.
If that's your situation, add --web-public-url:
ovos-tui --web --web-host 0.0.0.0 --web-public-url http://192.168.1.50:8000
--web-host still controls the bind address (here, all interfaces —
always succeeds); --web-public-url overrides only the address
baked into the page, independent of that bind address. Set it to
whatever your browser actually reaches this server at. Leave it unset
and behavior is unchanged from before this flag existed — --web-host
alone still covers every normal case (running on a machine that owns
its own reachable address, no NAT in the way).
Docker/Podman installs
This tool runs on the host, not inside the same containers OVOS runs
in, so a couple of things need extra attention on a Docker/Podman
install - the notes below are based on reading ovos-docker's own
documentation directly, not guessed at:
- Logs work even with no log files on the host.
ovos-docker's own samplemycroft.confsets"logs": {"path": "stdout"}- on an install that follows that guide as written, there are no log files on the host filesystem at all, only container stdout. When this tool finds no log files but detects a Docker/Podman install, it automatically bridges each container'sdocker logs -f(orpodman logs -f) into the same small set of log files a normal install already produces -skills.log,audio.log,voice.log, etc, grouped by container name pattern (everyovos_skill_*container lands inskills.logtogether,ovos_audioinaudio.log, and so on; anything unrecognized goes toother.log) - not one file/ checkbox per container. Confirmed against a real ovos-docker install with 26 running containers: this keeps the Sources: checkboxes down to a handful of familiar categories with the usual colors, instead of two dozen individually-named ones. Bridge processes are cleaned up on quit. If bridging isn't possible for some reason (nodocker/podmanbinary available), it says so explicitly instead and points atdocker logs <container>/docker compose logs -fdirectly. - Services run as containers, not background services this tool
can query the usual way - it detects this and says so explicitly
(with a count, not a list of every container name -
docker ps/podman psalready exists for that), rather than just showing an unexplained empty result. Restarting a container from here isn't supported yet. - Skills -
Skill:activate/deactivate can be very limited on a distributed, one-container-per-skill install:skillmanager.list(the bus message this relies on) only reports skills loaded in the same process as whichever component answers it, which on this kind of install is basically nothing - confirmed directly against a real install. Not a bug in this tool specifically; there isn't currently a bus message with full visibility across a distributed skill deployment (tracked in issue #26). - Pipeline - see
--mycroft-confabove; also confirmed againstovos-docker's real.envvariables (OVOS_CONFIG_FOLDER, default/home/ovos/ovos/config), not assumed. - One real quirk worth knowing about: on some installs
ovos-messagebusruns as a native binary that logs via stdout/the systemd journal rather than a file - if abussource never shows up even though everything else does, that's likely why, not a bug here.
Docker/Podman companion image
Unlike every other OVOS container (audio, listener, messagebus, each skill), this one isn't a background service - it's an interactive terminal tool, so it needs a TTY attached to actually draw anything:
docker run -it --rm --network host ghcr.io/andlo/ovos-tui-client:latest
--network host is the simplest way to reach a messagebus already
listening on the host's 127.0.0.1:8181; on an ovos-docker install
specifically, joining that stack's own compose network and pointing
--host at the messagebus container's name instead works too, and is
usually the better fit if this is meant to run alongside it long-term.
Pass this tool's own flags after the image name, same as the pip
install - e.g. docker run -it --rm --network host ghcr.io/andlo/ovos-tui-client:latest --lang da-dk. --web works here
too (see above) - --network host is the reliable choice for it, so
the auto-detected address is the host's real one, not an internal
container-only address a browser outside can't reach.
If the same volumes ovos_core uses for config/logs are mounted into
this container too (-v/compose volumes:, matching whatever paths
that install already uses), this tool sees the real files directly at
their normal locations - no --mycroft-conf override or log-bridging
needed at all in that case, the same as a native install would.
Log bridging and Services: detection need the Docker/Podman socket
mounted in too, since this tool shells out to docker ps/docker logs -f - the image includes the docker CLI, but without the socket
(-v /var/run/docker.sock:/var/run/docker.sock) there's nothing for
it to talk to, and this tool quietly finds nothing rather than
erroring (confirmed via live testing: logs/services just show empty,
same as if there were genuinely no containers). Mounting the socket
is a real, deliberate security tradeoff - it hands this container
effective control over the host's whole Docker daemon - so it's
opt-in, not a default.
If mounted, the container's own non-root user won't have permission to
use the socket as-is. --user root on docker run fixes this on a
standard dockerd install (confirmed working) - matching the group
GID owning the socket instead is the more targeted alternative if
running as root isn't appealing:
docker run -it --rm --network host \
  -v /var/run/docker.sock:/var/run/docker.sock \
  --user root \
  ghcr.io/andlo/ovos-tui-client:latest
Confirmed NOT sufficient on its own under rootless Podman specifically
(even --user root didn't help there in testing) - if you're on
Podman rather than a standard root-owned dockerd socket, this may
need more digging into your specific setup.
Images are tagged by version (:0.1.24) and :latest, built and
published automatically on every release.
Why not just fix ovos-cli-client / neon-cli-client?
ovos-cli-client (last released March 2022) installs cleanly via pip,
but crashes immediately on launch on a fresh install:
ModuleNotFoundError: No module named 'ovos_utils.configuration' -
its ovos_utils dependency is unpinned, and the module it imports
from has since been removed/relocated in current ovos_utils
releases. It was never updated to match. Confirmed directly (pip install ovos-cli-client && ovos-cli-client) rather than assumed.
neon-cli-client pulls in neon-utils, which pins pyyaml~=5.4 - a
version with no prebuilt wheel for modern Python and a build script
incompatible with current setuptools (workaround: pin
setuptools<58 first).
Building this tool instead avoids both dependency chains, and adds genuinely useful features - toggleable/filterable logs, service restart, a simplified activity feed - neither of the above has.
No existing project fills this specific niche as of writing (checked the OpenVoiceOS GitHub org's repositories and general TUI project listings) - if that's changed by the time you're reading this, please open an issue and point at it.
Category
Development Tools
Tags
#ovos #tui #testing #cli #development
1 maintainer

Metadata
1 maintainer
Release files for ovos-tui-client 0.2.0a1
For a detailed explanation of source distributions (sdists) and built distributions (wheels), please see the package formats documentation.
Source distribution (sdist)
| File | Size | Uploaded | |
|---|---|---|---|
| ovos_tui_client-0.2.0a1.tar.gz | 124.2 kB | Details |
Built distribution (wheel)
| File | Interpreter | ABI | Platform | Reset |
|---|---|---|---|---|
| ovos_tui_client-0.2.0a1-py3-none-any.whl | Python 3 | none | any | Details |
Total release size: 207.9 kB
Release files / ovos_tui_client-0.2.0a1.tar.gz
| Download URL | ovos_tui_client-0.2.0a1.tar.gz |
|---|---|
| Size | 124.2 kB |
| Tags | Source |
|
SHA-256 checksum How to use checksums |
345dfbafa512fb849328ae273ba637b45309e56033d640de35515c913f235565
|
|
BLAKE2b-256 checksum How to use checksums |
c9cd154d4a14a27b188b5e2dd5a19fd67a9723a9a459a791fccfd354adbe5335
|
| Upload date | |
|
Uploaded using Trusted Publishing? What is trusted publishing? |
Yes |
| Uploaded via |
twine/7.0.0 CPython/3.13.14
|
Provenance
Provenance describes where a file came from. On PyPI, provenance is shared via attestations, which provide a verifiable record of the build or publishing details. View details, limitations and caveats.


PyPI Publish Attestation
PyPI verified that this artifact, at this checksum, originated from the publisher listed below.
Signed by GitHub Actions, verified by PyPI on Sep 28, 2026.
Transparency logRelease files / ovos_tui_client-0.2.0a1-py3-none-any.whl
| Download URL | ovos_tui_client-0.2.0a1-py3-none-any.whl |
|---|---|
| Size | 83.7 kB |
| Tags | Python 3 |
|
SHA-256 checksum How to use checksums |
2a3c82c2b98ef18497721eec3ec360131aad6fff09272614aa2a4874a7e8fb19
|
|
BLAKE2b-256 checksum How to use checksums |
a847883928d212c1259c14ef87d85bef3ceb35062e3bb2c9b219a0692f56d023
|
| Upload date | |
|
Uploaded using Trusted Publishing? What is trusted publishing? |
Yes |
| Uploaded via |
twine/7.0.0 CPython/3.13.14
|
Provenance
Provenance describes where a file came from. On PyPI, provenance is shared via attestations, which provide a verifiable record of the build or publishing details. View details, limitations and caveats.
PyPI Publish Attestation
PyPI verified that this artifact, at this checksum, originated from the publisher listed below.
Signed by GitHub Actions, verified by PyPI on Sep 28, 2026.
Transparency log













